

Echinocystic acid alleviated hypoxic-ischemic brain damage in neonatal mice by activating the PI3K/Akt/Nrf2 signaling pathway
- PMID: 36843928
- PMCID: PMC9947717
- DOI: 10.3389/fphar.2023.1103265
Echinocystic acid alleviated hypoxic-ischemic brain damage in neonatal mice by activating the PI3K/Akt/Nrf2 signaling pathway
Abstract
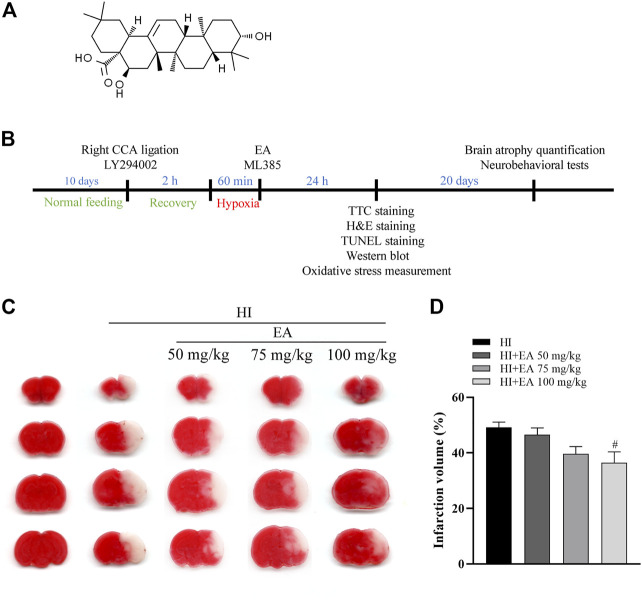
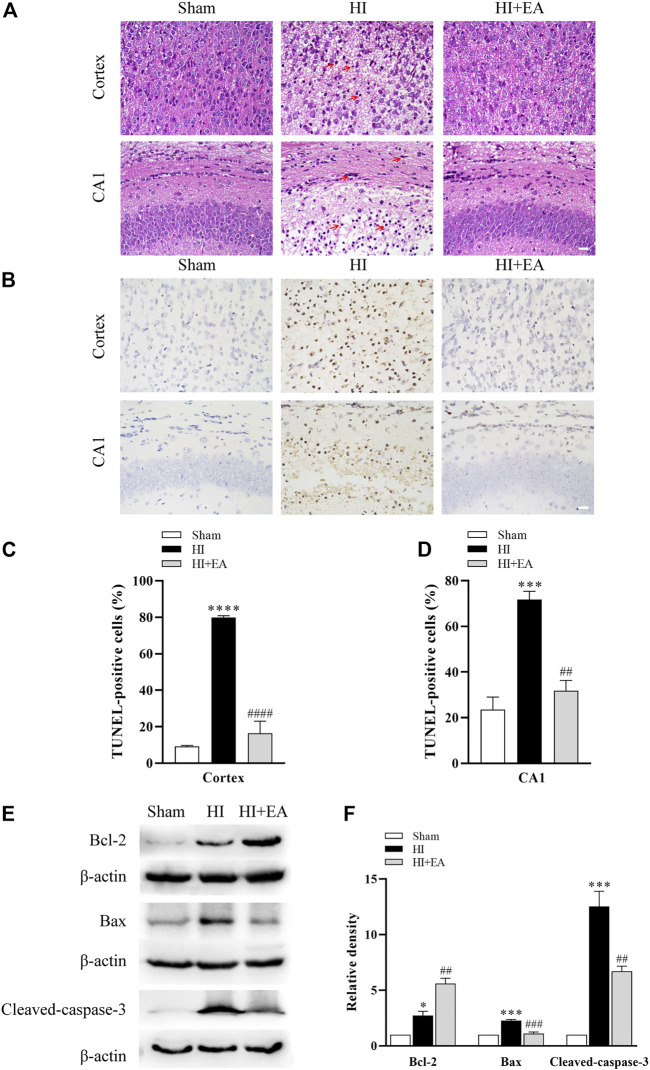
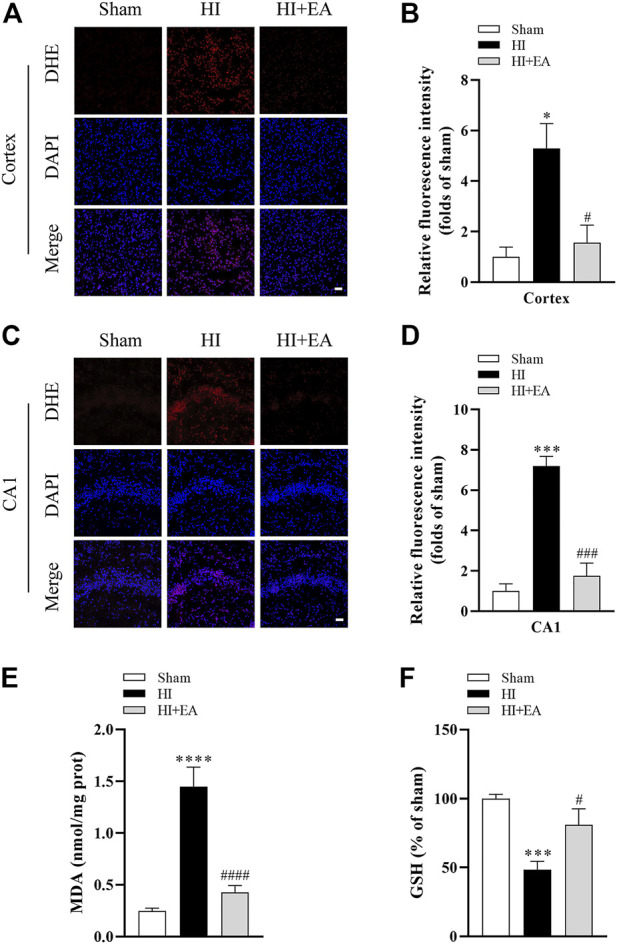
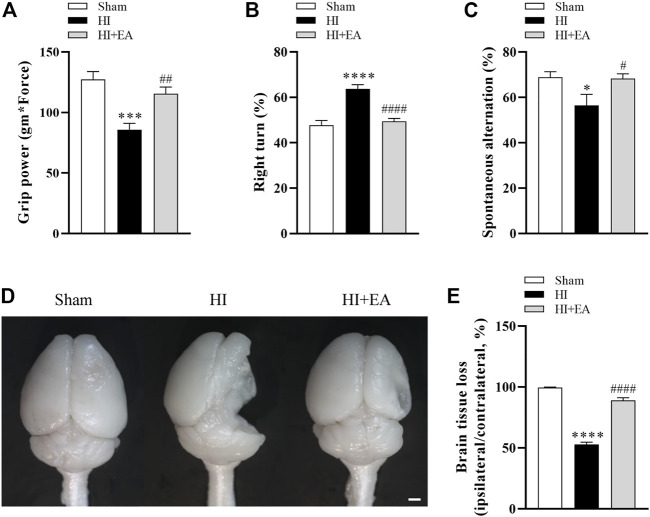
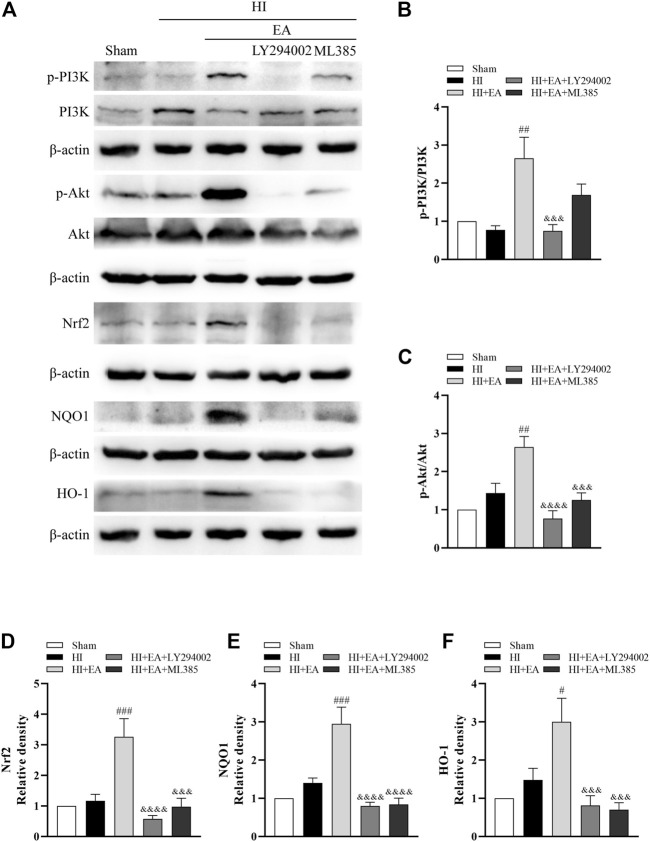
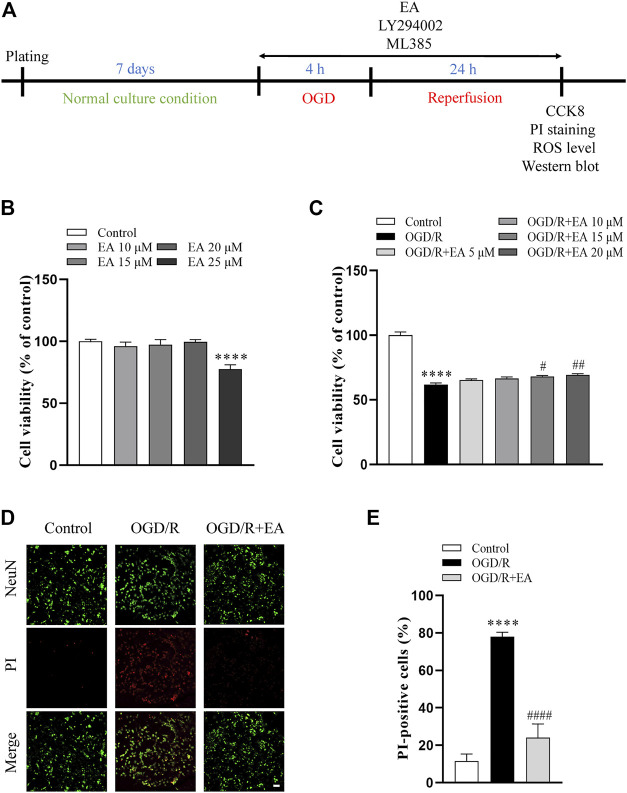
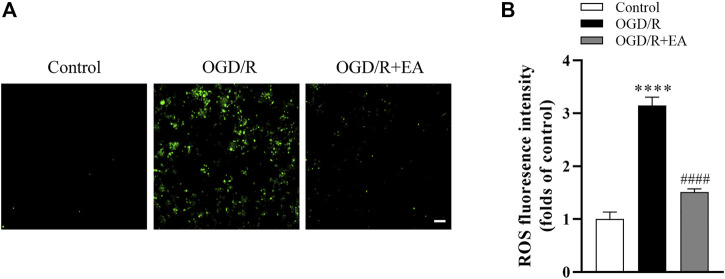
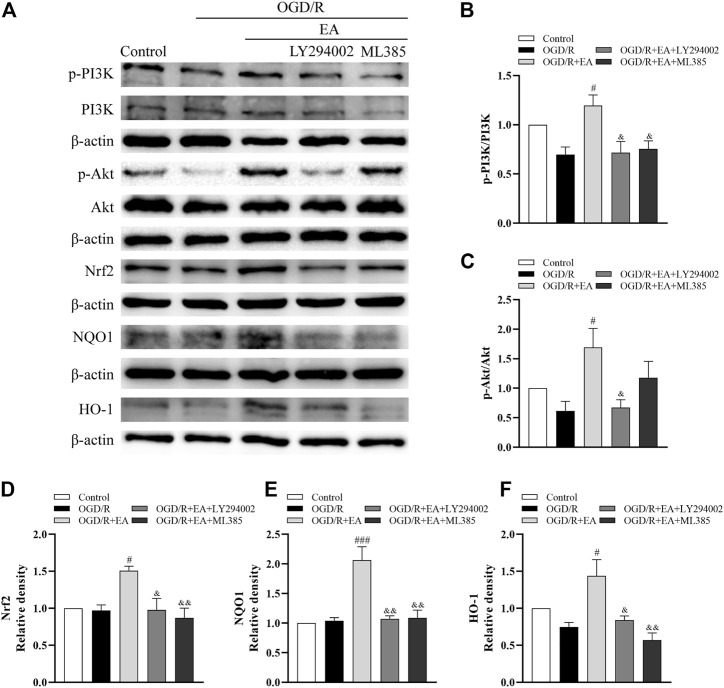
Neonatal hypoxic-ischemic encephalopathy (HIE) is considered a major cause of death and long-term neurological injury in newborns. Studies have demonstrated that oxidative stress and apoptosis play a major role in the progression of neonatal HIE. Echinocystic acid (EA), a natural plant extract, shows great antioxidant and antiapoptotic activities in various diseases. However, it has not yet been reported whether EA exerts a neuroprotective effect against neonatal HIE. Therefore, this study was undertaken to explore the neuroprotective effects and potential mechanisms of EA in neonatal HIE using in vivo and in vitro experiments. In the in vivo study, a hypoxic-ischemic brain damage (HIBD) model was established in neonatal mice, and EA was administered immediately after HIBD. Cerebral infarction, brain atrophy and long-term neurobehavioral deficits were measured. Hematoxylin and eosin (H&E), terminal deoxynucleotidyl transferase dUTP nick end labeling (TUNEL) and dihydroethidium (DHE) staining were performed, and the contents of malondialdehyde (MDA) and glutathione (GSH) were detected. In the in vitro study, an oxygen-glucose deprivation/reperfusion (OGD/R) model was employed in primary cortical neurons, and EA was introduced during OGD/R. Cell death and cellular ROS levels were determined. To illustrate the mechanism, the PI3K inhibitor LY294002 and Nrf2 inhibitor ML385 were used. The protein expression levels of p-PI3K, PI3K, p-Akt, Akt, Nrf2, NQO1, and HO-1 were measured by western blotting. The results showed that EA treatment significantly reduced cerebral infarction, attenuated neuronal injury, and improved brain atrophy and long-term neurobehavioral deficits in neonatal mice subjected to HIBD. Meanwhile, EA effectively increased the survival rate in neurons exposed to OGD/R and inhibited oxidative stress and apoptosis in both in vivo and in vitro studies. Moreover, EA activated the PI3K/Akt/Nrf2 pathway in neonatal mice following HIBD and in neurons after OGD/R. In conclusion, these results suggested that EA alleviated HIBD by ameliorating oxidative stress and apoptosis via activation of the PI3K/Akt/Nrf2 signaling pathway.
Keywords: HIBD; OGD/R; PI3K/Akt/Nrf2 pathway; apoptosis; echinocystic acid; neonatal; oxidative stress.
Copyright © 2023 Li, Chen, Zheng, Liu, Liu, Qi, Hu, Yang and Min.
Conflict of interest statement
The authors declare that the research was conducted in the absence of any commercial or financial relationships that could be construed as a potential conflict of interest.
Figures
Similar articles
-
Genistein mitigates oxidative stress and inflammation by regulating Nrf2/HO-1 and NF-κB signaling pathways in hypoxic-ischemic brain damage in neonatal mice.Ann Transl Med. 2022 Jan;10(2):32. doi: 10.21037/atm-21-4958. Ann Transl Med. 2022. PMID: 35282070 Free PMC article.
-
The neuroprotective mechanisms of naringenin: Inhibition of apoptosis through the PI3K/AKT pathway after hypoxic-ischemic brain damage.J Ethnopharmacol. 2024 Jan 10;318(Pt A):116941. doi: 10.1016/j.jep.2023.116941. Epub 2023 Jul 20. J Ethnopharmacol. 2024. PMID: 37480970
-
Echinocystic acid ameliorates ischemic acute kidney injury in neonatal rats by attenuating ferroptosis via the Nrf2/GPX4 pathway.Immunol Res. 2025 Mar 11;73(1):58. doi: 10.1007/s12026-025-09613-w. Immunol Res. 2025. PMID: 40067558
-
Nuclear Factor Erythroid 2-Related Factor 2 as a Potential Therapeutic Target in Neonatal Hypoxic-Ischemic Encephalopathy.J Integr Neurosci. 2024 May 16;23(5):103. doi: 10.31083/j.jin2305103. J Integr Neurosci. 2024. PMID: 38812389 Review.
-
Neuroprotective strategies for neonatal hypoxic-ischemic brain damage: Current status and challenges.Eur J Pharmacol. 2023 Oct 15;957:176003. doi: 10.1016/j.ejphar.2023.176003. Epub 2023 Aug 26. Eur J Pharmacol. 2023. PMID: 37640219 Review.
Cited by
-
Targeting PI3K/Akt in Cerebral Ischemia Reperfusion Injury Alleviation: From Signaling Networks to Targeted Therapy.Mol Neurobiol. 2024 Oct;61(10):7930-7949. doi: 10.1007/s12035-024-04039-1. Epub 2024 Mar 5. Mol Neurobiol. 2024. PMID: 38441860 Review.
-
Fecal microbiota transplantation from HUC-MSC-treated mice alleviates acute lung injury in mice through anti-inflammation and gut microbiota modulation.Front Microbiol. 2023 Sep 28;14:1243102. doi: 10.3389/fmicb.2023.1243102. eCollection 2023. Front Microbiol. 2023. PMID: 37840733 Free PMC article.
-
Oxidative stress in pediatric diseases associated with the origin of life and growth and development.Front Cell Dev Biol. 2025 Jul 15;13:1550765. doi: 10.3389/fcell.2025.1550765. eCollection 2025. Front Cell Dev Biol. 2025. PMID: 40735644 Free PMC article. Review.
-
Knockdown of miR-204-5p promotes nerve regeneration and functional recovery after hypoxic-ischemic brain damage in neonatal rats via the Wnt2/Ephrin-A2/EphA7 pathway.Neuroreport. 2025 Aug 6;36(11):609-622. doi: 10.1097/WNR.0000000000002184. Epub 2025 Jun 13. Neuroreport. 2025. PMID: 40530558 Free PMC article.
-
Impact of NQO1 dysregulation in CNS disorders.J Transl Med. 2024 Jan 2;22(1):4. doi: 10.1186/s12967-023-04802-3. J Transl Med. 2024. PMID: 38167027 Free PMC article. Review.
References
LinkOut - more resources
Full Text Sources
Miscellaneous