

Identification and validation of a novel cuproptosis-related genes signature associated with prognosis, clinical implications and immunotherapy of hepatocellular carcinoma
- PMID: 36843949
- PMCID: PMC9947158
- DOI: 10.3389/fphar.2023.1088993
Identification and validation of a novel cuproptosis-related genes signature associated with prognosis, clinical implications and immunotherapy of hepatocellular carcinoma
Abstract
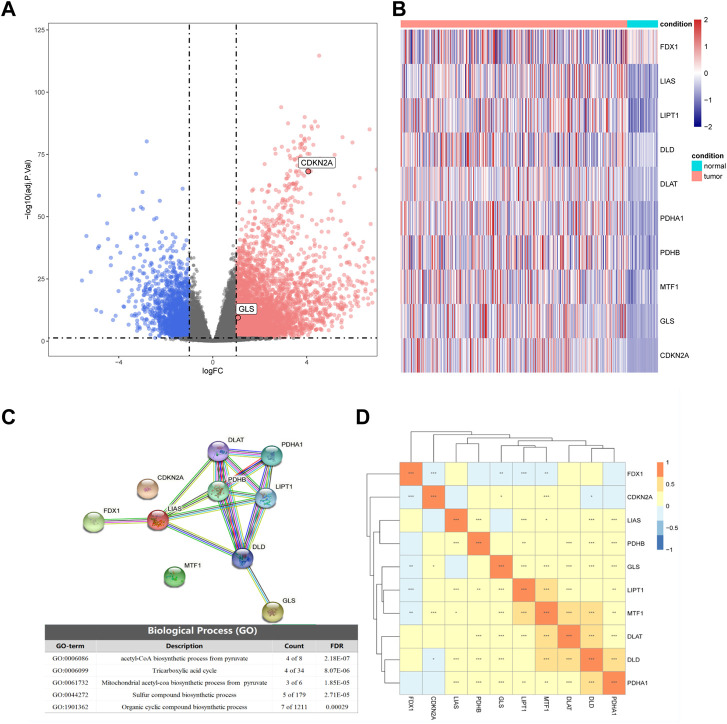
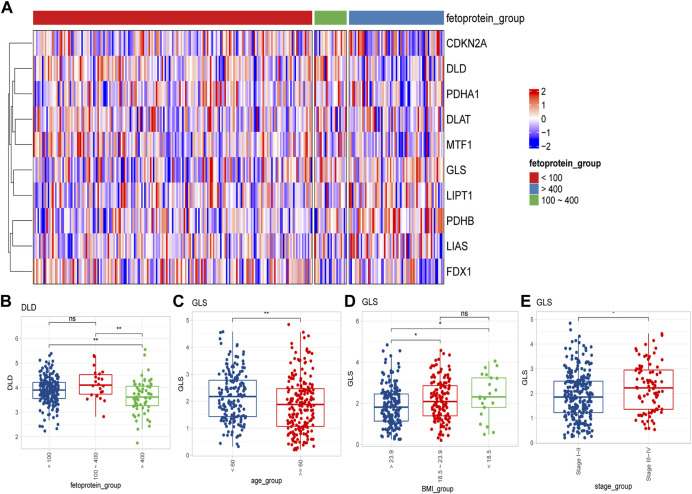
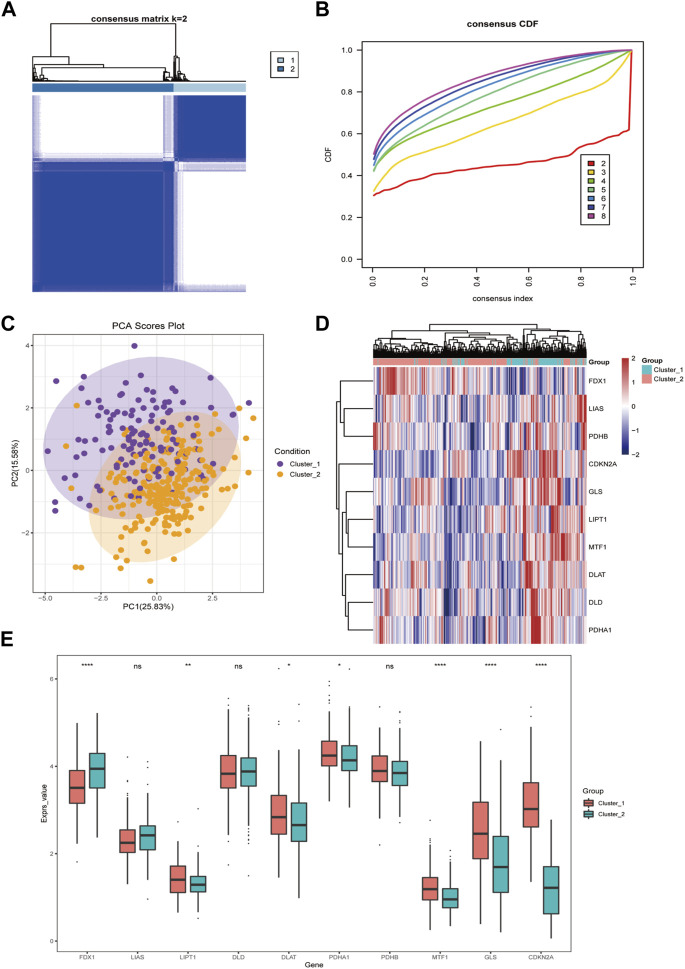
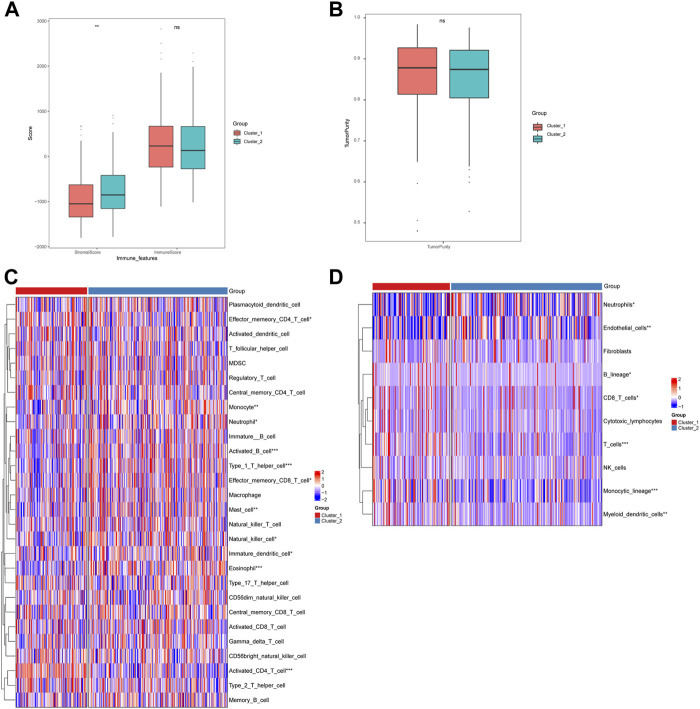
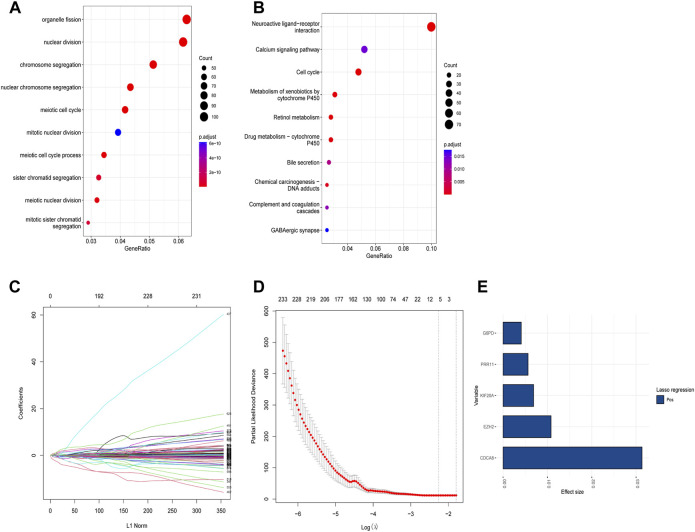
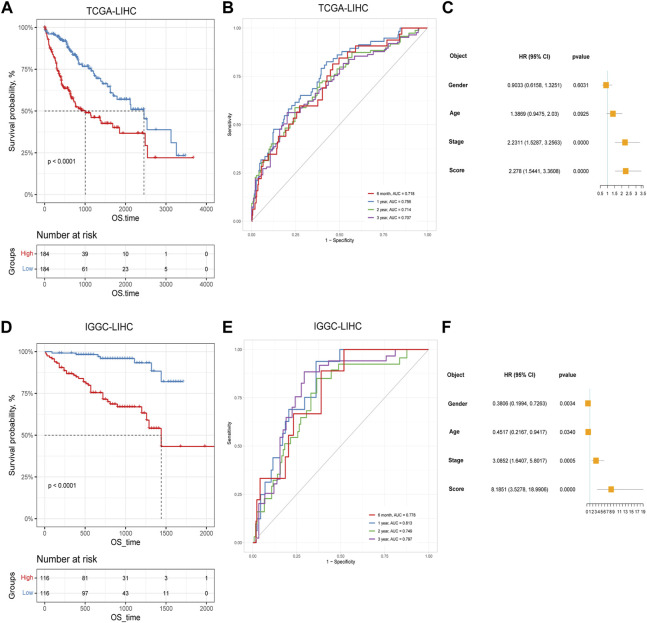
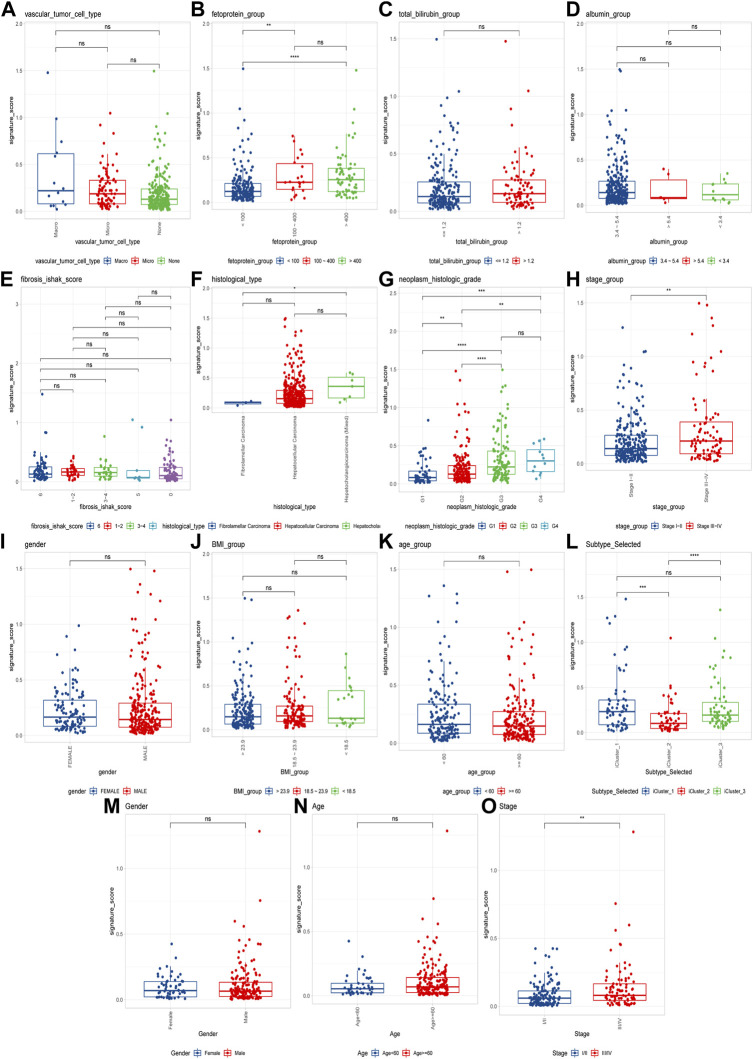
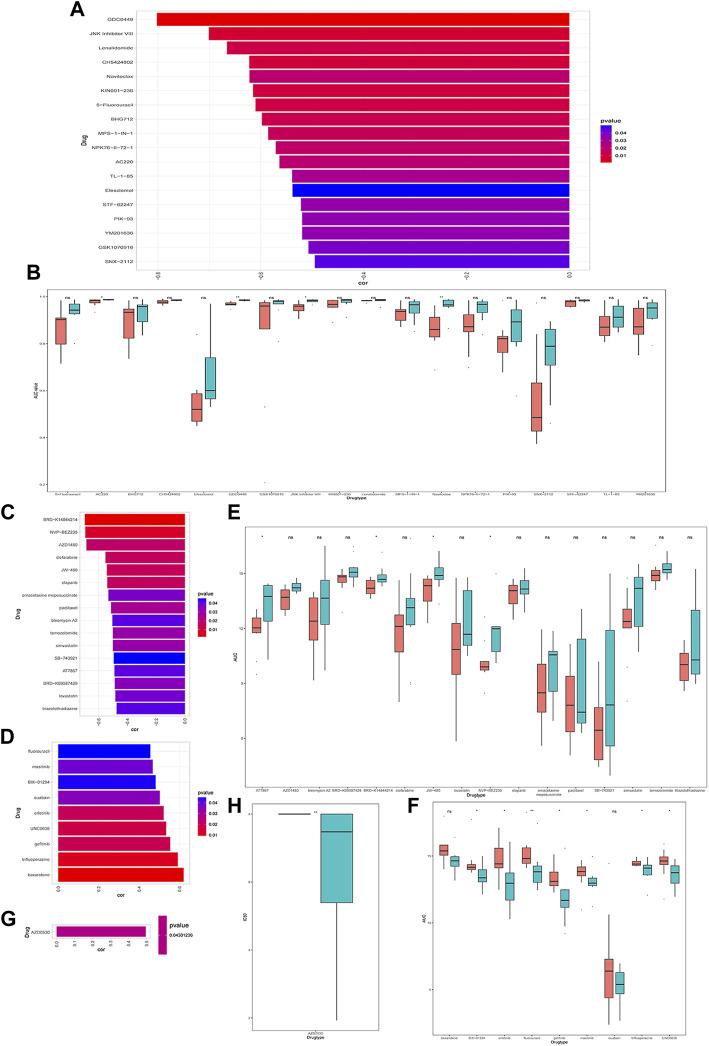
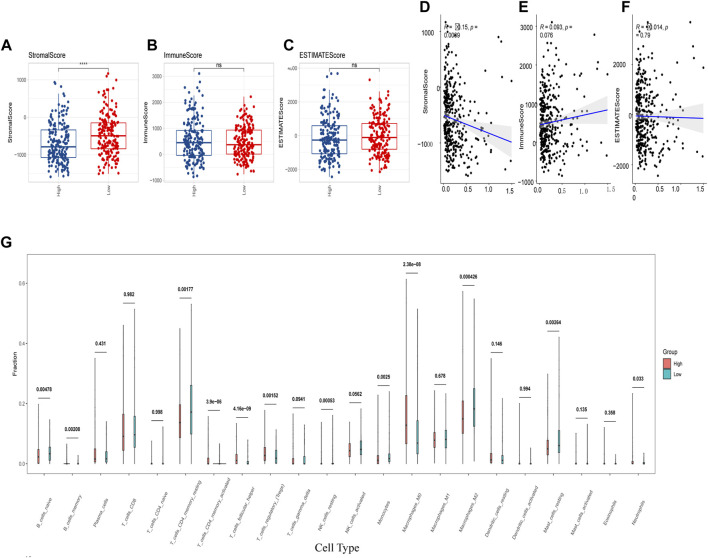
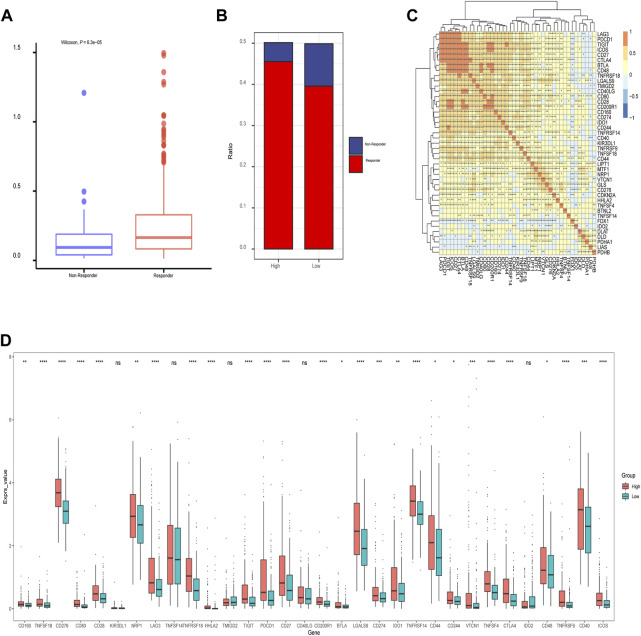
Background: Cuproptosis is a novel type of regulated cell death and is reported to promote tumor occurrence and progression. However, whether a cuproptosis-related signature has an impact on hepatocellular carcinoma (HCC) is still unclear. Materials and methods: We analyzed the transcriptome data of HCC from The Cancer Genome Atlas (TCGA) and International Cancer Genome Consortium (ICGC) database, and searched for tumor types with different cuproptosis patterns through consistent clustering of cuproptosis genes. We then constructed a Cuproptosis-Related Genes (CRGs)-based risk signature through LASSO COX regression, and further analyzed its impact on the prognosis, clinical characteristics, immune cell infiltration, and drug sensitivity of HCC. Results: We identified the expression changes of 10 cuproptosis-related genes in HCC, and all the patients can be divided into two subtypes with different prognosis by applying the consensus clustering algorithm. We then constructed a cuproptosis-related risk signature and identified five CRGs, which were highly correlated with prognosis and representative of this gene set, namely G6PD, PRR11, KIF20A, EZH2, and CDCA8. Patients in the low CRGs signature group had a favorable prognosis. We further validated the CRGs signature in ICGC cohorts and got consistent results. Besides, we also discovered that the CRGs signature was significantly associated with a variety of clinical characteristics, different immune landscapes and drug sensitivity. Moreover, we explored that the high CRGs signature group was more sensitive to immunotherapy. Conclusion: Our integrative analysis demonstrated the potential molecular signature and clinical applications of CRGs in HCC. The model based on CRGs can precisely predict the survival outcomes of HCC, and help better guide risk stratification and treatment strategy for HCC patients.
Keywords: cuproptosis-related genes; drug sensitivity; hepatocellular carcinoma; prognosis model; tumor microenvironment.
Copyright © 2023 He, Zeng, Ma, Yang, Liu, Liu, Zhou and Zhu.
Conflict of interest statement
The authors declare that the research was conducted in the absence of any commercial or financial relationships that could be construed as a potential conflict of interest.
Figures
Similar articles
-
Cuproptosis-Related Signature Predicts the Prognosis, Tumor Microenvironment, and Drug Sensitivity of Hepatocellular Carcinoma.J Immunol Res. 2022 Nov 16;2022:3393027. doi: 10.1155/2022/3393027. eCollection 2022. J Immunol Res. 2022. PMID: 36438201 Free PMC article.
-
A novel cuproptosis-related prognostic gene signature and validation of differential expression in hepatocellular carcinoma.Front Pharmacol. 2023 Jan 10;13:1081952. doi: 10.3389/fphar.2022.1081952. eCollection 2022. Front Pharmacol. 2023. PMID: 36703728 Free PMC article.
-
Ferroptosis and cuproptosis prognostic signature for prediction of prognosis, immunotherapy and drug sensitivity in hepatocellular carcinoma: development and validation based on TCGA and ICGC databases.Transl Cancer Res. 2023 Jan 30;12(1):46-64. doi: 10.21037/tcr-22-2203. Epub 2022 Dec 19. Transl Cancer Res. 2023. PMID: 36760376 Free PMC article.
-
Identification of a novel cuproptosis-related gene signature and integrative analyses in patients with lower-grade gliomas.Front Immunol. 2022 Aug 15;13:933973. doi: 10.3389/fimmu.2022.933973. eCollection 2022. Front Immunol. 2022. PMID: 36045691 Free PMC article. Review.
-
Cuproptosis: molecular mechanisms, cancer prognosis, and therapeutic applications.J Transl Med. 2025 Jan 22;23(1):104. doi: 10.1186/s12967-025-06121-1. J Transl Med. 2025. PMID: 39844182 Free PMC article. Review.
Cited by
-
Prognosis and chemotherapy drug sensitivity in liver hepatocellular carcinoma through a disulfidptosis-related lncRNA signature.Sci Rep. 2024 Mar 26;14(1):7157. doi: 10.1038/s41598-024-57954-7. Sci Rep. 2024. PMID: 38531953 Free PMC article.
-
Immunomodulation of cuproptosis and ferroptosis in liver cancer.Cancer Cell Int. 2024 Jan 10;24(1):22. doi: 10.1186/s12935-023-03207-y. Cancer Cell Int. 2024. PMID: 38200525 Free PMC article. Review.
-
A novel ferroptosis-related signature for predicting prognosis, immune characteristics, and treatment prediction in hepatocellular carcinoma.PLoS One. 2025 Jun 4;20(6):e0322158. doi: 10.1371/journal.pone.0322158. eCollection 2025. PLoS One. 2025. PMID: 40465746 Free PMC article.
-
Identification of copper death-associated molecular clusters and immunological profiles for lumbar disc herniation based on the machine learning.Sci Rep. 2024 Aug 20;14(1):19294. doi: 10.1038/s41598-024-69700-0. Sci Rep. 2024. PMID: 39164344 Free PMC article.
References
LinkOut - more resources
Full Text Sources
Research Materials
Miscellaneous