

Greece since the 1960s: the mortality transition revisited: a joinpoint regression analysis
- PMID: 36844416
- PMCID: PMC9944420
- DOI: 10.1007/s12546-023-09301-2
Greece since the 1960s: the mortality transition revisited: a joinpoint regression analysis
Abstract
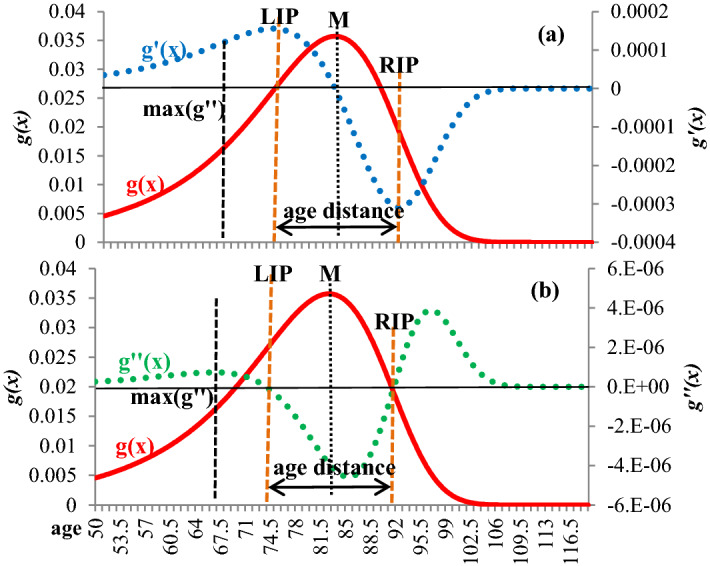
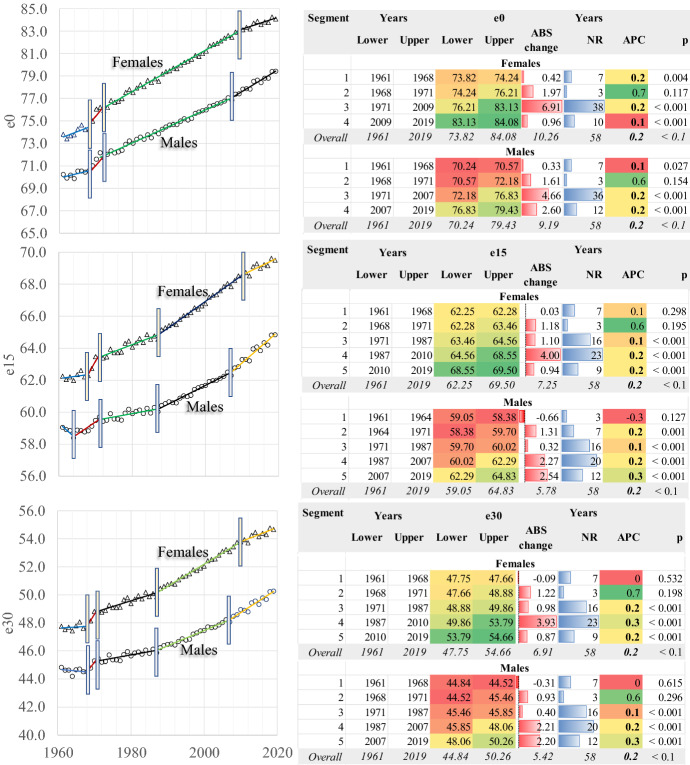
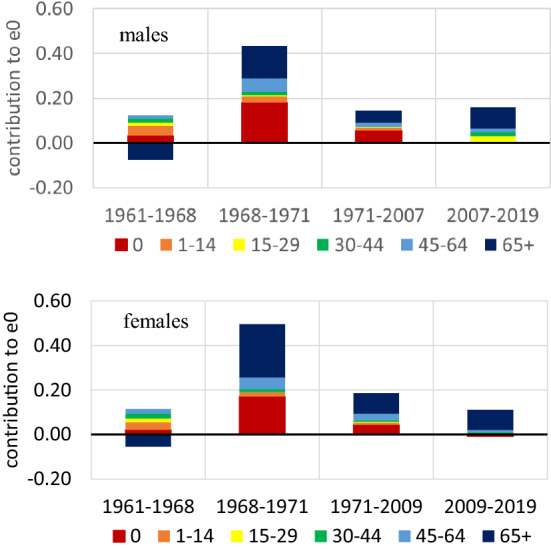
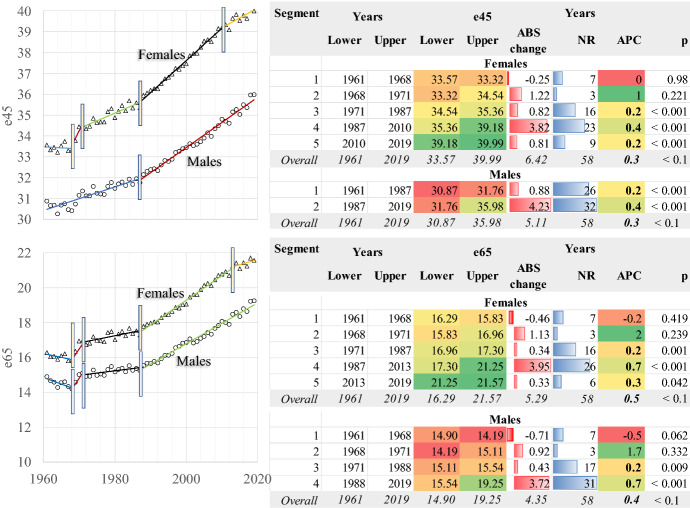
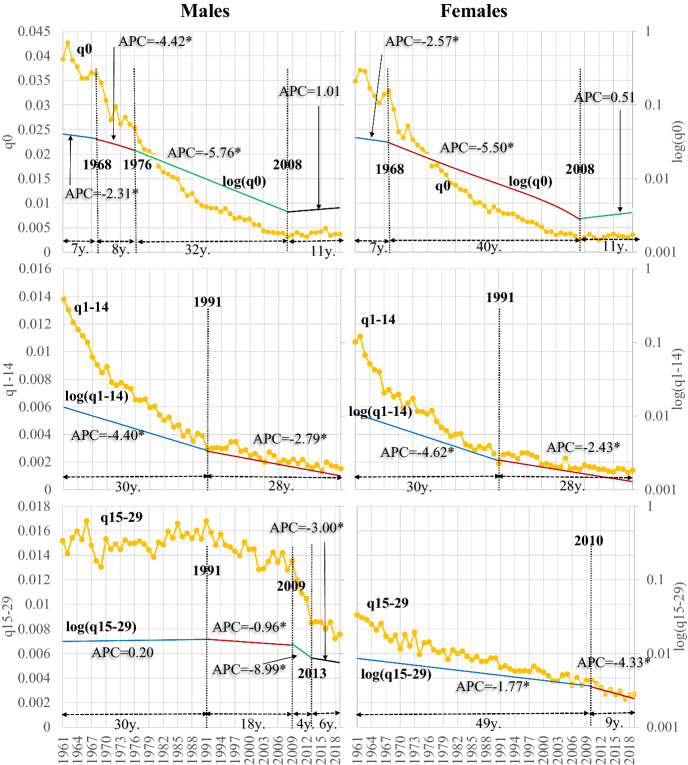
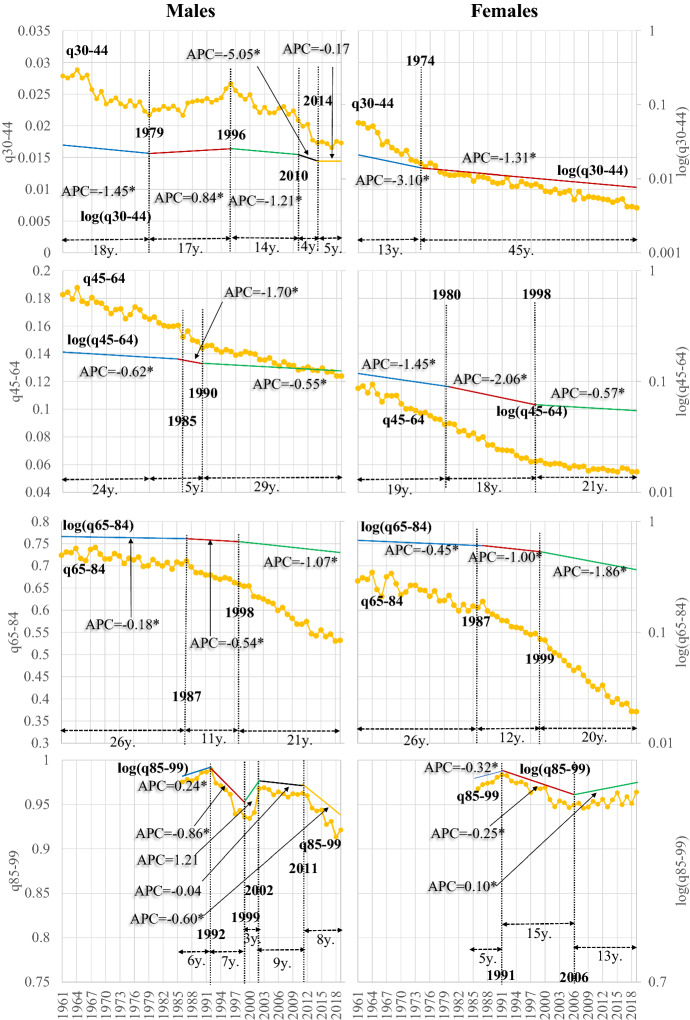
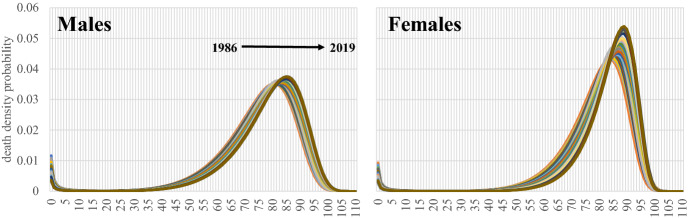
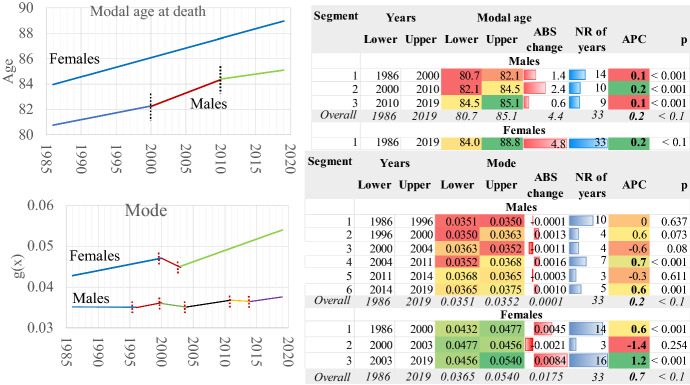
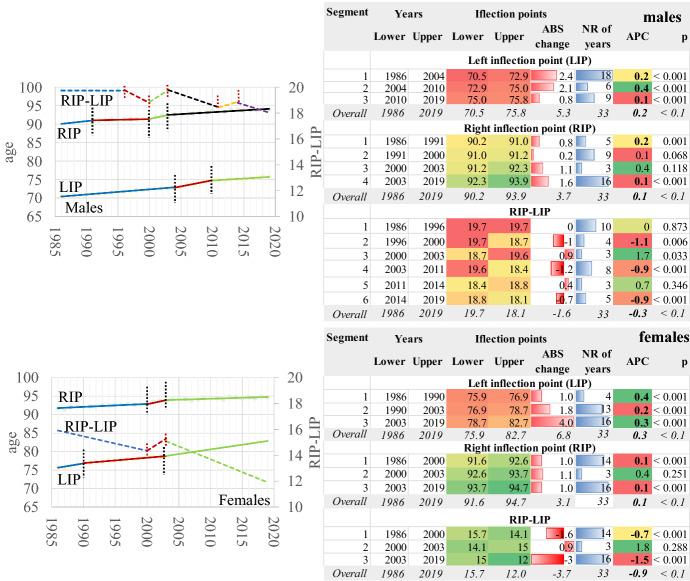
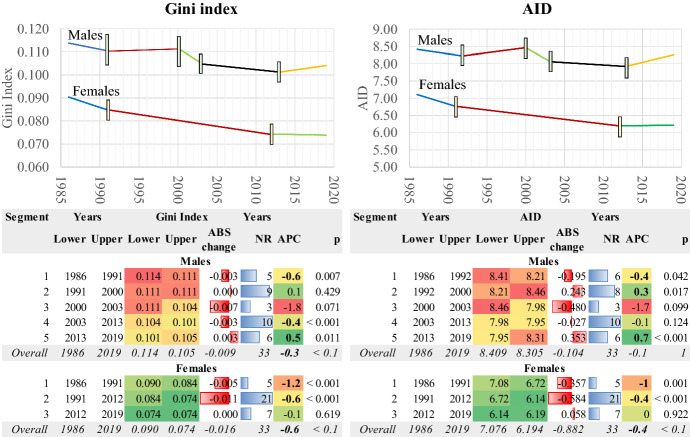
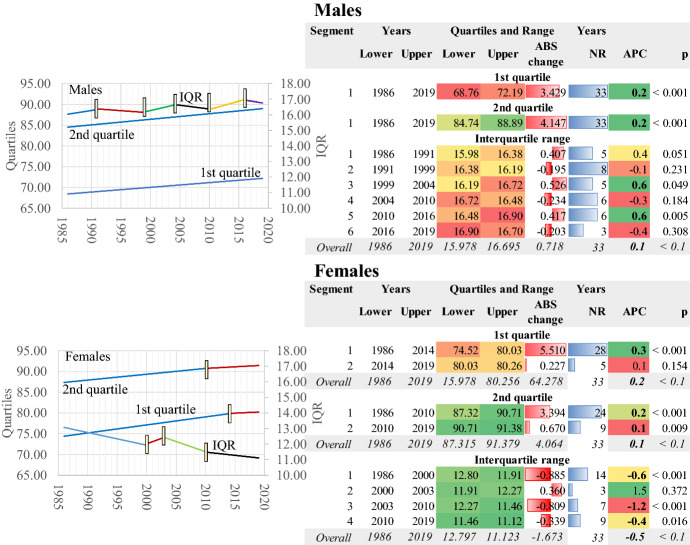
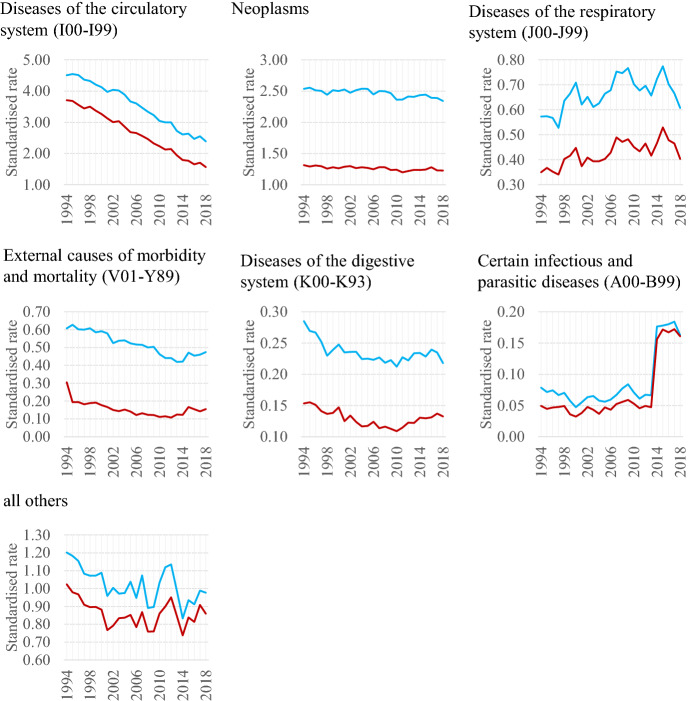
Mortality transition in Greece is a well-studied phenomenon in several of its aspects. It is characterised by an almost constant increase in life expectancy at birth and other ages and a parallel decrease in death probabilities. The scope of this paper is a comprehensive assessment of the mortality transition in Greece since 1961, in the light of holistic analysis. Within this paper, life tables by gender were calculated and the temporal trends of life expectancy at several ages were examined. Moreover, a cluster analysis was used in order to verify the temporal changes in the mortality patterns. The probabilities of death in large age classes are presented. Furthermore, the death distribution was analysed in relation to various parameters: the modal age at death, mode, left and right inflexion points and the length of the old age heap. Before that, a non-linear regression method, originating from the stochastic analysis, was applied. Additionally, the Gini coefficient, average inter-individual differences, and interquartile range of survival curves were examined. Finally, the standardised rates of the major causes of death are presented. All the analysis variables were scholastically examined for their temporal trends with the method of Joinpoint Regression analysis. Mortality transition in Greece after the year 1961 is asymmetrical with a gender and an age-specific component, leading to the elevation of life expectancy at birth over time. During this period, the older ages' mortality decreases, but at a slower pace than that of the younger ones. The modal age at death, mode, the left and right inflexion points and the width of the old age heap denote the compression of mortality in the country. The old age death heap shifts towards older ages, while at the same time, the variability of ages at death decreases, being verified by the Gini Coefficient and average inter-individual differences. As a result, the rectangularization of survival curves is evident. These changes have a different pace of transition over time, especially after the emergence of the economic crisis. Finally, the major causes of death were the diseases of the circulatory system, neoplasms, diseases of the respiratory system and others. The temporal trends of these diseases differ according to the diseases and gender. Greece's mortality transition is an asymmetrical stepwise process characterised by its gender and age-specific characteristics. This process, despite being a continuous one, is not linear. Instead, a combination of serious developments over time governs the country's modern mortality regime. The evaluation of Greece's mortality transition through the lens of more advanced analytical methods may provide new insights and methodological alternatives for assessing mortality transition in other countries of the world.
Keywords: Cluster analysis; Gini coefficient; Greece; Joinpoint analysis; Left and right inflexion points; Life expectancy; Modal age at death; Mode; Mortality transition; Non-linear regression; Probabilities of death.
© The Author(s) 2023.
Conflict of interest statement
Conflict of interestThe author declare that they have no conflict of interest, financial or otherwise.
Figures


Similar articles
-
Impact of the 1990 Hong Kong legislation for restriction on sulfur content in fuel.Res Rep Health Eff Inst. 2012 Aug;(170):5-91. Res Rep Health Eff Inst. 2012. PMID: 23316618
-
The global impact of noncommunicable diseases: estimates and projections.World Health Stat Q. 1988;41(3-4):255-66. World Health Stat Q. 1988. PMID: 3232413
-
Changing mortality patterns in East and West Germany and Poland. II: short-term trends during transition and in the 1990s.J Epidemiol Community Health. 2000 Dec;54(12):899-906. doi: 10.1136/jech.54.12.899. J Epidemiol Community Health. 2000. PMID: 11076985 Free PMC article.
-
[Mortality Atlas of the Campania Region. All-cause and cause-specific mortality at municipal level, 2006-2014].Epidemiol Prev. 2020 Jan-Feb;44(1 Suppl 1):1-144. doi: 10.19191/EP20.1.S1.P001.003. Epidemiol Prev. 2020. PMID: 33565290 Review. Italian.
-
[SENTIERI - Epidemiological Study of Residents in National Priority Contaminated Sites. Sixth Report].Epidemiol Prev. 2023 Jan-Apr;47(1-2 Suppl 1):1-286. doi: 10.19191/EP23.1-2-S1.003. Epidemiol Prev. 2023. PMID: 36825373 Italian.
Cited by
-
Maternal Age Trends and Patterns in Greece (1956-2023): A Nationwide Analysis.Cureus. 2025 Jul 13;17(7):e87827. doi: 10.7759/cureus.87827. eCollection 2025 Jul. Cureus. 2025. PMID: 40655068 Free PMC article.
References
-
- Arriaga EE. Changing trends in mortality declines during the last decades. In: Ruzicka L, Wunsch G, Kane P, editors. Differential mortality methodological issues and biosocial factors. Clarendon Press; 1989. pp. 105–129.
-
- Bergeron-Boucher M-P, Ebeling M, Canudas-Romo V. Decomposing changes in life expectancy: Compression versus shifting mortality. Demographic Research. 2015;33(14):391–424. doi: 10.4054/DemRes.2015.33.14. - DOI
-
- Canudas-Romo V. The modal age at death and the shifting mortality hypothesis. Demographic Research. 2008;19(30):1179–1204. doi: 10.4054/DemRes.2008.19.30. - DOI
LinkOut - more resources
Full Text Sources
Research Materials