. 2023 Jan 24;26(2):106040.
doi: 10.1016/j.isci.2023.106040. eCollection 2023 Feb 17.

Systematic diet composition swap in a mouse genome-scale metabolic model reveals determinants of obesogenic diet metabolism in liver cancer

Affiliations

Systematic diet composition swap in a mouse genome-scale metabolic model reveals determinants of obesogenic diet metabolism in liver cancer

Frederick Clasen et al. iScience. .

Abstract

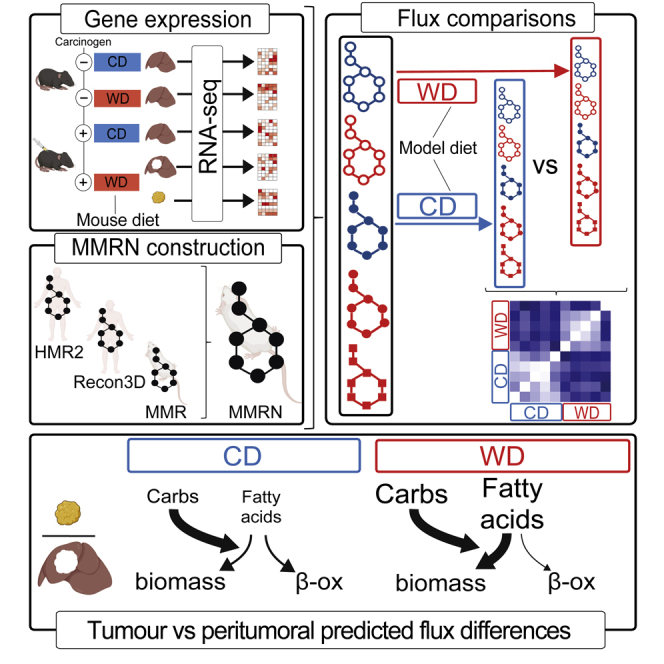
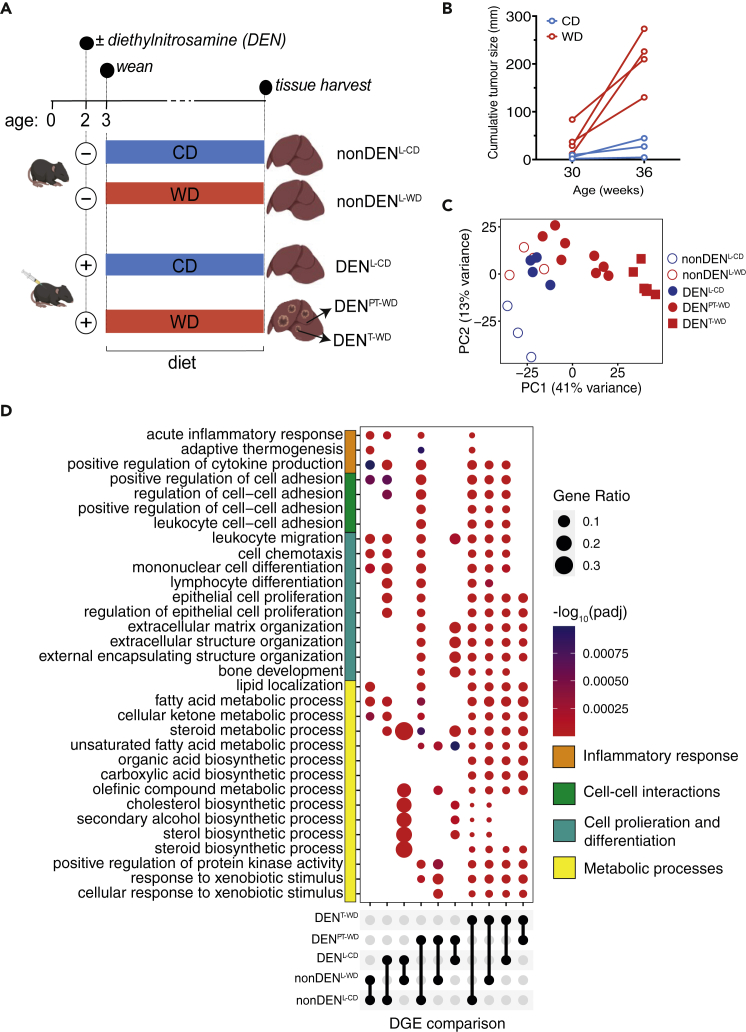
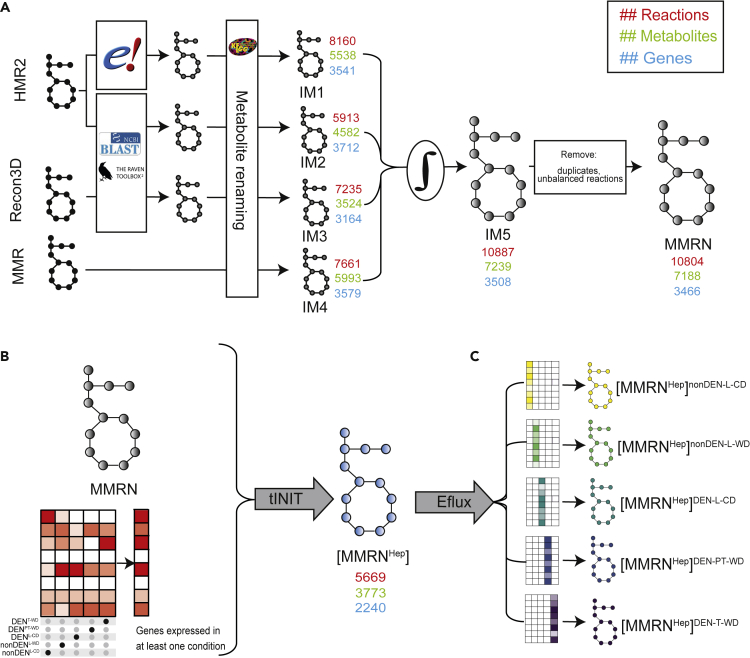
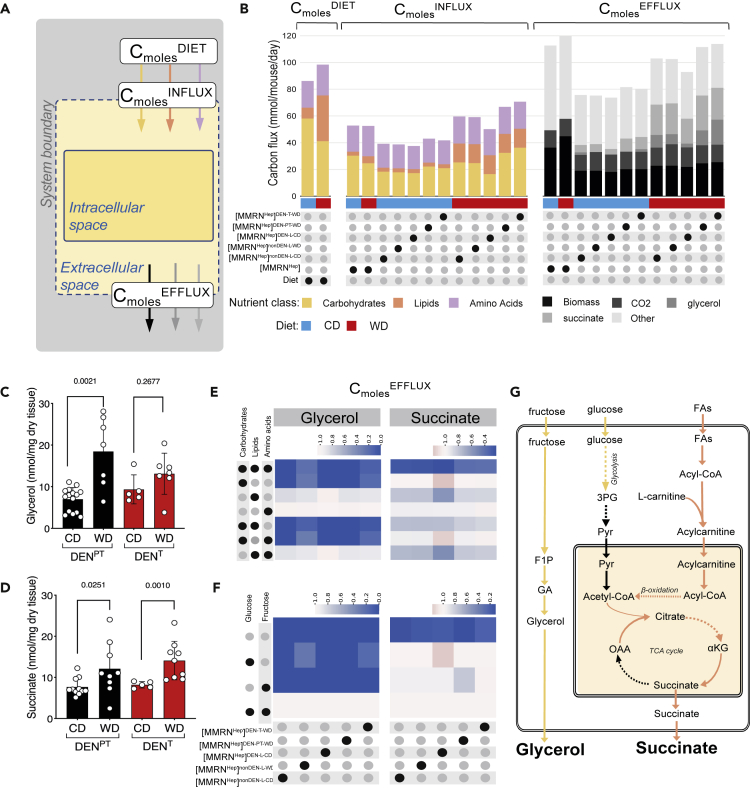
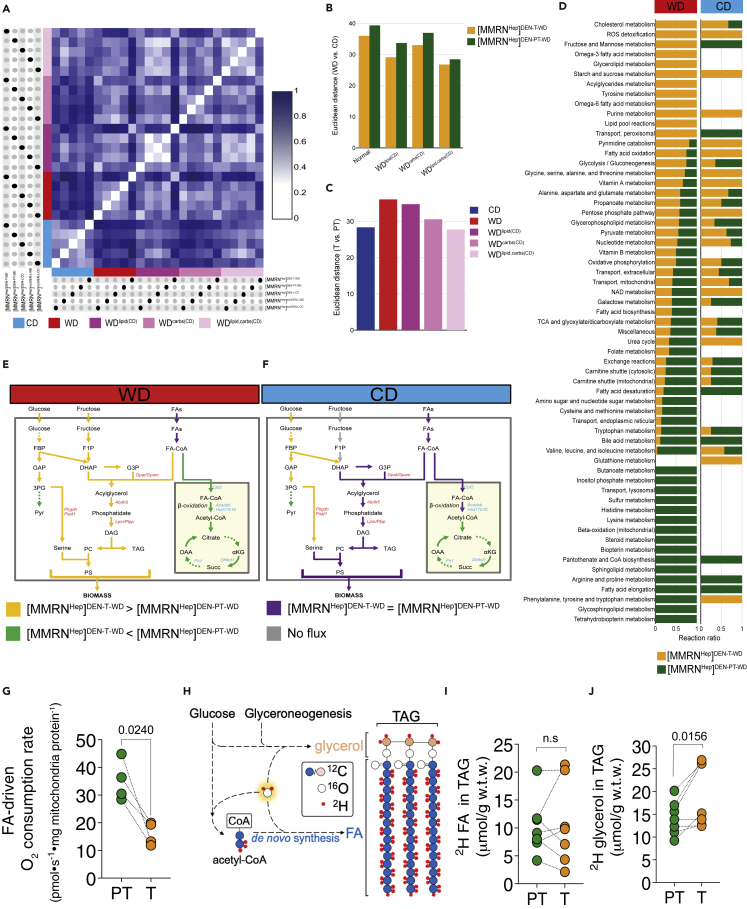
Dietary nutrient availability and gene expression, together, influence tissue metabolic activity. Here, we explore whether altering dietary nutrient composition in the context of mouse liver cancer suffices to overcome chronic gene expression changes that arise from tumorigenesis and western-style diet (WD). We construct a mouse genome-scale metabolic model and estimate metabolic fluxes in liver tumors and non-tumoral tissue after computationally varying the composition of input diet. This approach, called Systematic Diet Composition Swap (SyDiCoS), revealed that, compared to a control diet, WD increases production of glycerol and succinate irrespective of specific tissue gene expression patterns. Conversely, differences in fatty acid utilization pathways between tumor and non-tumor liver are amplified with WD by both dietary carbohydrates and lipids together. Our data suggest that combined dietary component modifications may be required to normalize the distinctive metabolic patterns that underlie selective targeting of tumor metabolism.

Keywords: Biological sciences; Cancer; Cellular physiology; Physiology.


Conflict of interest statement

The authors declare no competing interests.

Figures

None
Graphical abstract
Figure 1
Figure 1
A western diet promotes mouse liver cancer development and elicits distinct hepatic gene expression profiles (A) Summary of the experimental mouse liver cancer model and tissue sampling times in this study. Mice at two weeks of age were injected with the carcinogen diethylnitrosamine (DEN). Starting at the time of weaning, mice were fed a western diet (WD), or a matched control diet (CD). At 36 weeks of age mice were culled and liver tissue was harvested for RNA-sequencing. (B) Cumulative tumor size of three DENCD mice and four DENWD mice at 30 and 36 weeks of age measured by magnetic resonance imaging (MRI). Tumor burden in DENWD mice increases significantly more over time than that in DENCD mice (paired t-test, p value <0.05). (C) Principal component analysis (PCA) of gene expression data derived from RNA-Sequencing analysis of tissue samples described in panel A. (D) Gene ontology (GO) biological process over-representation test for differentially expressed genes using the enrichGO function and visualised with the dotplot function from the clusterProfiler package. For each comparison, the bottom condition is used as baseline. Benjamini-Hochberg correction was used with a q-value cut-off of 0.01 and is represented by dot color. Dot size represents the fractional number of genes enriched within a particular biological process compared to the total gene set size.
Figure 2
Figure 2
Outline of strategy for the construction of MMRN and derivative context-specific hepatic tissue models (A) Construction of Mouse Metabolic Reaction Network (MMRN) from four intermediate networks (IM1-4). For IM1, proteins in HMR2 were replaced with their known mouse orthologs from the Ensembl database. The RAVEN 2.0 Toolbox was used to generate IM2 and IM3 based on the sequence homology of mouse proteins to the protein sequences encoded by genes in HMR2 and Recon3D, respectively. Metabolites in IM1-3 were renamed to their corresponding KEGG identifiers (Table S2); similarly renaming metabolites in MMR resulted in IM4. IM1-4 were integrated into a single network, IM5. Duplicate and elementally unbalanced reactions were removed from IM5 to obtain MMRN. The effect of each step on key model attributes is shown by the number of reactions (red), metabolites (green) and genes (blue) adjacent to each model. (B) RNA-sequencing data were used to identify all genes that were expressed in at least one of the experimental conditions shown in Figure 1A. This list of genes, together with growth tasks and MMRN were used as input for the tINIT algorithm to reconstruct a generic hepatic GSMM, [MMRNHep]. MMRN and [MMRNHep] in MATLAB, SMBL and Excel format with corresponding code for simulations are available at https://github.com/sysbiomelab/MMRNHep. (C) [MMRNHep] was further constrained using an adapted Eflux method (see STAR Methods) and gene expression data for each experimental condition to produce five condition-specific GSMMs (csGSMMs). The Eflux method imposes flux boundaries on individual reactions based on TPM expression of all genes predicted to catalyze each reaction.
Figure 3
Figure 3
Selective dietary nutrient uptake and increased production of glycerol and succinate elicited by WD across all context-specific hepatic models in this study (A) Schematic illustrating relation between input and output carbon fluxes in the context of flux balance analysis (FBA) experiments shown in panels B, E, F and Figure S3. CmolesDIET represents the carbon flux for each metabolite that is available from the diet to [MMRNHep] and was calculated based on the known diet composition and daily diet consumption per mouse (Tables S1and S6 and Figure S1A). The dashed line represents a computational pseudo-boundary set to allow influx of metabolites from the diet into the extracellular space of the model. For a given metabolite, CmolesINFLUX and CmolesEFFLUX denote the flux of carbons of this metabolite taken up or produced, respectively, by [MMRNHep]. (B) CmolesDIET values of each of the major dietary nutrient classes (carbohydrates, lipids and amino acids) in CD and WD. Corresponding values of individual nutrient components is shown in Figure S3A. CmolesINFLUX and CmolesEFFLUX for [MMRNHep] and csGSMMs models provided with either CD or WD. (C) Amounts of glycerol in DENPT and DENT tissues from mice fed WD compared to respective tissues from CD-fed mice measured by GC-MS. Data are represented as mean ± SD. Numbers above bars indicate p values determined by a two-tailed Mann-Whitney test (n = 5–15 mice). (D) Amounts of succinate in DENPT and DENT tissues from mice fed WD compared to respective tissues from CD-fed mice measured by GC-MS. Data are represented as mean ± SD. Numbers above bars indicate p values determined by a two-tailed Mann-Whitney test (n = 5–15 mice). (E) Systematic Diet Component Swap (SyDiCoS) to assess the role of WD components on glycerol and succinate production flux in csGSMMs. CmolesDIET values for all three major diet component classes (carbohydrates, lipids and amino acids) in the WD were swapped individually or in combination with the corresponding CmolesDIET values in CD while leaving the remaining dietary CmolesDIET values of the WD unaltered. The swapped component(s) are indicated by black dots on the left. The color scale represents the ratio of glycerol production flux or succinate production flux in models provided with the swapped diet relative to the respective fluxes in models provided with WD, calculated for each csGSMM shown at the bottom of panel (F). (F) Assessment of the role of glucose or fructose from WD on glycerol and succinate production. csGSMMs shown at the bottom were provided WD containing only glucose or fructose (using their respective CmolesDIET values found in WD) as indicated by the black dots on the left, or both sugars (equivalent to the original WD composition) while leaving the CmolesDIET values for lipids and amino acids in WD unaltered. The color scale represents the ratio of glycerol production flux or succinate production flux in models provided with the modified WD inputs relative to the respective fluxes in models using the original WD composition, calculated for each csGSMM shown at the bottom. (G) Metabolic pathways that lead to increased production of glycerol and succinate in WD from fructose and FAs, respectively, derived from inspection of the flux distributions of csGMMS under various SyDiCoS conditions (panels E, F and Table S7). FAs: fatty acids; 3 PG: 3-phosphyglycerate; Pyr: pyruvate; F1P: fructose 1-phosphate; GA: glyceraldehyde; αKG: α-ketoglutarate; OAA: oxaloacetate.
Figure 4
Figure 4
Gene expression together with dietary nutrient availability dictate differential fate of FAs in tumors and peritumoral liver (A) Effects of diet composition on flux distribution differences between csGSMMs assessed by SyDiCoS. FBA was used to calculate the flux distribution for each csGSMM provided with CD, WD, WDlipid(CD), WDcarbs(CD) and WDlipid,carbs(CD). The color scale represents the Euclidean distance values calculated in a pairwise manner between each of the flux distributions and plotted relative to the maximum distance value across all comparisons. (B) Relative response to changes in diet composition of the flux distributions of tumoral or peritumoral models. Absolute Euclidean distances (from panel A) for either [MMRNHep]DENTWD or [MMRNHep]DEN−PTWD under different SyDiCoS conditions are plotted. (C) Effect of changes in diet composition on the flux distributions differences between tumoral and peritumoral models. Absolute Euclidean distances (from panel A) between [MMRNHep]DEN−TWD or [MMRNHep]DEN−PTWD under different SyDiCoS conditions are plotted. (D) Subsystems that include at least one reaction that carries flux in [MMRNHep]DEN−TWD or [MMRNHep]DEN−PTWD on either WD or CD. In each of these subsystems, the proportion of reactions with higher flux in [MMRNHep]DEN−TWD compared to [MMRNHep]DEN−PTWD on either WD or CD is plotted. For each diet, a reaction ratio = 1 for [MMRNHep]DEN−TWD in a given subsystem indicates that all reactions in that subsystem have higher flux compared to [MMRNHep]DEN−PTWD. (E and F) Flux differences between tumoral and peritumoral models fed either WD (E) or CD (F). These two networks are schematic representations of the metabolic network shown in Data S1, which comprises all the reactions of subsystems from panel (D) that have a reaction ratio = 1 (either all reactions that carry higher flux in [MMRNHep]DEN−TWD or in [MMRNHep]DEN−PTWD) and partake in lipid and carbohydrate metabolism. Differential fluxes for T and PT are colored according to the legend at the bottom of these panels. FBP: fructose 1,6-bisphosphate; GAP: glyceraldehyde 3-phosphate; 3 PG: 3-phosphoglycerate; Pyr: pyruvate; F1P: fructose 1-phosphate; DHAP: dihydroxyacetone phosphate; G3P: glycerol 3-phosphate; DAG: diacylglycerol; TAG: triacylglycerol; PC: phosphatidylcholine; PS: phosphatidylserine; FAs: fatty acids; FA-CoA: fatty acyl-CoA; αKG: α-ketoglutarate; Succ: succinate; OAA: oxaloacetate; Phgdh: Phosphoglycerate dehydrogenase; Psat1: Phosphoserine aminotransferase 1; Gpat: Glycerol 3-phosphate acyltransferase; Gpam: Glycerol 3-phosphate acyltransferase 1, mitochondrial; Abdh5: 1-acylglycerol 3-phosphate O-acyltransferase; Lpin: Phosphatidate phosphatase; Plpp: Pyridoxal phosphate phosphatase; Mogat1: Monoacylglycerol O-acyltransferase 1; Cpt2: Carnitine palmitoyltransferase 2; Acadsb: Acyl-CoA dehydrogenase short/branched chain; Hsd17b10: Hydroxysteroid 17-β dehydrogenase 10; Dhtkd1: Dehydrogenase E1 and transketolase domain containing 1; Fh1: Fumarate hydratase 1. (G) Comparison of FA-driven oxygen consumption rates in mitochondria isolated from liver tumors (T) or peritumoral (PT) tissues of mice treated as described in Figure 1A. Statistical significance determined by two-tailed paired t-test (n = 4 different mice, each providing a paired T and PT tissue sample from which mitochondria were isolated; oxygen consumption was measured in parallel for each T/PT sample pair). (H) Schematic showing metabolic routes of 2H incorporation into the glycerol backbone and fatty-acyl chains in a triglyceride (TAG) molecule after administration of 2H2O to mice. (I) Measurement of de novo synthesized fatty-acids (as outlined in H) in TAGs extracted from tumor (T) and peritumoural (PT) tissues. (J) Measurement of de novo synthesized glycerol (as outlined in H) in TAGs extracted from tumor (T) and peritumoral (PT) tissues. Statistical significance in (I) and (J) determined by Wilcoxon matched-pairs signed rank test (n = 7 different mice, each providing a paired T and PT tissue sample).

Similar articles

Cited by

References

    1. Carthew R.W. Gene regulation and cellular metabolism: an essential partnership. Trends Genet. 2021;37:389–400. doi: 10.1016/j.tig.2020.09.018. - DOI - PMC - PubMed
    1. Palm W., Thompson C.B. Nutrient acquisition strategies of mammalian cells. Nature. 2017;546:234–242. doi: 10.1038/nature22379. - DOI - PMC - PubMed
    1. Valery P.C., Laversanne M., Clark P.J., Petrick J.L., McGlynn K.A., Bray F. Projections of primary liver cancer to 2030 in 30 countries worldwide. Hepatology. 2018;67:600–611. doi: 10.1002/hep.29498. - DOI - PMC - PubMed
    1. Rahib L., Wehner M.R., Matrisian L.M., Nead K.T. Estimated projection of US cancer incidence and death to 2040. JAMA Netw. Open. 2021;4:e214708. doi: 10.1001/jamanetworkopen.2021.4708. - DOI - PMC - PubMed
    1. Burton A., Tataru D., Driver R.J., Bird T.G., Huws D., Wallace D., Cross T.J.S., Rowe I.A., Alexander G., Marshall A., HCC-UK/BASL/NCRAS Partnership Steering Group Primary liver cancer in the UK: incidence, incidence-based mortality, and survival by subtype, sex, and nation. JHEP Rep. 2021;3:100232. doi: 10.1016/j.jhepr.2021.100232. - DOI - PMC - PubMed