. 2023 Feb 22;13(2):e9837.
doi: 10.1002/ece3.9837. eCollection 2023 Feb.

From rivers to ocean basins: The role of ocean barriers and philopatry in the genetic structuring of a cosmopolitan coastal predator

Affiliations

From rivers to ocean basins: The role of ocean barriers and philopatry in the genetic structuring of a cosmopolitan coastal predator

Floriaan Devloo-Delva et al. Ecol Evol. .

Abstract

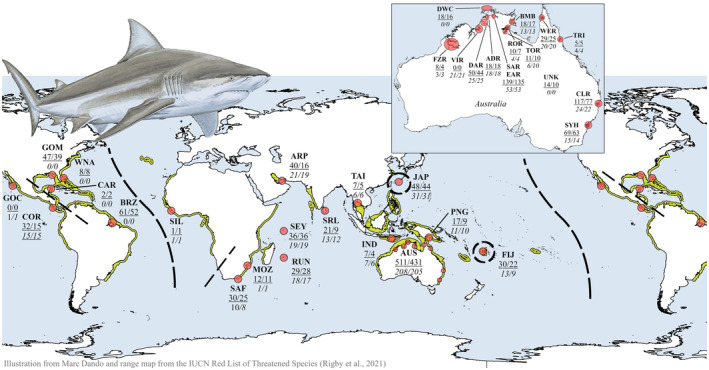
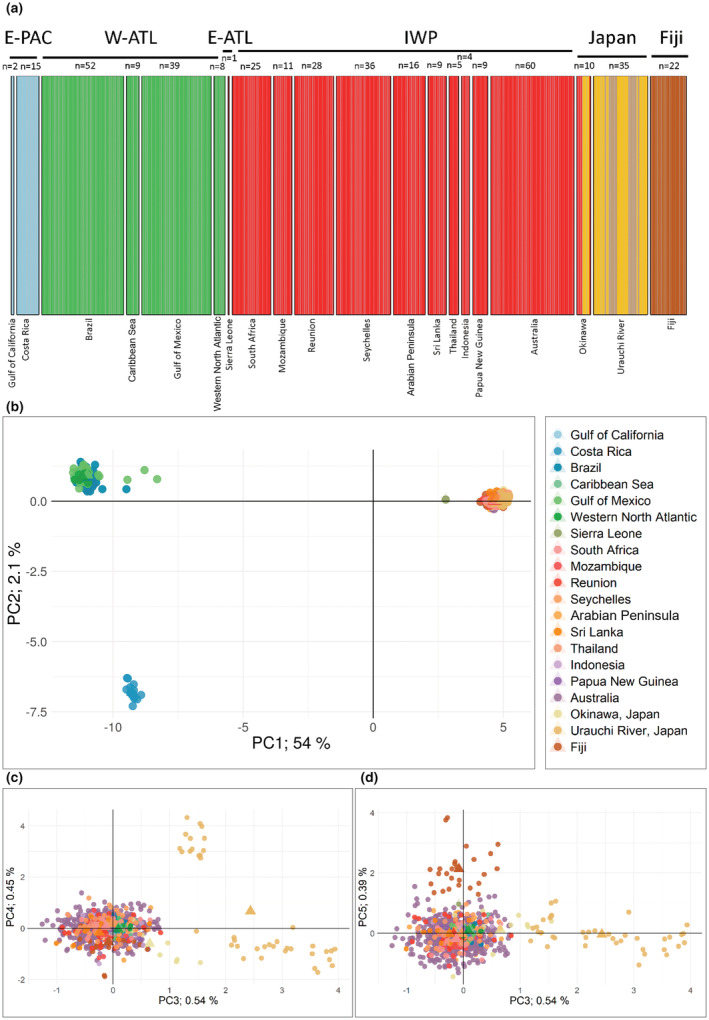
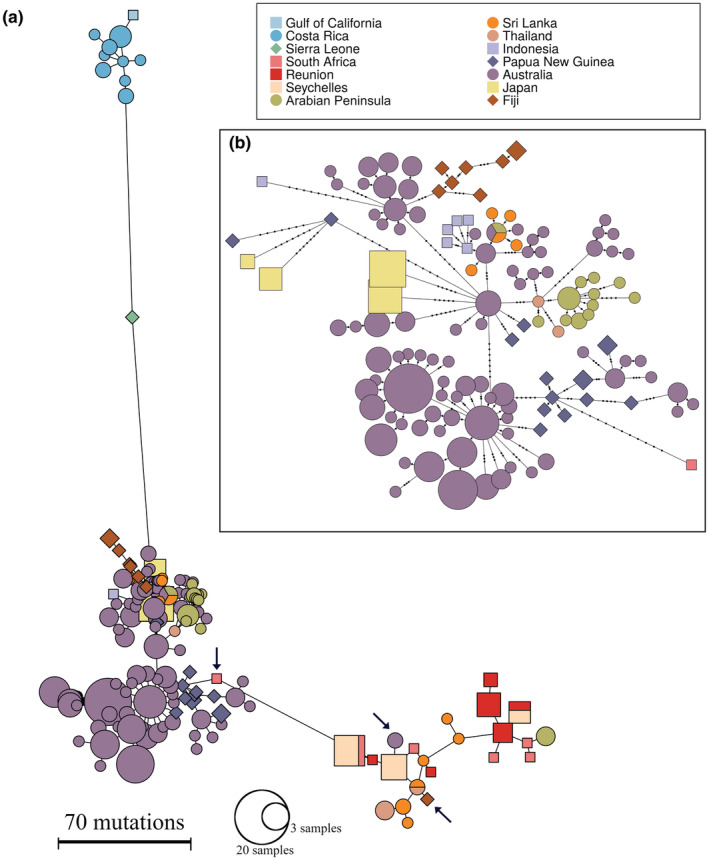
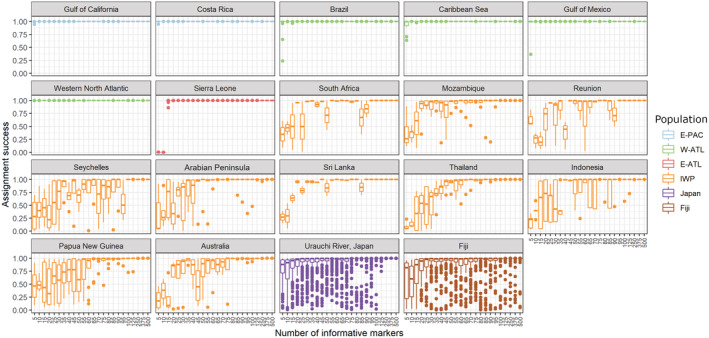
The Bull Shark (Carcharhinus leucas) faces varying levels of exploitation around the world due to its coastal distribution. Information regarding population connectivity is crucial to evaluate its conservation status and local fishing impacts. In this study, we sampled 922 putative Bull Sharks from 19 locations in the first global assessment of population structure of this cosmopolitan species. Using a recently developed DNA-capture approach (DArTcap), samples were genotyped for 3400 nuclear markers. Additionally, full mitochondrial genomes of 384 Indo-Pacific samples were sequenced. Reproductive isolation was found between and across ocean basins (eastern Pacific, western Atlantic, eastern Atlantic, Indo-West Pacific) with distinct island populations in Japan and Fiji. Bull Sharks appear to maintain gene flow using shallow coastal waters as dispersal corridors, whereas large oceanic distances and historical land-bridges act as barriers. Females tend to return to the same area for reproduction, making them more susceptible to local threats and an important focus for management actions. Given these behaviors, the exploitation of Bull Sharks from insular populations, such as Japan and Fiji, may instigate local decline that cannot readily be replenished by immigration, which can in turn affect ecosystem dynamics and functions. These data also supported the development of a genetic panel to ascertain the population of origin, which will be useful in monitoring the trade of fisheries products and assessing population-level impacts of this harvest.

Keywords: DArTseq; DNA forensics; close‐kin; genetic connectivity; mitogenome; provenance.


Conflict of interest statement

We note no conflict or competing interests among the authors in relation to the information provided in this manuscript.

Figures

FIGURE 1
FIGURE 1
Map indicating the Carcharhinus leucas sampling locations with red circles and the known species range distribution in yellow. The sample sizes for the SNP data are underlined with the number of samples before/after data filtering. The sample sizes for the mitogenome data are in italics with the number of samples before/after data filtering. Putative barriers for gene flow are indicated by dashed lines. GOC, Gulf of California; COR, Costa Rica; BRZ, Brazil; CAR, Caribbean Sea; GOM, Gulf of Mexico; WNA, Western North Atlantic; SIL, Sierra Leone; SAF, South Africa; MOZ, Mozambique; RUN, Réunion Island; SEY, Seychelles; ARP, Arabian Peninsula; SRL, Sri Lanka; TAI, Thailand; IND, Indonesia; PNG, Papua New Guinea; AUS, Australia; JAP, Japan; and FIJ, Fiji. Australian sampling locations were presented as an additional inset: FZR, Fitzroy River; VIR, Victoria River; DAR, Daly River; ADR, Adelaide River; DWC, Darwin Coastal; SAR, South Alligator River; EAR, East Alligator River; BMB, Blue Mud Bay; ROR, Roper River; TOR, Towns River; WER, Wenlock River; TRI, Trinity Inlet; CLR, Clarence River; SYH, Sydney Harbor; and UNK, Australian fisheries samples from unknown origin.
FIGURE 2
FIGURE 2
Population clustering analysis for the global Carcharhinus leucas dataset with a subsample of Australian sharks (DATA3: 382 sharks; 1849 SNPs). Panel a shows the Discriminant Analysis of Principal Components (DAPC) assignment barplot for K = 6 and 51 principal components (PC). Each bar represents an individual and is colored according to the posterior membership probabilities. Panels b–d represent the principal component analysis (PCA) scatterplot, where each point represents an individual shark, triangles indicate the mean PCA score per sampling location, and colors represent the sampling country or oceanographic location. (b) PCA scatterplot with PC1 on the x‐axis and PC2 on the y‐axis. (c) PCA scatterplot with PC3 on the x‐axis and PC4 on the y‐axis. (d) PCA scatterplot with PC3 on the x‐axis and PC5 on the y‐axis.
FIGURE 3
FIGURE 3
Carcharhinus leucas mtDNA haplotype network, based on the full mitogenome (16,707–16,708 bp). Panel a presents the network for all 361 sharks from the eastern Pacific, eastern Atlantic, Indo‐West Pacific, Japan, and Fiji. The distance between haplotypes reflects the number of mutations between them. Panel b shows the ‘eastern Indian Ocean/western Pacific/Japan/Fiji’ cluster in detail (285 sharks). Here, the number of mutations between haplotypes are represented by small black dots. In panels a and b, the size of the shape is equivalent to the square root of the number of individuals that share this haplotype. The color and shape of each haplotype corresponds to the sampling location where they were found. The three black arrows indicate haplotypes that represent recent maternal movement between haplotype clusters.
FIGURE 4
FIGURE 4
Reassignment success of Carcharhinus leucas respective to the number of informative markers to assign simulated mixtures to their population of origin (E‐PAC = eastern Pacific; W‐ATL = western Atlantic; E‐ATL = eastern Atlantic; IWP = Indo‐West Pacific; Japan = Urauchi River, Japan; and Fiji). The simulated mixtures are based on a leave‐one‐out resampling method in rubias. The assignment success was tested based on 5–500 informative markers that were selected according to their high DAPC loadings contribution from the adegenet package.

References

    1. Ali, O. A. , O'Rourke, S. M. , Amish, S. J. , Meek, M. H. , Luikart, G. , Jeffres, C. , & Miller, M. R. (2016). RAD capture (rapture): Flexible and efficient sequence‐based genotyping. Genetics, 202(2), 389–400. 10.1534/genetics.115.183665 - DOI - PMC - PubMed
    1. Anderson, E. C. , Waples, R. S. , & Kalinowski, S. T. (2008). An improved method for predicting the accuracy of genetic stock identification. Canadian Journal of Fisheries and Aquatic Sciences, 65(7), 1475–1486. 10.1139/F08-049 - DOI
    1. Archer, F. I. , Adams, P. E. , & Schneiders, B. B. (2017). strataG: An R package for manipulating, summarizing and analysing population genetic data. Molecular Ecology Resources, 17(1), 5–11. 10.1111/1755-0998.12559 - DOI - PubMed
    1. Arenas, M. , Pereira, F. , Oliveira, M. , Pinto, N. , Lopes, A. M. , Gomes, V. , Carracedo, A. , & Amorim, A. (2017). Forensic genetics and genomics: Much more than just a human affair. PLoS Genetics, 13(9), e1006960. 10.1371/journal.pgen.1006960 - DOI - PMC - PubMed
    1. Avise, J. C. , Bowen, B. W. , Lamb, T. , Meylan, A. B. , & Bermingham, E. (1992). Mitochondrial DNA evolution at a turtle's pace: Evidence for low genetic variability and reduced microevolutionary rate in the Testudines. Molecular Biology and Evolution, 9(3), 457–473. 10.1093/oxfordjournals.molbev.a040735 - DOI - PubMed