

Bioinformatics Analysis of Next Generation Sequencing Data Identifies Molecular Biomarkers Associated With Type 2 Diabetes Mellitus
- PMID: 36844983
- PMCID: PMC9944228
- DOI: 10.1177/11795514231155635
Bioinformatics Analysis of Next Generation Sequencing Data Identifies Molecular Biomarkers Associated With Type 2 Diabetes Mellitus
Abstract
Background: Type 2 diabetes mellitus (T2DM) is the most common metabolic disorder. The aim of the present investigation was to identify gene signature specific to T2DM.
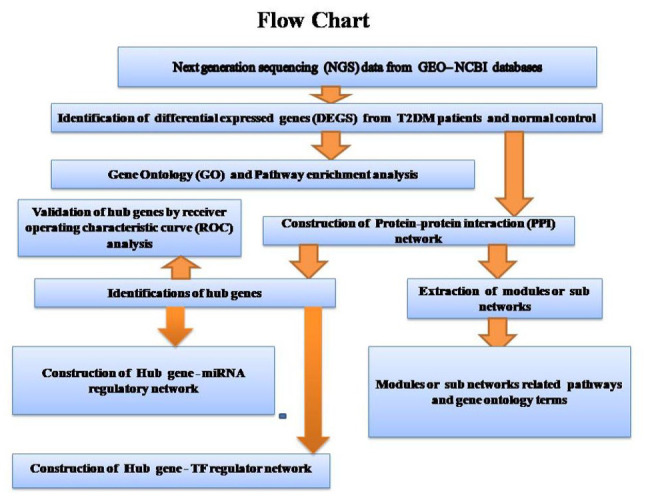
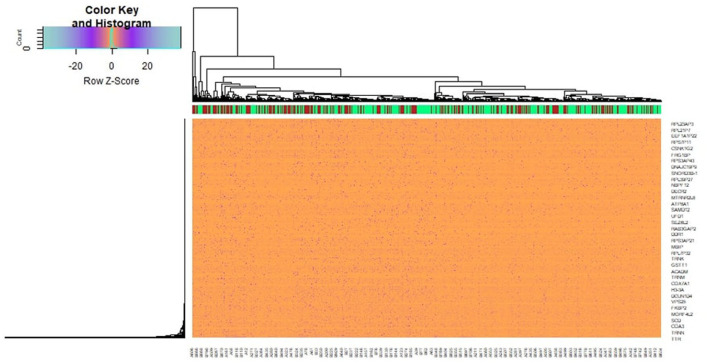
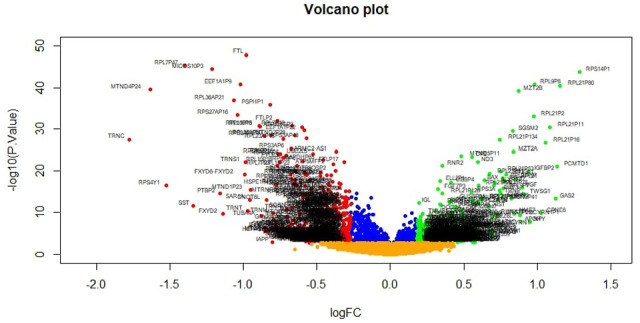
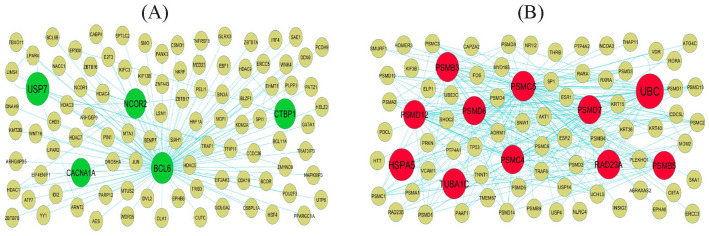
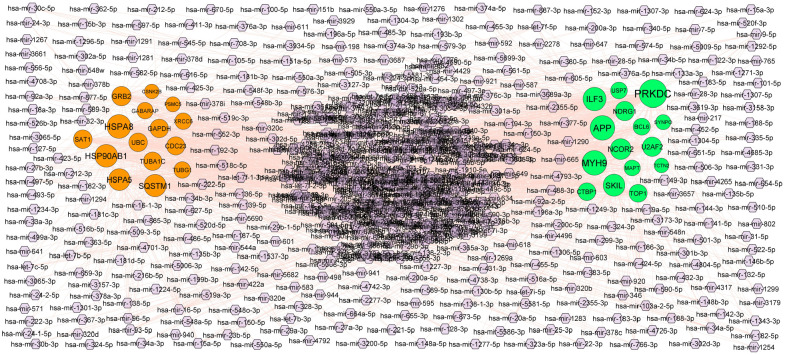
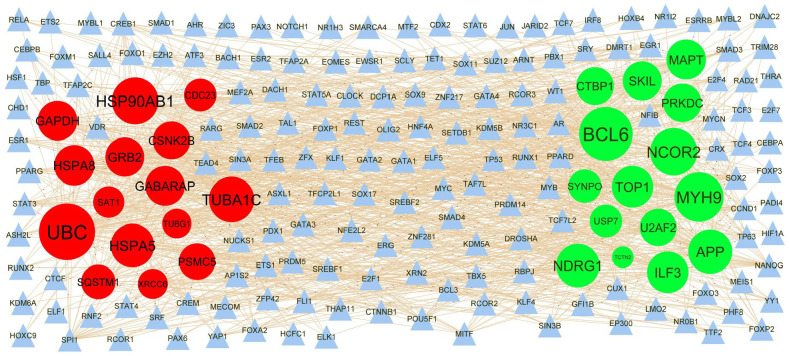
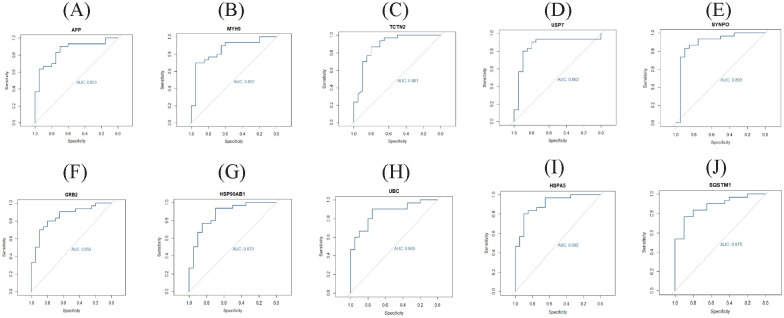
Methods: The next generation sequencing (NGS) dataset GSE81608 was retrieved from the gene expression omnibus (GEO) database and analyzed to identify the differentially expressed genes (DEGs) between T2DM and normal controls. Then, Gene Ontology (GO) and pathway enrichment analysis, protein-protein interaction (PPI) network, modules, miRNA (micro RNA)-hub gene regulatory network construction and TF (transcription factor)-hub gene regulatory network construction, and topological analysis were performed. Receiver operating characteristic curve (ROC) analysis was also performed to verify the prognostic value of hub genes.
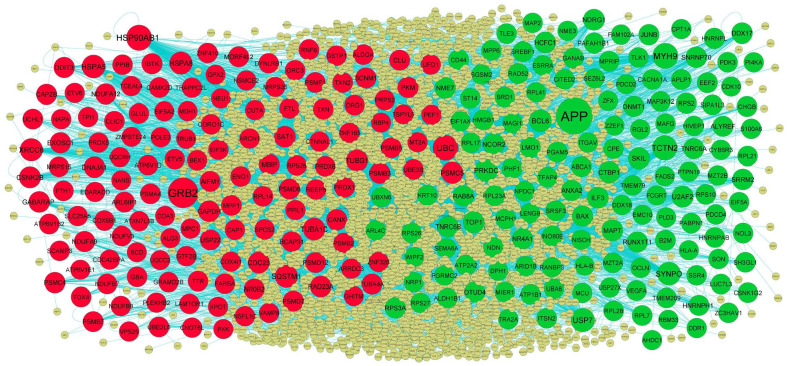
Results: A total of 927 DEGs (461 were up regulated and 466 down regulated genes) were identified in T2DM. GO and REACTOME results showed that DEGs mainly enriched in protein metabolic process, establishment of localization, metabolism of proteins, and metabolism. The top centrality hub genes APP, MYH9, TCTN2, USP7, SYNPO, GRB2, HSP90AB1, UBC, HSPA5, and SQSTM1 were screened out as the critical genes. ROC analysis provides prognostic value of hub genes.
Conclusion: The potential crucial genes, especially APP, MYH9, TCTN2, USP7, SYNPO, GRB2, HSP90AB1, UBC, HSPA5, and SQSTM1, might be linked with risk of T2DM. Our study provided novel insights of T2DM into genetics, molecular pathogenesis, and novel therapeutic targets.
Keywords: Type 2 diabetes mellitus; bioinformatics analysis; differentially expressed genes; hub genes; pathway enrichment analysis.
© The Author(s) 2023.
Conflict of interest statement
The author declared no potential conflicts of interest with respect to the research, authorship, and/or publication of this article.
Figures
References
-
- Caruso R, Magon A, Baroni I, et al. Health literacy in type 2 diabetes patients: a systematic review of systematic reviews. Acta Diabetol. 2018;55:1-12. - PubMed
-
- Magliano DJ, Sacre JW, Harding JL, Gregg EW, Zimmet PZ, Shaw JE. Young-onset type 2 diabetes mellitus - implications for morbidity and mortality. Nat Rev Endocrinol. 2020;16:321-331. - PubMed
LinkOut - more resources
Full Text Sources
Research Materials
Miscellaneous
