. 2023 Mar 17;26(3):106230.
doi: 10.1016/j.isci.2023.106230. Epub 2023 Feb 18.

Evolution of increased positive charge on the SARS-CoV-2 spike protein may be adaptation to human transmission

Affiliations

Evolution of increased positive charge on the SARS-CoV-2 spike protein may be adaptation to human transmission

Matthew Cotten et al. iScience. .

Abstract

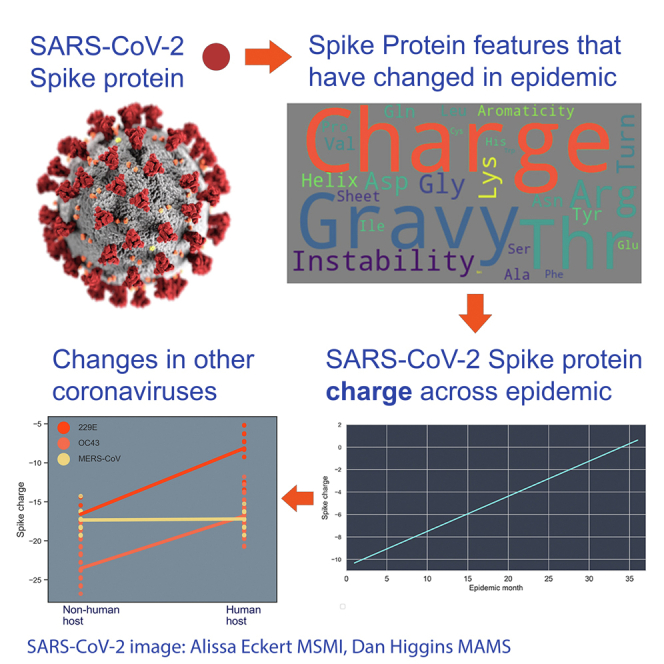
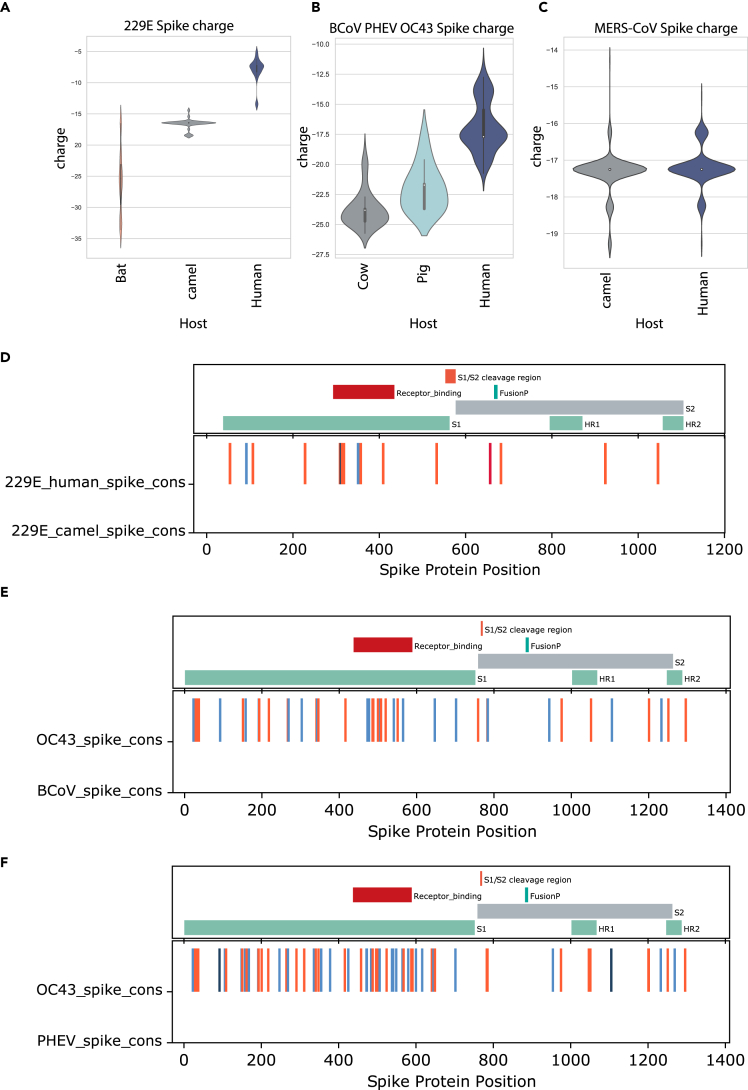
The severe acute respiratory syndrome coronavirus 2 (SARS-CoV-2) continues to evolve and infect individuals. The exterior surface of the SARS-CoV-2 virion is dominated by the spike protein, and the current work examined spike protein biochemical features that have changed during the 3 years in which SARS-CoV-2 has infected humans. Our analysis identified a striking change in spike protein charge, from -8.3 in the original Lineage A and B viruses to -1.26 in most of the current Omicron viruses. We conclude that in addition to immune selection pressure, the evolution of SARS-CoV-2 has also altered viral spike protein biochemical properties, which may influence virion survival and promote transmission. Future vaccine and therapeutic development should also exploit and target these biochemical properties.

Keywords: Evolutionary biology; Virology.


Conflict of interest statement

The authors declare no competing interests.

Figures

None
Graphical abstract
Figure 1
Figure 1
Identification of spike protein charge association with SARS-CoV-2 lineage (A) A set of 300 spike sequences extracted from the first 300 SARS-CoV-2 genomes per lineage (by date of collection) was analyzed, and features for each sequence were collected (see STAR Methods). SKLearn feature selection was used to identify features that most accurately identified the sequence lineage. The importance of features was ranked in order. (B) The top 8 features (charge, gravy, fraction T, fraction R, instability, fraction G, fraction D, and fraction K) were further used in a principal component analysis to cluster the same set of SARS-CoV-2 spike sequences. Each node represents a single spike sequence, and nodes were colored by Pangolin lineage assigned to the genome from which the spike sequence was obtained. Lineage coloring is explained in the right side of the panel. The proportion of variance explained by the first principal component was 64%, and for the first and second principal components, the proportion of variance explained was 84%.
Figure 2
Figure 2
Total SARS-CoV-2 spike charge by epidemic month and by lineage (A) Total SARS-CoV-2 spike charge per epidemic month. All available SARS-CoV-2 genomes up to November 15, 2022, were retrieved from GISAID, and the spike protein sequence was extracted (if intact). Total charge at pH 7.4 was calculated, and values were plotted using a violin plot by month of sample collection. For each epidemic month, the violin plot depicts the distributions of calculated spike charge for all available SARS-CoV-2 genomes. (B) Spike charge in major SARS-CoV-2 lineages. For each lineage, all available spike sequences were collected (up to November 15, 2022). Total charge at pH 7.4 was calculated, and violin plots were prepared to show the charge distribution by lineage. Lineages (indicated at bottom of chart) were ordered by their appearance in the epidemic. The first lineages of the main variants of concern and variants of interest are also labeled in the figure.
Figure 3
Figure 3
Recent changes in spike protein charge (A) All available spike proteins from genomes with sample collection dates of June to October 2022 were analyzed for total spike charge. A histogram of the calculate total spike charges for the entire set is shown here with the kernel density estimation (KDE) line in red. A major peak at −1.26 is observed, with small outlier peaks of genomes with more negative and more positive spike proteins. (B) For each month (over the period June 1 to October 31, 2022), the fraction of reported genomes for that month with charge greater than or less than the majority value of −1.26 was calculated.
Figure 4
Figure 4
Spike charges from select groups of coronaviruses that have moved into humans (A–C) All available full genomes for the indicated coronaviruses were retrieved from GenBank; the spike coding region was identified and translated into protein; and total charge at ph 7.4 was calculated. Violin plots indicate the charges of each collection of spike proteins; median values are indicated by the open square. (A) Coronavirus 229E from bat, camel, or human infections; (B) BCoV (from bovine infections), PHEV (from porcine infections), and OC43 (from human infection); (C) MERS-CoV from camel or human infection. (D–F) Consensus spike protein sequences were generated from the indicated virus groups, and charged amino acid (AA) changes were determined. Charge changes were colored dark blue (change from positively to negatively charged AA, blue change from neutral to negatively charged AA), orange (change from neutral to positively charged AA), and red (change from negative to positively charged AA). (D) 229E Spike from human infections compared to 229E spike from camel infections; (E) human OC43 spike compared to BCoV spike; (F) human OC43 spike compared to PHEV spike. Key spike protein features of each group’s spike protein are shown in the upper portion of each panel.

Similar articles

Cited by

References

    1. Adamczyk Z., Batys P., Barbasz J. SARS-CoV-2 virion physicochemical characteristics pertinent to abiotic substrate attachment. Curr. Opin. Colloid Interface Sci. 2021;55:101466. doi: 10.1016/j.cocis.2021.101466. - DOI - PMC - PubMed
    1. Greaney A.J., Starr T.N., Bloom J.D. An antibody-escape estimator for mutations to the SARS-CoV-2 receptor-binding domain. Virus Evol. 2022;8:veac021. doi: 10.1093/ve/veac021. - DOI - PMC - PubMed
    1. Tzou P.L., Tao K., Pond S.L.K., Shafer R.W. Coronavirus Resistance Database (CoV-RDB): SARS-CoV-2 susceptibility to monoclonal antibodies, convalescent plasma, and plasma from vaccinated persons. PLoS One. 2022;17:e0261045. doi: 10.1371/journal.pone.0261045. - DOI - PMC - PubMed
    1. Greaney A.J., Loes A.N., Crawford K.H.D., Starr T.N., Malone K.D., Chu H.Y., Bloom J.D. Comprehensive mapping of mutations in the SARS-CoV-2 receptor-binding domain that affect recognition by polyclonal human plasma antibodies. Cell Host Microbe. 2021;29:463–476.e6. doi: 10.1016/j.chom.2021.02.003. - DOI - PMC - PubMed
    1. Greaney A.J., Starr T.N., Barnes C.O., Weisblum Y., Schmidt F., Caskey M., Gaebler C., Cho A., Agudelo M., Finkin S., et al. Mapping mutations to the SARS-CoV-2 RBD that escape binding by different classes of antibodies. Nat. Commun. 2021;12:4196. doi: 10.1038/s41467-021-24435-8. - DOI - PMC - PubMed

LinkOut - more resources