. 2023 Mar 17;26(3):106260.
doi: 10.1016/j.isci.2023.106260. Epub 2023 Feb 21.

Demultiplexing Ig repertoires by parallel mRNA/DNA sequencing shows major differential alterations in severe COVID-19

Affiliations

Demultiplexing Ig repertoires by parallel mRNA/DNA sequencing shows major differential alterations in severe COVID-19

Virginie Pascal et al. iScience. .

Abstract

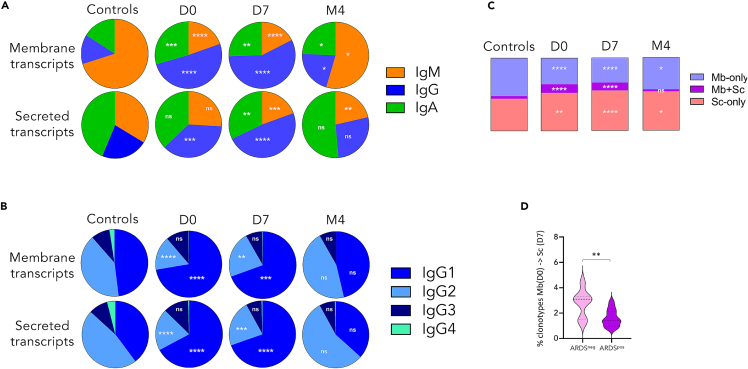
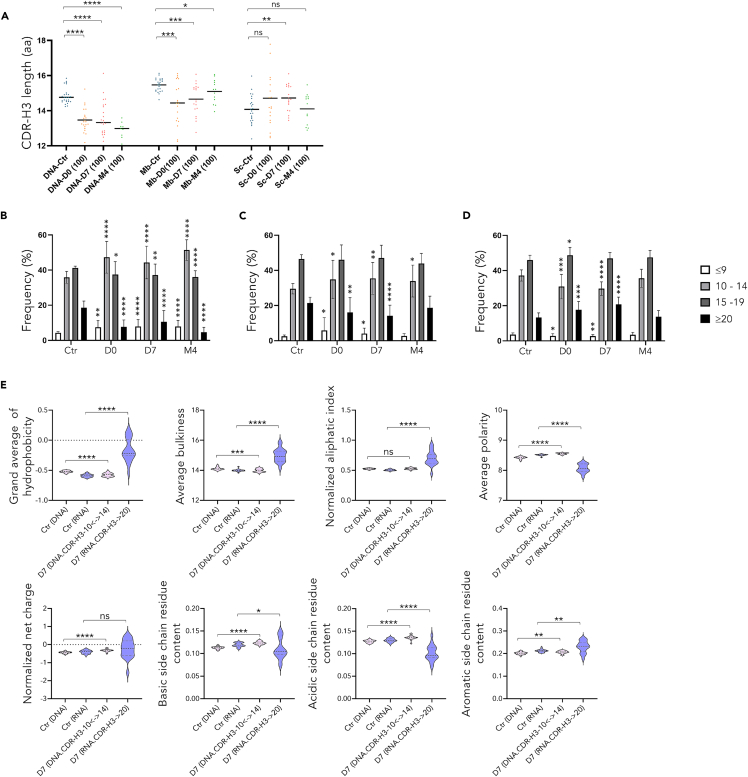
To understand the fine differential elements that can lead to or prevent acute respiratory distress syndrome (ARDS) in COVID-19 patients, it is crucial to investigate the immune response architecture. We herein dissected the multiple layers of B cell responses by flow cytometry and Ig repertoire analysis from acute phase to recovery. Flow cytometry with FlowSOM analysis showed major changes associated with COVID-19 inflammation such as an increase of double-negative B-cells and ongoing plasma cell differentiation. This paralleled COVID-19-driven expansion of two disconnected B-cell repertoires. Demultiplexing successive DNA and RNA Ig repertoire patterns characterized an early expansion of IgG1 clonotypes with atypically long and uncharged CDR3, the abundance of this inflammatory repertoire being correlated with ARDS and likely pejorative. A superimposed convergent response included convergent anti-SARS-CoV-2 clonotypes. It featured progressively increasing somatic hypermutation together with normal-length or short CDR3 and it persisted until a quiescent memory B-cell stage after recovery.

Keywords: Immunology; Respiratory medicine.


Conflict of interest statement

The authors declare no competing interest.

Figures

None
Graphical abstract
Figure 1
Figure 1
Flowsom analysis of the different B cell subsets (A) Minimum spanning tree of the 81 clusters and 12 metaclusters identified after FlowSOM analysis. (B) Color codes and correspondences of the 12 metaclusters with their B-cell subset counterpart (cardinal phenotypic features are indicated). (C) tSNE analysis of the 12 FlowSOM metaclusters. The color code is the same than in 1B. Each B-cell subset is pointed by an arrow. (D) Minimum spanning tree of the 81 clusters and the 12 metaclusters according to the COVID-19 course. Diameter of each cluster ball is proportional to the relative abundance of its cell content. (E) tSNE overlay of the 12 flow metaclusters for B-cells from controls versus patients at D7 and M4.
Figure 2
Figure 2
Oligoclonal response during SarsCov2 infection Total size distribution frequency of the Ig repertoire sequenced reads of one healthy volunteer and 3 representatives severe COVID-19 patients on DNA template (A). Gini diversity index of circulating Ig repertoires on DNA (B), membrane and secreted Ig transcripts on RNA templates (C). Relative abundance of the top 100 circulating clonotypes on DNA (D), membrane and secreted Ig transcripts on RNA templates (E).
Figure 3
Figure 3
Immunoglobulin repertoire clusters by heavy chain gene segment usage Heatmaps of variable heavy (IGHV) and joining (IGHJ) gene usage on DNA (A) and RNA templates (B) differentially expressed between samples collected at D0 and D7 from patients with or without ARDS versus healthy subjects. Each heatmap displays normalized IGHV-IGHJ gene expression across the groups. Groups (upper line) have the following color code: healthy subjects (red), patients without ARDS (yellow), patients with ARDS (red). Time points (second line) indicate sampling day for healthy subjects (red) and for patients, Day 0 (D0, green), Day 7 (D7, dark green), Day 14 (D14, light blue), Month 4 (M4, dark blue).
Figure 4
Figure 4
Changes of class/subclass usage, according to the membrane or secreted nature of Ig transcripts, during the SARS-CoV-2 infection (A and B) Ig class (A) and IgG subclass (B) distribution. (C) Average distribution of circulating clonotypes between membrane and secretory repertoires within each repertoire. (D) Frequency of transcripts from the D0 membrane repertoire have shifted to the secreted repertoire at D7 in the same patient, according to ARDS status.
Figure 5
Figure 5
IgG1 expansion associated with few mutations but significantly increased CDR3 length in the Ig repertoire Average length of CDR3 for each group from DNA repertoire (A) membrane and secreted transcripts (B) and according to class (E) or IgG subclass distribution (F) from RNA template. V region somatic hypermutation frequency for DNA repertoire (C) and according to membrane or secreted-type transcripts from each group (D) Ig class (G) or IgG subclass (H).
Figure 6
Figure 6
Characteristic of CoV-AbDab and convergent SARS-CoV-2 clonotypes, present in the circulating Ig repertoires of severe COVID-19 patients Relative abundance of CoV-AbDab specific SARS-CoV-2 clonotypes (SC) and convergent clonotypes (CC, shared by several patients of this study) in circulating Ig repertoires (A). Class and IgG subclass distribution (B) V region somatic hypermutation frequency (C) and average length of CDR3 (D) of SC and CC clonotypes, on RNA template.
Figure 7
Figure 7
Most expressed clonotypes of the DNA (A and B) and RNA (A, C, D) repertoires capture 2 aspects of humoral responses with distinct CDR-H3 features. Average CDR-H3length for the 100 most represented clonotypes (100) at D0, D7 and M4, on DNA and RNA repertoires according to membrane or secreted transcripts (A). Average length distribution of CDR-H3 (with ≤9, 10 to 14, 15 to 19, and ≥20 amino acids) of the D7 and M4-100 main clonotypes in DNA repertoires (B) membrane (C) and secreted transcripts (D). Physico-chemical properties of the D7-100 most represented DNA 10 to 14 aa-CDR-H3 and RNA ≥20 aa CDR-H3 clonotypes compared with those of the control DNA and RNA repertoires, respectively (E).

References

    1. Guan W.-J., Ni Z.-Y., Hu Y., Liang W.-H., Ou C.-Q., He J.-X., Liu L., Shan H., Lei C.-L., Hui D.S.C., et al. Clinical characteristics of coronavirus disease 2019 in China. N. Engl. J. Med. 2020;382:1708–1720. doi: 10.1056/NEJMoa2002032. - DOI - PMC - PubMed
    1. Huang C., Wang Y., Li X., Ren L., Zhao J., Hu Y., Zhang L., Fan G., Xu J., Gu X., et al. Clinical features of patients infected with 2019 novel coronavirus in Wuhan, China. Lancet. 2020;395:497–506. doi: 10.1016/S0140-6736(20)30183-5. - DOI - PMC - PubMed
    1. Helms J., Tacquard C., Severac F., Leonard-Lorant I., Ohana M., Delabranche X., Merdji H., Clere-Jehl R., Schenck M., Fagot Gandet F., et al. High risk of thrombosis in patients with severe SARS-CoV-2 infection: a multicenter prospective cohort study. Intensive Care Med. 2020;46:1089–1098. doi: 10.1007/s00134-020-06062-x. - DOI - PMC - PubMed
    1. Collie S., Champion J., Moultrie H., Bekker L.-G., Gray G. Effectiveness of BNT162b2 vaccine against omicron variant in South Africa. N. Engl. J. Med. 2022;386:494–496. doi: 10.1056/NEJMc2119270. - DOI - PMC - PubMed
    1. Liu J., Chandrashekar A., Sellers D., Barrett J., Jacob-Dolan C., Lifton M., McMahan K., Sciacca M., VanWyk H., Wu C., et al. Vaccines elicit highly conserved cellular immunity to SARS-CoV-2 omicron. Nature. 2022;603:493–496. doi: 10.1038/s41586-022-04465-y. - DOI - PMC - PubMed