

Using weather factors and google data to predict COVID-19 transmission in Melbourne, Australia: A time-series predictive model
- PMID: 36845036
- PMCID: PMC9941072
- DOI: 10.1016/j.heliyon.2023.e13782
Using weather factors and google data to predict COVID-19 transmission in Melbourne, Australia: A time-series predictive model
Abstract
Background: Forecast models have been essential in understanding COVID-19 transmission and guiding public health responses throughout the pandemic. This study aims to assess the effect of weather variability and Google data on COVID-19 transmission and develop multivariable time series AutoRegressive Integrated Moving Average (ARIMA) models for improving traditional predictive modelling for informing public health policy.
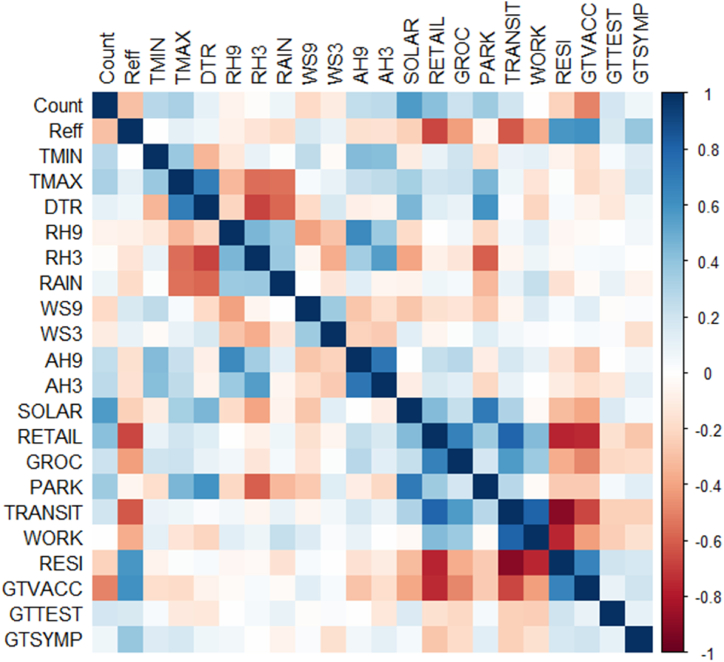
Methods: COVID-19 case notifications, meteorological factors and Google data were collected over the B.1.617.2 (Delta) outbreak in Melbourne, Australia from August to November 2021. Timeseries cross-correlation (TSCC) was used to evaluate the temporal correlation between weather factors, Google search trends, Google Mobility data and COVID-19 transmission. Multivariable time series ARIMA models were fitted to forecast COVID-19 incidence and Effective Reproductive Number (R eff ) in the Greater Melbourne region. Five models were fitted to compare and validate predictive models using moving three-day ahead forecasts to test the predictive accuracy for both COVID-19 incidence and R eff over the Melbourne Delta outbreak.
Results: Case-only ARIMA model resulted in an R squared (R2) value of 0.942, Root Mean Square Error (RMSE) of 141.59, and Mean Absolute Percentage Error (MAPE) of 23.19. The model including transit station mobility (TSM) and maximum temperature (Tmax) had greater predictive accuracy with R2 0.948, RMSE 137.57, and MAPE 21.26.
Conclusion: Multivariable ARIMA modelling for COVID-19 cases and R eff was useful for predicting epidemic growth, with higher predictive accuracy for models including TSM and Tmax. These results suggest that TSM and Tmax would be useful for further exploration for developing weather-informed early warning models for future COVID-19 outbreaks with potential application for the inclusion of weather and Google data with disease surveillance in developing effective early warning systems for informing public health policy and epidemic response.
Keywords: ARIMA; COVID-19; Forecasting; Internet search queries; Mobility; Weather.
© 2023 Published by Elsevier Ltd.
Conflict of interest statement
The authors declare that they have no known competing financial interests or personal relationships that could have appeared to influence the work reported in this paper.
Figures


References
-
- World Health Organization . 2022. WHO Coronavirus (COVID-19) Dashboard.https://covid19.who.int/
-
- World Health Organization . 2022. Tracking SARS-CoV-2 Variants.https://www.who.int/en/activities/tracking-SARS-CoV-2-variants/ - PubMed
-
- Department of Health - Australian Government . 2022. Coronavirus (COVID-19) Case Numbers and Statistics.https://www.health.gov.au/news/health-alerts/novel-coronavirus-2019-ncov...
LinkOut - more resources
Full Text Sources
