. 2023 Mar;9(3):e13853.
doi: 10.1016/j.heliyon.2023.e13853. Epub 2023 Feb 18.

Integrative network pharmacology and in silico analyses identify the anti-omicron SARS-CoV-2 potential of eugenol

Affiliations

Integrative network pharmacology and in silico analyses identify the anti-omicron SARS-CoV-2 potential of eugenol

Yang Liu. Heliyon. 2023 Mar.

Abstract

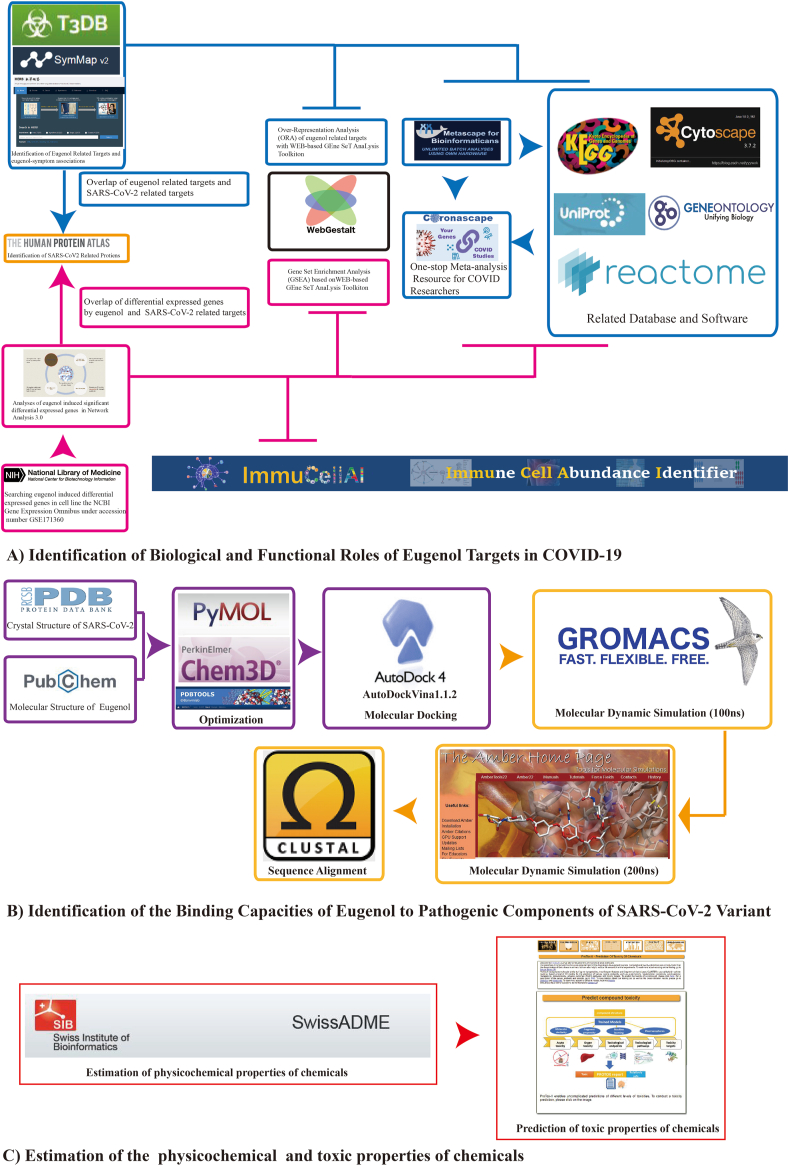
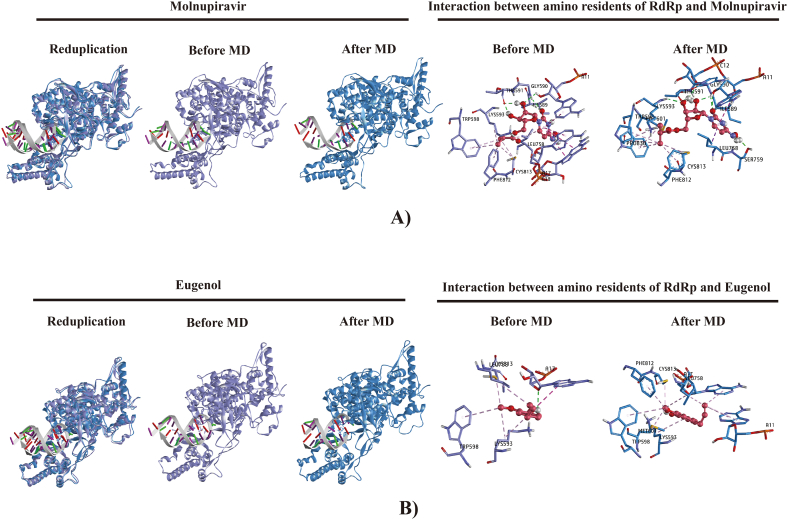
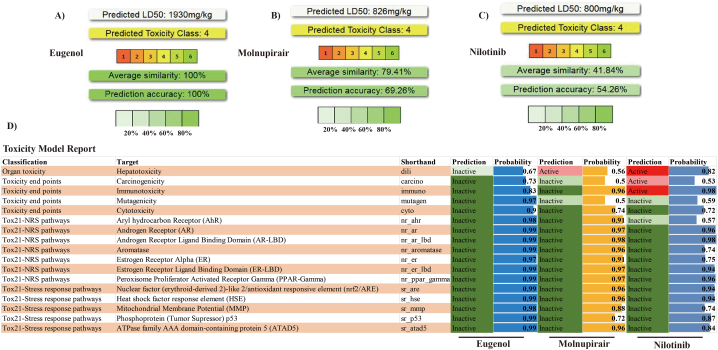
Eugenol as a natural product is the source of isoniazid, and purified eugenol is extensively used in the cosmetics industry and the productive processes of edible spices. Accumulating evidence suggested that eugenol exerted potent anti-microorganism and anti-inflammation effects. Application of eugenol effectively reduced the risk of atherosclerosis, arterial embolism, and Type 2 diabetes. A previous study confirmed that treatment with eugenol attenuated lung inflammation and improved heart functions in SARS-CoV-2 spike S1-intoxicated mice. In addition to the study, based on a series of public datasets, computational analyses were conducted to characterize the acting targets of eugenol and the functional roles of these targets in COVID-19. The binding capacities of eugenol to conservative sites of SARS-CoV-2 like RNA-dependent RNA polymerase (RdRp) and mutable site as spike (S) protein, were calculated by using molecular docking following the molecular dynamics simulation with RMSD, RMSF, and MM-GBSA methods. The results of network pharmacology indicated that six targets, including PLAT, HMOX1, NUP88, CTSL, ITGB1 andTMPRSS2 were eugenol-SARS-CoV-2 interacting proteins. The omics results of in-silico study further implicated that eugenol increased the expression of SCARB1, HMOX1 and GDF15, especially HMOX1, which were confirmed the potential interacting targets between eugenol and SARS-CoV-2 antigens. Enrichment analyses indicated that eugenol exerted extensive biological effects such as regulating immune infiltration of macrophage, lipid localization, monooxyenase activity, iron ion binding and PPAR signaling. The results of the integrated analysis of eugenol targets and immunotranscription profile of COVID-19 cases shows that eugenol also plays an important role in strengthen of immunologic functions and regulating cytokine signaling. As a complement to the integrated analysis, the results of molecular docking indicated the potential binding interactions between eugenol and four proteins relating to cytokine production/release and the function of T type lymphocytes, including human TLR-4, TCR, NF-κB, JNK and AP-1. Furthermore, results of molecular docking and molecular dynamics (100ns) simulations implicated that stimulated modification of eugenol to the SARS-CoV-2 Omicron Spike-ACE2 complex, especially for human ACE2, and the molecular interaction of eugenol to SARS-CoV-2 RdRp, were no less favorable than two positive controls, molnupiravir and nilotinib. Dynamics (200ns) simulations indicated that the binding capacities and stabilities of eugenol to finger subdomain of RdRp is no less than molnupiravir. However, the simulated binding capacity of eugenol to SARS-CoV-2 wild type RBD and Omicron mutant RBD were less than nilotinib. Eugenol was predicted to have more favor LD50 value and lower cytotoxicity than two positive controls, and eugenol can pass through the blood-brain barrier (BBB). In a brief, eugenol is helpful for attenuating systemic inflammation induced by SARS-CoV-2 infection, due to the direct interaction of eugenol to SARS-CoV-2 proteins and extensive bio-manipulation of pro-inflammatory factors. This study carefully suggests eugenol is a candidate compound of developing drugs and supplement agents against SARS-CoV-2 and its Omicron variants.

Keywords: COVID-19; Eugenol; Omicron; RNA-Dependent RNA polymerase; SARS-CoV-2; Spike protein.


Conflict of interest statement

The authors declare that they have no known competing financial interests or personal relationships that could have appeared to influence the work reported in this paper.

Figures

Fig. 1
Fig. 1
Flowchart indicates the antiviral action and mechanisms of eugenol against COVID-19 using computational analysis approach.
Fig. 2
Fig. 2
Functional characterization of eugenol targets collected form T3DB database, HEARB and SymMap, 292 out of 295 targets involved in the enrichment. (A) T3DB targets. (B) Gene ontology analysis. (C) Kyoto Encyclopedia of Genes and Genomes (KEGG) pathway analysis. The results of gene over representation analysis (ORA) were depicted by bar charts, and enriched items were ranked by enrichment ratio, and the adjusted P value was lower than 0.05.
Fig. 3
Fig. 3
Correlation of eugenol and clinical symptoms with six classification. (A) Headache. (B) Other pain. (C) Sensory and neurological symptoms. (D) Upper respiratory tract symptoms. (E) Gastrointestinal symptoms. (F) Other symptoms. Bar charts with dark blue denote P value < 0.05, and bar charts with light blue denote a P value > 0.05.
Fig. 4
Fig. 4
Intersecting genes of eugenol targets and SARS-CoV-2 antigens. (A) Venn diagram depicts intersecting genes of eugenol and SARS-CoV-2 antigens. (B) Cytoscape depicts the network of SARS-CoV-2 antigens, SARS-CoV-2 interacting genes and eugenol targets. A total of six intersecting genes, including PLAT, HMOX1, NUP88, CTSL, ITGB1 and TMPRSS2 were obtained.
Fig. 5
Fig. 5
Integrative analyses of the functional roles of 295 eugenol targets in transcriptomics of immune cells in COVID-19 cases. (A) Statistic input gene lists. (B) Heatmap of enriched terms across input gene lists, colored by P-values. (C) The top-level Gene Ontology biological processes. (D) Summary of enrichment analysis in DisGeNET. (E) Summary of enrichment analysis in PaGenBase. (F) Summary of Protein-Protein Interaction (PPI) enrichment analysis. Enriched terms were ranked with “Count” and “-log 10 (P-value)”.
Fig. 6
Fig. 6
External validation through analyzing GSE171360. Eugenol at the doses of 156.25 μM, 312.5 μM and 625 μM were selected for the screening and analyzing. Raw data were normalized with Log 2-counts per million, and parameters were set as Log 2 FC > 1 and adjusted P value < 0.05. (A) Volcano-plots represent differential gene expression induced by eugenol. (B) Immune cell infiltration analyses of transcriptional genes by eugenol. (C) Venn diagrams depict intersecting genes in eugenol/COVID-19. A P value < 0.05 indicates the statistical significance.
Fig. 7
Fig. 7
Intersecting genes of differentially expressed genes by eugenol and COVID-19. Cytoscape depicts the network of SARS-CoV-2 antigens, SARS-CoV-2 interacting genes and eugenol induced differentially expressed genes. Yellow triangles demotes the SARS-CoV-2 antigens, Red triangles demote up-regulated genes by eugenol at corresponding doses, light blue triangles demote down-regulated genes by eugenol at corresponding doses, red ellipses denote the three interesting genes, including SCARB1, HMOX1 and GDF 15.
Fig. 8
Fig. 8
Integrative analyses of the functional roles of 26 differentially expressed genes by eugenol (312.5 μM) in transcriptomics of immune cells in COVID-19 cases. (A) Statistic input gene lists. (B) Heatmap of enriched terms across input gene lists, colored by P-values. (C) The top-level Gene Ontology biological processes. (D) Summary of enrichment analysis in DisGeNET. (E) Summary of enrichment analysis in PaGenBase. (F) Summary of Protein-Protein Interaction (PPI) enrichment analysis. Enriched terms were ranked with “Count” and “-log 10 (P-value)”.
Fig. 9
Fig. 9
Integrative analyses the functional roles of 72 differential expressed genes by eugenol (625 μM) in transcriptomics of immune cells in COVID cases. (A) Statistic input gene lists. (B) Heatmap of enriched terms across input gene lists, colored by P-values. (C) The top-level Gene Ontology biological processes. (D) Summary of enrichment analysis in DisGeNET. (E) Summary of enrichment analysis in PaGenBase. (F) Summary of Protein-Protein Interaction (PPI) enrichment analysis. Enriched terms were ranked with “Count” and “-log 10 (P-value)”.
Fig. 10
Fig. 10
Functional roles of eugenol induced deferentially expressed genes calculated with GSEA. The significant enrichments obtained from eugenol at a dose of 625 μM. (A) Summary of GSEA results. (B) Biological process. (C) Molecular function. (D) KEGG pathway. (F) Disease. (G) Pharmacological action.
Fig. 11
Fig. 11
Molecular docking analysis indicates high-affinity association between eugenol and TLR-4/NF-κB/JNK(MAPK)/AP-1 axis and T cell receptor. (A) Structural interaction of eugenol with TLR-4 (PDB ID: 2z63). (B) Structural interaction of eugenol with NF-κB (PDB ID:1le5). (C) Structural interaction of eugenol with JNK/MAPK (PDB ID: 30xi). (D) Structural interaction of eugenol with AP-1(PDB ID: 4hmy). (E) Structural interaction of eugenol with TCR(PDB ID: 4g8e).
Fig. 12
Fig. 12
Molecular docking analysis indicates high-affinity association between eugenol and the pathogenic components of SARS-CoV-2. (A) Structural interaction of eugenol with earlier SARS-CoV-2 spike protein in complex with human ACE2 (PDB ID: 6M0J). (B) Structural interaction of eugenol with SARS-CoV-2 Omicron spike protein in complex with human ACE2 (PDB ID: 7T9L). (C) Structural interaction of eugenol with SARS-CoV-2 replicating SARS-CoV-2 polymerase (PDB ID: 6YYT), the blue dotted line demotes the hydrogen bond, pink dotted line indicates the π-π interaction of molecules, and yellow dotted line demotes the hydrophobic interaction.
Fig. 13
Fig. 13
Molecular dynamics simulation (100ns). (A) Trajectory RMSD analysis with 100ns using Gromacs2021.3 RSMF analysis for stable trajectory. (B) Comparison between SARS-CoV-2 RdRp-molnupiravir complex and SARS-CoV-2 RdRp-eugenol complex. (C) Comparison between SARS-CoV-2 omicron spike-ACE2 complex-nilotinib and SARS-CoV-2 omicron spike-ACE2 complex-eugenol.
Fig. 14
Fig. 14
Conformational change of SARS-CoV-2 RdRp-eugenol complex before MD and after MD. (A) SARS-CoV-2 RdRp-molnupiravir complex (Control). (B) SARS-CoV-2 RdRp-eugenol complex.
Fig. 15
Fig. 15
Conformational change of SARS-CoV-2 Omicron Spike-ACE2 complex before MD and after MD. (A) SARS-CoV-2 Spike-ACE2 complex-nilotinib (Control). (B) SARS-CoV-2 Spike-ACE2 complex-eugenol.
Fig. 16
Fig. 16
Free energy calculations and residue decomposition employing the MM-GBSA method. The energy set, including VDWAALS, EEL, EGB, ESURF, GGAS and GSOLV, were estimated. (A) Comparison between SARS-CoV-2 RNA dependent RNA polymerase-molnupiravir complex and SARS-CoV-2 RNA dependent RNA polymerase-eugenol complex. (B) Comparison between SARS-CoV-2 Omicron spike-ACE2 complex-nilotinib and SARS-CoV-2 Omicron spike-ACE2 complex-eugenol. Units of energy are defined as kacl/mol. SER-592 and LYS-593 poses more contributions of binding free energy in SARS-CoV-2 RNA dependent RNA polymerase-eugenol interactions, whereas, Pro389 poses more contributions of binding free energy in SARS-CoV-2 Omicron spike-ACE2 complex -eugenol interactions.
Fig. 17
Fig. 17
Molecular docking analysis indicates moderate-affinity association between eugenol and SARS-CoV-2 Spike_RBD and finger subdomain of SARS-CoV-2 RdRp.(A) Structural interaction of eugenol with SARS-CoV-2 wild type Spike RBD (6M0J), removing human ACE2.(B) Structural interaction of eugenol with SARS-CoV-2 Omicron mutant Spike RBD (7T9L), removing human ACE2.(C) Structural interaction of eugenol with finger subdomain of SARS-CoV-2 RdRp (6M71).
Fig. 18
Fig. 18
Trajectory RMSD and RMSF analysis indicated eugenol exerted similar biological activity as two positive controls, and eugenol-SARS-CoV-2 RdRp presented better stability as molnupiravir. The stability of eugenol-SARS-CoV-2 wt/Omicron mutant Spike RBD complex was less stability than nilotinib. (A) RMSD of eugenol/nilotinib- SARS-CoV-2 wt Spike RBD complex (200ns). (B) RMSD of eugenol/nilotinib-SARS-CoV-2 Omicron mutant Spike RBD complex (200ns). (C) RMSD of eugenol/molnupiravir- SARS-CoV-2 RdRp complex (200ns). (D) RMSF of eugenol/nilotinib- SARS-CoV-2 wt Spike RBD complex. (E)RMSF of eugenol/nilotinib-SARS-CoV-2 Omicron mutant Spike RBD complex. (F) RMSF of eugenol/molnupiravir- SARS-CoV-2 RdRp complex.
Fig. 19
Fig. 19
Superimposition comparison of SARS-CoV-2 Spike RBD alone before MD and after MD. (A) SARS-CoV-2 Spike wild type RBD-nilotinib (Control). (B) SARS-CoV-2 Omicron mutant Spike RBD-nilotinib (Control). (C) Finger subdomain of SARS-CoV-2 RdRp-molnupiravir (Control). (D) SARS-CoV-2 Spike wild type RBD-Eugenol. (F) SARS-CoV-2 Omicron mutant Spike RBD-Eugenol. (F) Finger subdomain of SARS-CoV-2 RdRp-Eugenol.
Fig. 20
Fig. 20
Sequence alignment Spike RBD of SARS-CoV-2 wild type and Omicron. The identity between the SARS-CoV-2_WT and Omicron was 92.27%. Red color and one dot denote the low similarity.
Fig. 21
Fig. 21
Pharmacokinetic properties, aberration and toxic properties of chemicals. (A) LD50 value of eugenol. (B) LD50 value of molnupiravir. (C) LD50 value of nilotinib. (D) Aberration and toxic properties of chemicals.
Fig. 22
Fig. 22
A summary of anti-inflammatory properties and therapeutic potential of eugenol depending on the previous evidences.
Fig. 23
Fig. 23
A summary of antimicrobial activity depending on the previous evidences.
Fig. 24
Fig. 24
Schematic representation of bioactivities of eugenol against SARS-CoV-2 based on current results.

Similar articles

Cited by

References

    1. Barda N., Dagan N., Cohen C., Hernán M.A., Lipsitch M., Kohane I.S., Reis B.Y., Balicer R.D. Effectiveness of a third dose of the BNT162b2 mRNA COVID-19 vaccine for preventing severe outcomes in Israel: an observational study. Lancet. 2021;398(10316):2093–2100. doi: 10.1016/S0140-6736(21)02249-2. - DOI - PMC - PubMed
    1. Menni C., Valdes A.M., Polidori L., Antonelli M., Penamakuri S., Nogal A., Louca P., May A., Figueiredo J.C., Hu C., Molteni E., Canas L., Österdahl M.F., Modat M., Sudre C.H., Fox B., Hammers A., Wolf J., Capdevila J., Chan A.T., David S.P., Steves C.J., Ourselin S., Spector T.D. Symptom prevalence, duration, and risk of hospital admission in individuals infected with SARS-CoV-2 during periods of omicron and delta variant dominance: a prospective observational study from the ZOE COVID Study. Lancet. 2022;399(10335):1618–1624. doi: 10.1016/S0140-6736(22)00327-0. - DOI - PMC - PubMed
    1. Antonelli M., Pujol J.C., Spector T.D., Ourselin S., Steves C.J. Risk of long COVID associated with delta versus omicron variants of SARS-CoV-2. Lancet. 2022;399(10343):2263–2264. doi: 10.1016/S0140-6736(22)00941-2. - DOI - PMC - PubMed
    1. Antonelli M., Penfold R.S., Merino J., Sudre C.H., Molteni E., Berry S., Canas L.S., Graham M.S., Klaser K., Modat M., Murray B., Kerfoot E., Chen L., Deng J., Österdahl M.F., Cheetham N.J., Drew D.A., Nguyen L.H., Pujol J.C., Hu C., Selvachandran S., Polidori L., May A., Wolf J., Chan A.T., Hammers A., Duncan E.L., Spector T.D., Ourselin S., Steves C.J. Risk factors and disease profile of post-vaccination SARS-CoV-2 infection in UK users of the COVID Symptom Study app: a prospective, community-based, nested, case-control study. Lancet Infect. Dis. 2022;22(1):43–55. doi: 10.1016/S1473-3099(21)00460-6. - DOI - PMC - PubMed
    1. Kannan S., Shaik Syed Ali P., Sheeza A. Omicron (B.1.1.529) - variant of concern - molecular profile and epidemiology: a mini review. Eur. Rev. Med. Pharmacol. Sci. 2021;25(24):8019–8022. doi: 10.26355/eurrev_202112_27653. - DOI - PubMed