. 2023 Feb 22;4(2):e219.
doi: 10.1002/mco2.219. eCollection 2023 Apr.

Osthole regulates N6-methyladenosine-modified TGM2 to inhibit the progression of rheumatoid arthritis and associated interstitial lung disease

Affiliations

Osthole regulates N6-methyladenosine-modified TGM2 to inhibit the progression of rheumatoid arthritis and associated interstitial lung disease

Xian Lin et al. MedComm (2020). .

Abstract

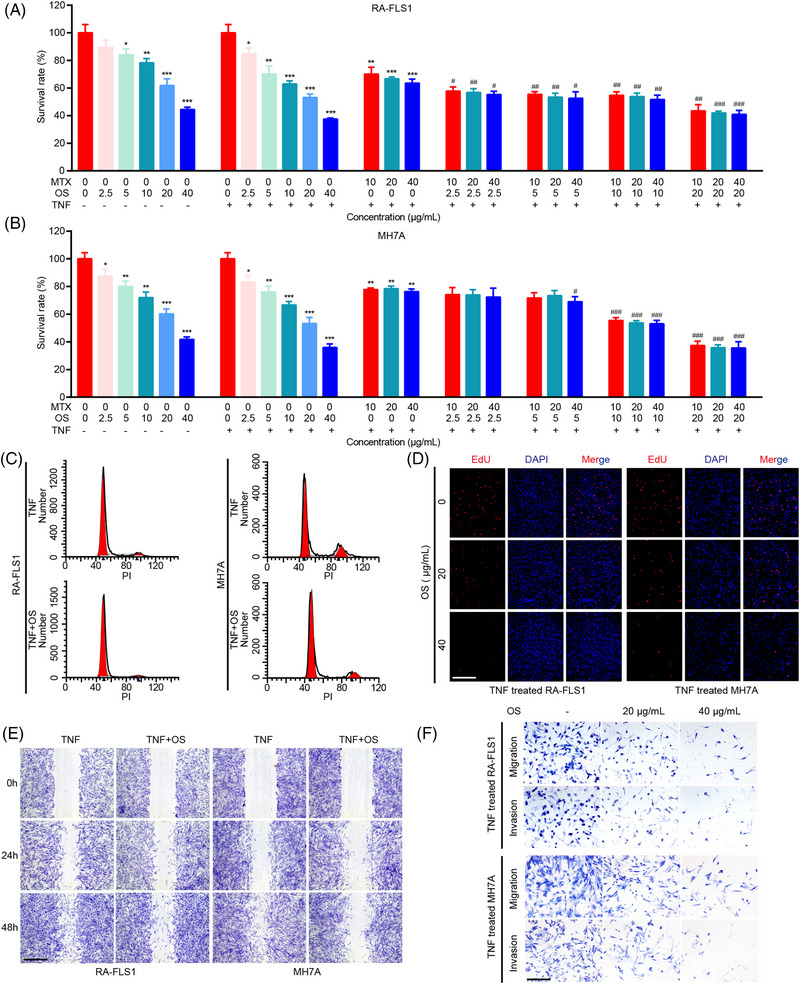
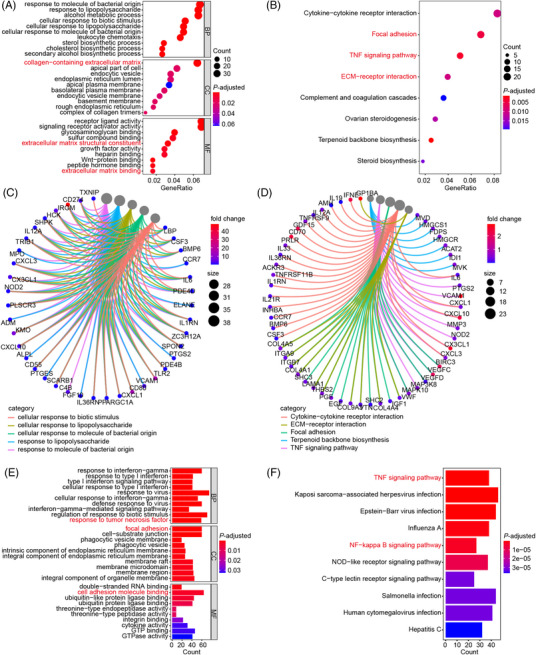
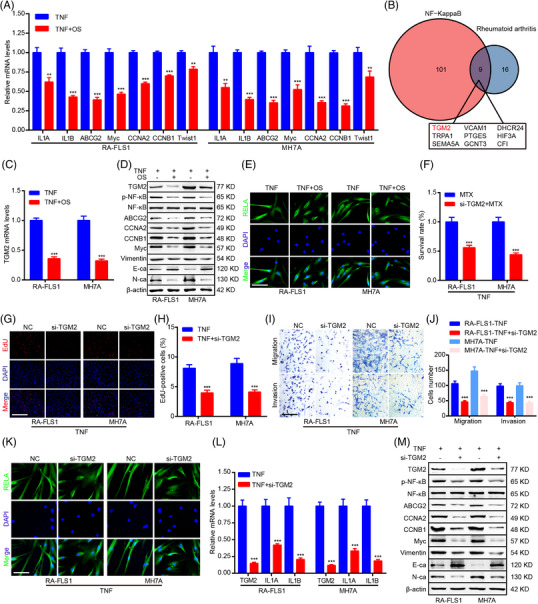
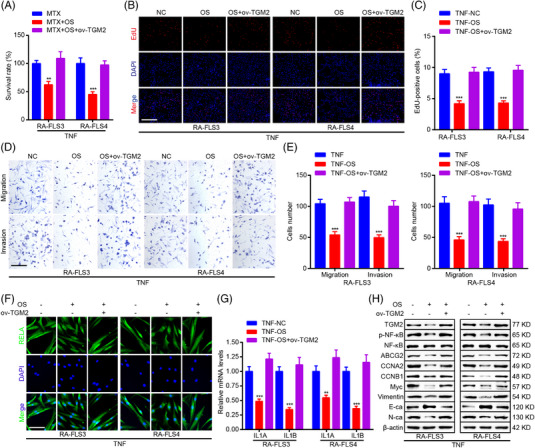
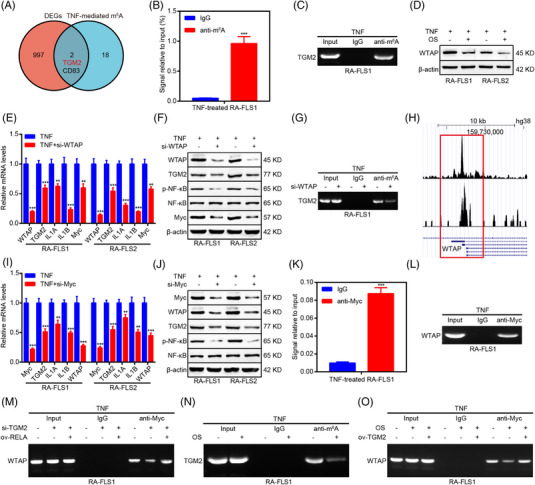
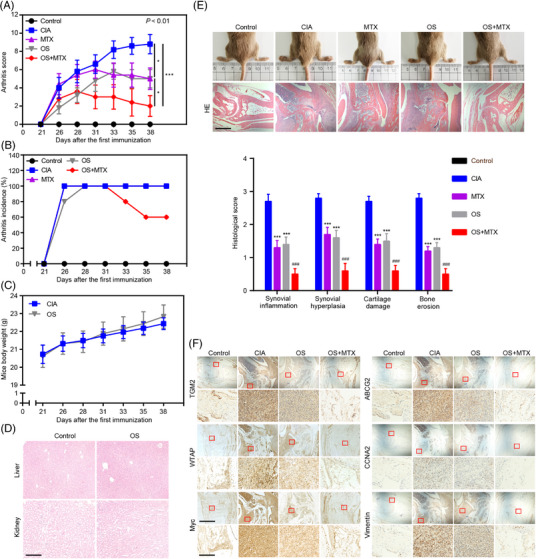
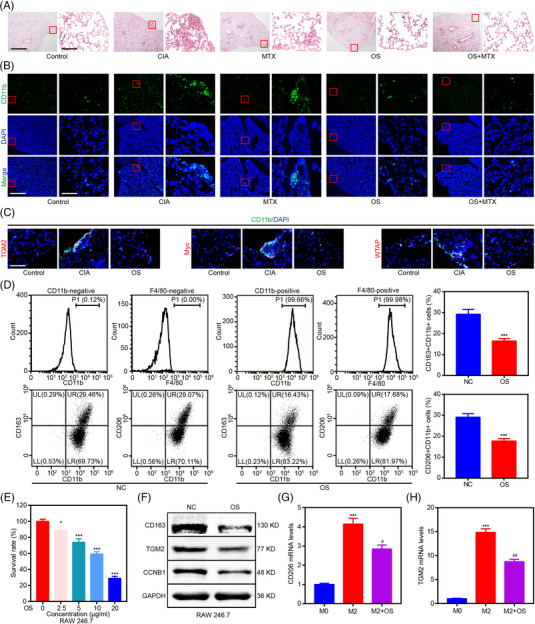
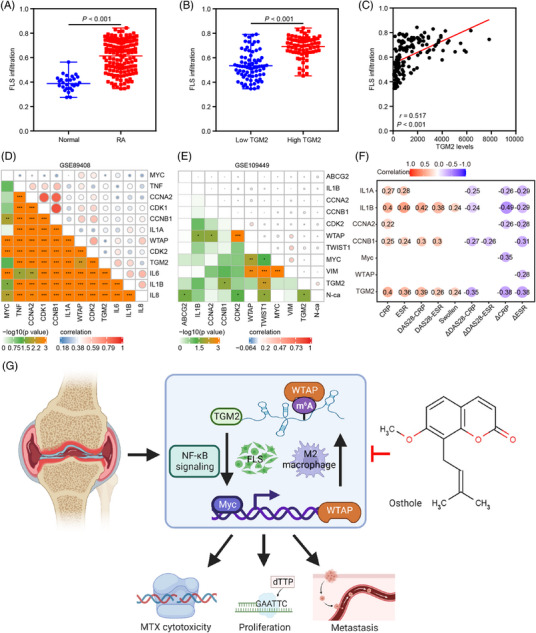
Rheumatoid arthritis (RA) is an inflammatory autoimmune disease, and RA interstitial lung disease (ILD) is a severe complication of RA. This investigation aims to determine the effect and underlying mechanism of osthole (OS), which could be extracted from Cnidium, Angelica, and Citrus plants and evaluate the role of transglutaminase 2 (TGM2) in RA and RA-ILD. In this work, OS downregulated TGM2 to exert its additive effect with methotrexate and suppress the proliferation, migration, and invasion of RA-fibroblast-like synoviocytes (FLS) by attenuating NF-κB signaling, resulting in the suppression of RA progression. Interestingly, WTAP-mediated N6-methyladenosine modification of TGM2 and Myc-mediated WTAP transcription cooperatively contributed to the formation of a TGM2/Myc/WTAP-positive feedback loop through upregulating NF-κB signaling. Moreover, OS could downregulate the activation of the TGM2/Myc/WTAP-positive feedback circuit. Furthermore, OS restrained the proliferation and polarization of M2 macrophages to inhibit the aggregation of lung interstitial CD11b+ macrophages, and the effectiveness and non-toxicity of OS in suppressing RA and RA-ILD progression were verified in vivo. Finally, bioinformatics analyses validated the importance and the clinical significance of the OS-regulated molecular network. Taken together, our work emphasized OS as an effective drug candidate and TGM2 as a promising target for RA and RA-ILD treatment.

Keywords: TGM2; interstitial lung disease; osthole; rheumatoid arthritis.


Conflict of interest statement

The authors declare no competing interest.

Figures

FIGURE 1
FIGURE 1
Osthole (OS) presents an additive effect with methotrexate (MTX) and inhibits proliferation, migration and invasion of rheumatoid arthritis‐fibroblast‐like synoviocytes (RA‐FLS). (A, B) Cells were incubated with indicated dosages of OS ( 0, 2.5, 5, 10, 20, and 40 μg/mL), MTX (0, 10, 20, and 40 μg/mL), or TNF (20 ng/mL) for 48 h, and cell viability of RA‐FLS1 (A) and MH7A (B) was measured by CCK8 assays. (C) The cell cycle analyses were conducted by flow cytometry in OS (0 and 20 μg/mL for 48 h)‐treated RA‐FLS and the controls. (D) EdU assays were applied for detecting DNA replication in OS (0, 20, and 40 μg/mL for 48 h)‐treated RA‐FLS and the controls. Scale bar: 50 μm. (E) Wound healing assays were adopted to present the migration ability of OS (0 and 20 μg/mL for 48 h)‐treated RA‐FLS and the controls. Scale bar: 125 μm. (F) Transwell assays were adopted to present the migration and invasion ability of OS (0, 20, and 40 μg/mL for 48 h)‐treated RA‐FLS and the controls. Scale bar: 50 μm. * p < 0.05, ** p < 0.01, and *** P < 0.001 versus TNF‐treated group. # p < 0.05, ## p < 0.01, and ### p < 0.001 versus TNF and MTX‐treated group.
FIGURE 2
FIGURE 2
OS potentially regulates TNF/NF‐κB signaling based on RNA‐seq analyses. (A–D) Bubble‐plots and chords displaying the top enriched Gene Ontology (GO) (A, C) and Kyoto Encyclopedia of Genes and Genomes (KEGG) (B, D) terms according to our RNA‐seq data. RA‐FLS were cultured with 20 μg/mL of OS for 48 h. OS‐treated RA‐FLS and the controls were collected and used for RNA‐seq. (E, F) Bar‐plots showing the top enriched GO (E) and KEGG (F) terms according to RNA‐seq data of TNF‐induced RA‐FLS and the controls in GSE129486.
FIGURE 3
FIGURE 3
OS suppresses transglutaminase 2 (TGM2) expression to attenuate the pathological phenotype of RA‐FLS through modulating NF‐κB signaling. (A) qPCR detection of ILA, ILB, ABCG2, Myc, CCNA2, CCNB1, and Twist1 mRNA levels in RA‐FLS. (B) A Venn diagram analysis identifying genes associated with NF‐κB and RA signaling based on GSE109449 dataset. (C) qPCR detection of TGM2 mRNA levels in RA‐FLS. (D) Western blot measurement of TGM2, p‐NF‐κB, NF‐κB, ABCG2, CCNA2, CCNB1, Myc, Vimentin, N‐ca, E‐ca, and β‐actin protein levels in RA‐FLS. (E) Immunofluorescence staining exhibiting the impact of OS on RELA subcellular localization. Scale bar: 12.5 μm. (F) CCK8 assays were adopted to show the impact of TGM2 knockdown on the cell viability of MTX‐treated RA‐FLS. (G, H) EdU assays were applied to detect the effect of TGM2 knockdown on DNA replication of RA‐FLS. Scale bar: 50 μm. (I, J) Transwell assays were adopted to determine the impact of TGM2 knockdown on RA‐FLS migration and invasion ability. Scale bar: 50 μm. (K) Immunofluorescence staining was performed to exhibit the impact of TGM2 knockdown on RELA subcellular localization. Scale bar: 12.5 μm. (L) qPCR detection of TGM2, IL1A, and IL1B mRNA levels in RA‐FLS. (M) Western blot measurement of TGM2, p‐NF‐κB, NF‐κB, ABCG2, CCNA2, CCNB1, Myc, vimentin, N‐ca, E‐ca, and β‐actin protein levels in RA‐FLS. ** p < 0.01 and *** p < 0.001 versus TNF‐treated group.
FIGURE 4
FIGURE 4
TGM2 mediates the inhibitory role of OS in the pathological phenotype of RA‐FLS. (A) CCK8 assays were adopted to show the impact of OS and TGM2 overexpression on the cell viability of MTX‐treated RA‐FLS. (B, C) EdU assays were applied for measuring the impact of OS and TGM2 overexpression on DNA replication of RA‐FLS. Scale bar: 50 μm. (D, E) Transwell assays were adopted to reveal the impact of OS and TGM2 overexpression on RA‐FLS migration and invasion ability. Scale bar: 50 μm. (F) Immunofluorescence staining was performed to exhibit the impact of OS and TGM2 overexpression on RELA subcellular localization. Scale bar: 12.5 μm. (G) qPCR detection of IL1A and IL1B mRNA levels in RA‐FLS. (H) Western blot measurement of TGM2, p‐NF‐κB, NF‐κB, ABCG2, CCNA2, CCNB1, Myc, vimentin, N‐ca, E‐ca, and β‐actin protein levels in RA‐FLS. ** p < 0.01 and *** p < 0.001 versus TNF‐treated group
FIGURE 5
FIGURE 5
OS impairs the activity of a TGM2/Myc/WTAP‐positive feedback loop mediated by NF‐κB signaling. (A) A Venn diagram analysis revealing genes associated with TNF‐mediated N6‐methyladenosine (m6A) modification. (B, C) methylated RNA immunoprecipitation (MeRIP) assays combined with qPCR (B) and PCR (C) were conducted to detect m6A modification of TGM2 mRNA. (D) Western blot analyses were adopted to explore the impact of OS on WTAP protein levels in RA‐FLS. (E) qPCR assays were applied to reveal the impact of WTAP knockdown on TGM2, IL1A, IL1B, and Myc mRNA levels in RA‐FLS. (F) Western blot analyses were adopted to detect the impact of WTAP depletion on TGM2, p‐NF‐κB, NF‐κB, and Myc protein levels in RA‐FLS. (G) MeRIP assays combined with PCR displaying the effect of WTAP knockdown on m6A modification of TGM2 mRNA. (H) Bioinformatics analyses elucidating a Myc binding site within the promoter region of WTAP based on Cistrome Data Browser. (I) qPCR assays were applied to reveal the impact of Myc knockdown on TGM2, IL1A, IL1B, and WTAP mRNA levels in RA‐FLS. (J) Western blot analyses were adopted to detect the impact of Myc depletion on WTAP, TGM2, p‐NF‐κB, and NF‐κB protein levels in RA‐FLS. (K, L) Chromatin immunoprecipitation (ChIP) assays combined with qPCR (K) and PCR (L) were applied to measure Myc‐mediated WTAP transcription. (M) ChIP assays combined with PCR showing the impact of TGM2 and RELA on Myc‐mediated WTAP transcription. (N) MeRIP assays combined with PCR displaying the impact of OS on TGM2 mRNA m6A modification. (O) ChIP combined with PCR assays showing the impact of OS and TGM2 on Myc‐mediated WTAP transcription. ** p < 0.01 and *** p < 0.001 versus TNF‐treated group.
FIGURE 6
FIGURE 6
OS cooperates with MTX to inhibit RA progression in vivo. The collagen‐induced arthritis (CIA) mice model was constructed and randomly divided into control, CIA, MTX, OS, and OS combined with MTX treatment groups (n = 10 per group). (A, B) The impacts of OS and MTX on arthritis score (A) and incidence of arthritis (B) in CIA models. (C) The measurement of mice body weight in CIA and OS group. (D) Representative histopathological images of mice livers and kidneys in OS‐treated and the control groups. Scale bar: 50 μm. (E) Gross and H&E staining view of mice joints in CIA models exhibiting the impacts of OS and MTX on arthritis. Synovial inflammation, synovial hyperplasia, cartilage damage, and bone erosion were evaluated in the mice joints. Scale bar: 125 μm. (F) Representative images (upper scale bar: 125 μm and below scale bar: 12.5 μm) of immunohistochemistry staining exhibiting the impacts of OS and MTX on TGM2, WTAP, Myc, ABCG2, CCNA2, and vimentin expression in synovial tissue of joints. * p < 0.05, and *** p < 0.001 versus CIA group. ### p < 0.001 versus MTX‐treated group.
FIGURE 7
FIGURE 7
OS suppresses RA‐associated interstitial lung disease (ILD) by downregulating the aggregation of M2 macrophages. (A) Representative images (left scale bar: 125 μm and right scale bar: 12.5 μm) of H&E staining displaying the impact of OS and MTX on the generation of subpleural inflammation in CIA models. (B) Representative images (left scale bar: 125 μm and right scale bar: 12.5 μm) of immunofluorescence staining displaying the impact of OS and MTX on the aggregation of CD11b+ interstitial macrophage in the subpleural inflammation area of the CIA mouse model. (C) Representative images (scale bar: 12.5 μm) of immunofluorescence staining displaying the impact of OS on TGM2, Myc, and WTAP expression of CD11b+ interstitial macrophage in the subpleural inflammation area of the CIA mouse model. (D) Flow cytometry indicating the effect of OS on the percentage of CD163+CD11b+ and CD206+CD11b+ RAW 246.7 cells. (E) RAW 246.7 cells were exposed to OS (0, 2.5, 5, 10, and 20 μg/mL) for 48 h, and cell viability was measured by CCK8 assays. (F) Western blot analyses were applied for elucidating the impact of OS on CCNB1, CD163, and TGM2 protein levels in RAW 246.7 cells. (G, H) qPCR assays were applied to reveal the impact of OS on CD206 (G) and TGM2 (H) in IL4 and IL13‐induced M2 macrophage differentiated from THP‐1. * p < 0.05 and *** p < 0.001 versus control group. # p < 0.05 and ## p < 0.01 versus M2 group.
FIGURE 8
FIGURE 8
Bioinformatics analysis emphasizes the significance of the molecular regulatory network regulated by OS. (A) The differential distribution of FLS infiltration calculated by single sample gene set enrichment analysis (ssGSEA) between RA patients and normal controls based on GSE89408 dataset. (B) The differential distribution of FLS infiltration calculated by ssGSEA in RA patients with low and high TGM2 levels based on GSE89408 dataset. (C) The correlation analysis displaying the relationship between TGM2 levels and FLS infiltration calculated by ssGSEA in RA patients as per GSE89408 dataset. (D) The correlation analyses displaying the relationship among TGM2, Myc, WTAP, TNF, CCNA2, CCNB1, CDK1, CDK2, IL1A, IL1B, IL6, and IL8 levels as per GSE89408 dataset. (E) The correlation analyses displaying the relationship among TGM2, Myc, WTAP, ABCG2, CCNA2, CCNB1, CDK2, IL1B, Twist1, vimentin, and N‐ca levels as per GSE109449 dataset. (F) The correlation analyses presenting the relationship between the severity of RA disease (DAS28‐CRP, DAS28‐ESR, CRP, ESR, and joint swollen), therapy response (delta DAS28‐CRP, delta DAS28‐ESR, delta CRP, and delta ESR), and the levels of TGM2, Myc, WTAP, IL1A, IL1B, CCNA2, and CCNB1 based on PEAC RNA‐seq database. (G) Working model indicating the modulation of OS‐downregulated TGM2/Myc/WTAP‐positive feedback circuit in anti‐RA effect of MTX as well as proliferation and metastasis of RA‐FLS through modulating NF‐κB signaling. This graphical abstract was generated by applying the Biorender website (https://biorender.com/).

Similar articles

Cited by

References

    1. Qiu M, Jiang J, Nian X, et al. Factors associated with mortality in rheumatoid arthritis‐associated interstitial lung disease: a systematic review and meta‐analysis. Respir Res. 2021;22(1):264. - PMC - PubMed
    1. Juge PA, Lee JS, Lau J, Kawano‐Dourado L. Methotrexate and rheumatoid arthritis associated interstitial lung disease. Eur Respir J. 2021;57(2):2000337. - PMC - PubMed
    1. Daraghmeh DN, King C, Wiese MD. A review of liquid biopsy as a tool to assess epigenetic, cfDNA and miRNA variability as methotrexate response predictors in patients with rheumatoid arthritis. Pharmacol Res. 2021;173:105887. - PubMed
    1. Wang W, Zhou H, Liu L. Side effects of methotrexate therapy for rheumatoid arthritis: a systematic review. Eur J Med Chem. 2018;158:502‐516. - PubMed
    1. Lin X, Tao C, Zhang R, Zhang M, Wang Q, Chen J. N6‐methyladenosine modification of TGM2 mRNA contributes to the inhibitory activity of sarsasapogenin in rheumatoid arthritis fibroblast‐like synoviocytes. Phytomedicine. 2022;95:153871. - PubMed