. 2023 Jan;3(1):17-33.
doi: 10.1038/s43587-022-00323-8. Epub 2022 Dec 22.

Age-dependent Lamin changes induce cardiac dysfunction via dysregulation of cardiac transcriptional programs

Affiliations

Age-dependent Lamin changes induce cardiac dysfunction via dysregulation of cardiac transcriptional programs

Natalie J Kirkland et al. Nat Aging. 2023 Jan.

Abstract

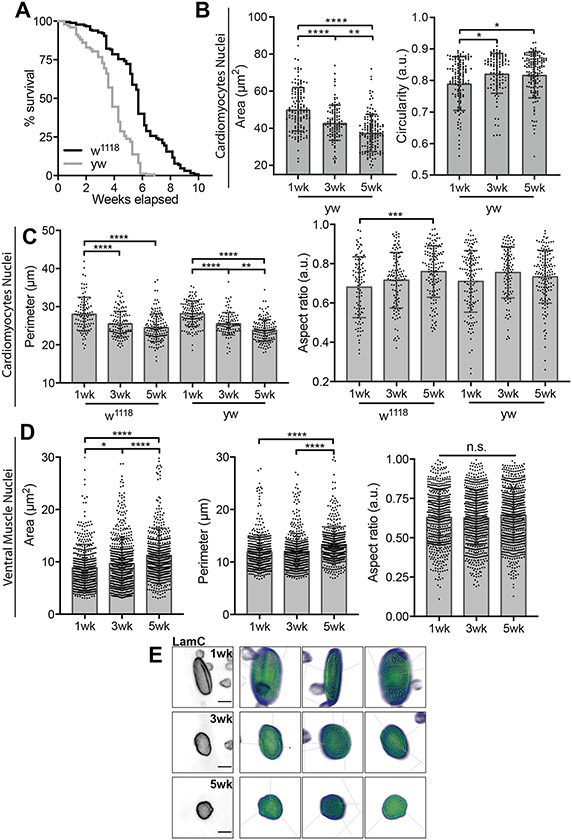
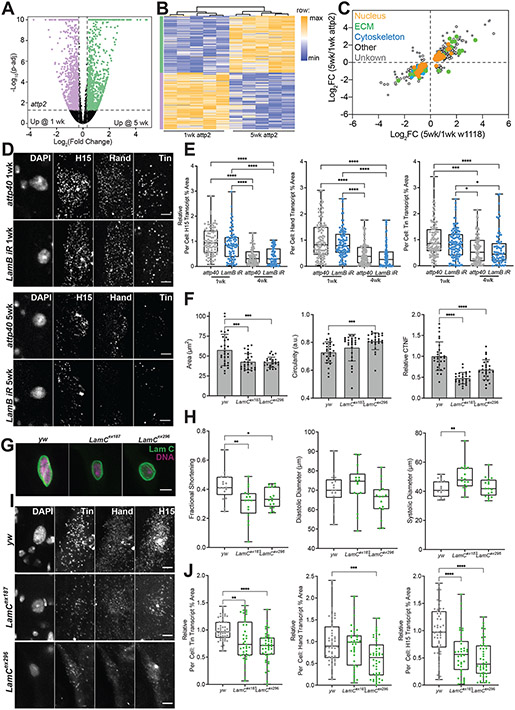
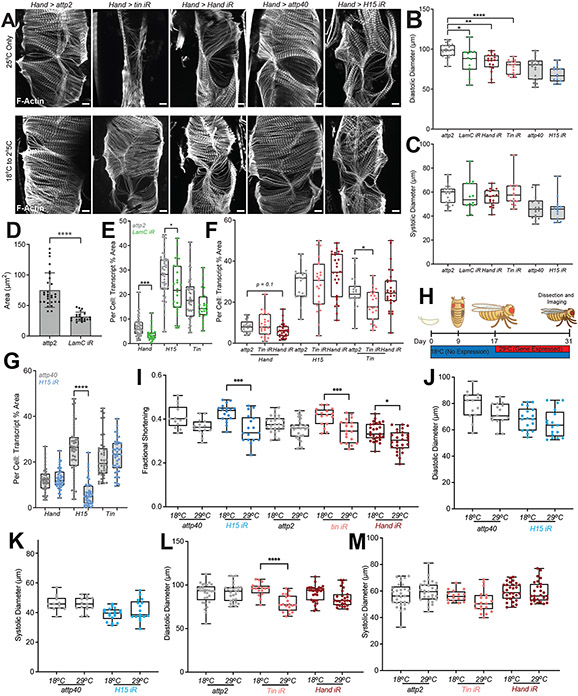
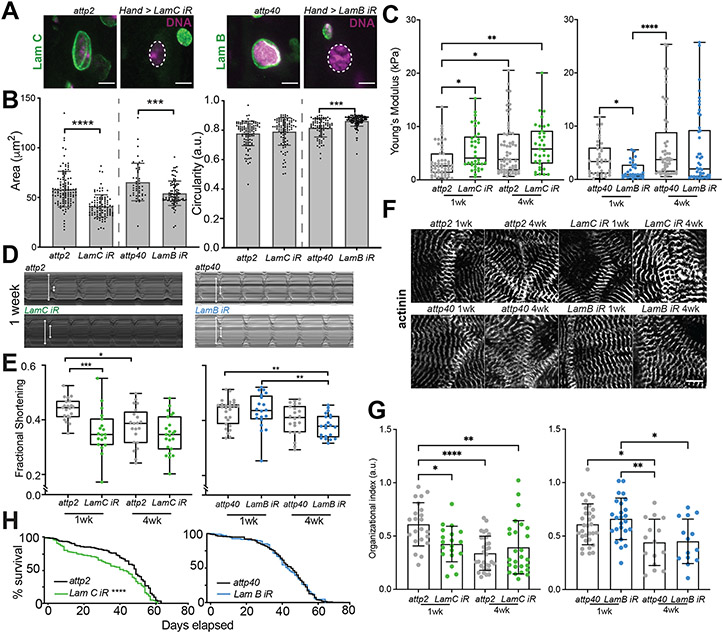
As we age, structural changes contribute to progressive decline in organ function, which in the heart act through poorly characterized mechanisms. Taking advantage of the short lifespan and conserved cardiac proteome of the fruit fly, we found that cardiomyocytes exhibit progressive loss of Lamin C (mammalian Lamin A/C homologue) with age, coincident with decreasing nuclear size and increasing nuclear stiffness. Premature genetic reduction of Lamin C phenocopies aging's effects on the nucleus, and subsequently decreases heart contractility and sarcomere organization. Surprisingly, Lamin C reduction downregulates myogenic transcription factors and cytoskeletal regulators, possibly via reduced chromatin accessibility. Subsequently, we find a role for cardiac transcription factors in regulating adult heart contractility and show that maintenance of Lamin C, and cardiac transcription factor expression, prevents age-dependent cardiac decline. Our findings are conserved in aged non-human primates and mice, demonstrating that age-dependent nuclear remodeling is a major mechanism contributing to cardiac dysfunction.


Figures

Extended Data Fig. 1
Extended Data Fig. 1. Nuclear Dynamics in Cardiac and Skeletal Muscle Cells
(A) Kaplan-Meier survival curve for yw (gray) and w1118 (black) flies. n = 103 and flies, respectively, were used in the plot. p<10−3 based on Log-Rank (Mantel-Cox) test between the two strains. (B) Plots of 2D projected area (left) and circularity data (right) for yw flies. n = 129, 108, and 143 for yw flies at 1-, 3-, and 5-weeks, respectively. (C) Cardiomyocyte nuclear area (left) and aspect ratio (right) plotted for w1118 and yw flies as a function of adult age. n = 96, 116, and 141 nuclei for for w1118 flies and n = 129, 108, and 143 for yw flies at 1-, 3-, and 5-weeks of adulthood, respectively. (D) Ventral muscle nuclear area (left), perimeter (center), and aspect ratio (right) from w1118 flies at 1-, 3-, and 5-weeks of adulthood. n = 528, 604, 661 ventral muscle nuclei from w1118 flies at 1-, 3-, and 5-weeks of adulthood. (E) Representative images of the 3D wireframe mesh of cardiomyocyte nuclei from w1118 flies at 1- (top), 3- (middle), and 5-weeks (bottom) of adulthood. Scale bar is 5 μm. *p<0.05, **p<10−2, ***p<10−3, and ****p<104 by one-way ANOVA with Tukey multiple comparisons test. Error bars in all graphs refer to mean +/− SD.
Extended Data Fig. 2
Extended Data Fig. 2. Natural Aging Downregulates LamC and LamB but does not affect their localization.
(A) MA plot of all genes from 1- and 5-week adult w1118 fly hearts showing log2 fold change (FC) and mean normalized expression counts. Data is shown in black for genes −1.25 < FC < 1.25 (dashed lines) or p-adj > 0.05. Open circles represent genes that do not map to a nuclear ontological term. Green and purple data represent DEGs that are up- or down-regulated in 5-week adult flies, respectively. (B) Cellular component and molecular function ontological terms for genes associated with the nuclear envelope GO term, organized by their elimination pruning p-value. (C) Representative images of 1 and 5 week w1118 fly heart nuclei stained for DNA, and LamC (green) and LamB (purple) mRNA transcripts. Scale bar, 5 μm. (D) Left plot shows area percentage occupied by mRNA transcripts per cardiomyocyte in 1- and 5-week-old adult w1118 fly hearts. Right plot normalizes data to mean area at 1 week for each transcript. n = 49, 36, 49, and 36 nuclei from w1118 flies at 1 and 5 weeks for LamC and LamB, respectively. (E) Corrected total nuclear fluorescence (CTNF) of 1, 3, and 5 week yw flies for LamC (top) and LamB (bottom). n = 94, 106, and 133 nuclei for LamC and n = 173, 115, and 90 nuclei for LamB for 1, 3, and 5 week adults, respectively. (F) Image showing a representative nucleus with multiple lines radiating out from its centroid (left) to create line plots that are averaged into a single radial profile of the fluorescent intensity (right). Lower panel, the ratio of edge to center intensity is plotted. n = 72, 63, 73, and 33 nuclei from w1118 flies at 1 and 5 weeks for LamC and LamB, respectively. n = 51, 87, 77, and 42 nuclei from yw flies at 1 and 5 weeks for LamC and LamB, respectively. *p<0.05, **p<10−2, ***p<10−3, and ****p<104 by one-way ANOVA with Tukey multiple comparisons test. Bars in (D) refer to min to max, with median and 25th and 75th interquartile range and error bars in (E-F) refer to mean +/− SD.
Extended Data Fig. 3
Extended Data Fig. 3. Validation and Morphological and Functional Characterization of LamB and LamC RNAi lines.
Corrected total nuclear fluorescence (CTNF) for cardiomyocytes from (A) LamC RNAi and (B) LamB RNAi fly lines and their respective controls, i.e., attp2 and attp40, n = 47, 36, 79, and 69 nuclei from attp2 and LamC RNAi flies at 1 and 4 weeks (left to right). n = 53, 29, 65, and 61 nuclei from attp40 and LamB RNAi flies at 1 and 4 weeks (left to right). (C) Plots quantifying nuclear perimeter (left, n = 111, 96, 46, and 89 nuclei/condition) and aspect ratio (right, n = 113, 97, 46, and 92 nuclei/condition) for LamB, LamC RNAi and their genetic controls. (D) Plots quantifying nuclear area, perimeter, aspect ratio, and circularity (left to right) for LamB and LamC RNAi lines and their genetic control background at 4 weeks. For all plots, n = 136, 101, 86, and 95 nuclei/condition left to right. (E-F) Plots of diastolic and systolic diameters, and shortening velocity determined from SOHA imaging for attp2 control and LamC RNAi flies (E), and attp40 control and LamB RNAi flies (F) at 1 and 4 weeks. Each LamC RNAi plots, n = 21, 23, 25, and 27 nuclei/condition, left to right. Each LamB RNAi plots, n = 31, 21, 26, and 25 nuclei/condition, left to right. For panels A-D, *p<0.05, **p<10−2, ***p<10−3, and ****p<104 from a two-sided unpaired t-test at each time point and RNAi line. For E-F, *p<0.05, **p<10−2, ***p<10−3, and ****p<104 by one-way ANOVA with Tukey multiple comparisons test. Error bars in (A-D) refer to mean +/− SD, and bars in (E, F) refer to min to max, with median and 25th and 75th interquartile range.
Extended Data Fig. 4
Extended Data Fig. 4. Validation of transgenic fly background, effects of LamB on myogenic transcription factor expression, and LamC heterozygous flies
(A) Volcano plot and (B) heat map of bulk RNA-seq from surgically dissected attp2 heart tubes. Fold change represents 5-week attp2 fly hearts normalized to 1-week old hearts and p-adj was computed from quintuplicate. 1,998 differentially expressed genes (DEGs) were assessed from cutoffs of −0.32 > log2(FC) > 0.32 (or −1.25 > FC > 1.25) (dashed lines) from comparisons of 15 fly hearts per replicate; DEGs increasing and decreasing with age are shown in green and purple, respectively. Heatmap columns were hierarchically clustered using Euclidean distance and linkage shown by the dendrogram. Heat maps are normalized within each gene/row. (C) 635 of 688 genes were co-regulated DEGs (92.3%) in the w1118 and attp2 control fly hearts, and plotted based on their fold change with age. DEGs were annotated based on their ontological categorization as nuclear (orange), extracellular matrix (ECM; green), or cytoskeletal (blue). A subset of DEGs either did not fit those categories (black/white) or lacked a known ontology (gray). Only 7.7% of all DEGs were dysregulated. (D) Representative images of attp40 control and LamB RNAi flies at 1 and 4 weeks showing H15, Hand and Tin transcription factor mRNA and DAPI. Scale bar is 5 μm. (E) Quantification of the per cell percentage area for each transcript in attp40 control and LamB RNAi flies at 1 and 4 weeks. For H15, n = 93, 87, 85, and 71 cells, left to right. For Hand, n = 111, 96, 105, and 76 cells, left to right. For Tin, n = 105, 118, 102, and 76 cells, left to right. (F) Quantification of cardiomyocyte nuclear area, circularity and LamC corrected total nuclear fluorescence for 1 week aged female control yw/w1118 and heterozygous LamC excision mutants yw/w1118;LamCex187/+ and yw/w1118;LamC296/+ fly hearts and their representative images in (G) showing staining for LamC (green) and DNA (Magenta), scale bare = 5μm. For (F), n = 29, 26, 25 (CM nuclei, left to right) (H) Quantification of heart parameters: fractional shortening, diastolic diameter and systolic diameter for background control and heterozygous LamC excision mutants. n = 17, 16, 16 (heart tubes, left to right) (I) Representative images of Hand, H15 and Tin mRNA in heterozygous LamC excision mutants, presented with quantification of per cell percentage area for each transcript in (J). n = 52, 39, 46 (CM nuclei, left to right). *p<0.05, **p<10−2, ***p<10−3, and ****p<104 by one-way ANOVA with Tukey multiple comparisons test. Box plots in (E, H, J) refer to min to max, with median and 25th and 75th interquartile range and error bars in (F) refer to mean +/− SD.
Extended Data Fig. 5
Extended Data Fig. 5. Effects of Adult Myogenic Transcription Factor Loss on of Heart Tube Morphology and Function
(A) Representative images of A2-A3 heart region visualized by phalloidin (F-Actin) with the indicated transgenes expressed under the control of the Hand-Gal4 promoter. Scale bar is 10 μm. At least three heart tubes were imaged for each condition. (B) Diastolic and (C) systolic diameters of heart tubes from control fly lines (attp40 and attp2) and their corresponding transgenic flies expressing the indicated RNAi. n = 10, 12, 18, 15, 19 and 14 (heart tubes, left to right). (D) CM nuclear area in attp2 control and LamC RNAi hearts subject to regime described in Fig. 6A. n = 29 and 22 (CM Nuclei, left to right). (E-G) Quantification of the per cell, percentage area for Hand, H15 and Tin transcripts upon KD of (E) LamC, (F) Hand (red),Tin (pink) and respective control attp2 (grey), and (G) H15 (blue) and attp40 control (grey), induced as in Fig. 6A. n = 32 and 26 (CM Nuclei/genotype) in (E), n = 20, 23, 28 (CM Nuclei/genotype, left to right) in (F) and n = 43 and 42 (CM Nuclei/genotype) in (G). (H) Schematic of temperature sensitive transgenic expression where 29°C enables transgenic expression due to the denaturation of Gal4 transcription factor suppressor, Gal80ts. (I) Fractional shortening of surgically exposed heart tubes at 18°C and 29°C for controls (black), and KD of tin (pink), Hand (brown), and H15 (blue) with corresponding diastolic and systolic diameters in (J-M). n = 13, 15, 18, 15, 26, 27, 16, 19, 29, 27, 29, and 21 (heart tubes/transgene/ temperature; left to right as shown in (I)). *p<0.05, **p<10−2, ***p<10−3, and ****p<104 by independent t-test and one-way ANOVA with Kruskal-Wallis test and Dunn’s comparisons test. Box plots show to min to max, with median and 25th and 75th interquartile range and error bars in (D) refer to mean +/− SD.
Extended Data Fig. 6
Extended Data Fig. 6. Effects of LamC and Myogenic Transcription Factor Overexpression
For panels A-D and as outlined in Figure 6A, flies were reared at 18°C and shifted to 25°C upon eclosure. Nuclear area (A) and CTNF (B) for hearts overexpressing LacZ (control) and LamC from 1 to 7 weeks. n = 31, 41, 23, 30, 26, and 31 cells (A, left to right) and n = 31, 31, 24, 29, 30, and 40 cells (B, left to right). (C) Diastolic and (D) systolic diameters of LacZ and Hand OE flies at 1, 4, and 7 weeks of adulthood. (E) Representative images (left) for nuclei from flies at 18°C and 29°C expressing GFPNLS transgene or LamC OE from HandGal,tubGal80ts;tubGal80ts based upon regime described in S5H. Scale bar is 5 μm. Plots of (F) projected nuclear area, (G) circularity, and (H) and corrected total nuclear fluorescence (CTNF) of LamC protein as a function of temperature and transgene expression. n = 39, 40, 46, and 41 nuclei (left to right). (I) For GFPNLS and LamC OE at 18°C and 29°C, representative images of LamC mRNA transcripts. Scale bar is 5 μm. (J) Quantification of LamC transcript area per CM in GFPNLS and LamC OE hearts, at 18°C and 29°C. n = 24, 36, 20 and 40 CMs, left to right. Diastolic (K) and systolic (L) diameters, and (M) fractional shortening for GFPNLS and LamC OE at 18°C and 29°C. n = 32, 19, 30 and 26 heart tubes, left to right. (N). A plot for each transcription factor is shown and quantifies the per cell, percentage area for each transcript. For all transcripts, n = 50, 56, 49 and 35 cells, left to right. (O) Representative images for tin (pink), Hand (brown), and H15 (blue) transcripts in GFPNLS and LamC OE at 18°C and 29°C. Scale bar is 5 μm. *p<0.05, **p<10−2, ***p<10−3, and ****p<104 by two-way ANOVA with Sidaks multiple comparisons test (A-D) and one-way ANOVA with Kruskal-Wallis test and Dunn’s comparisons test (F-N). Error bars in (A, B, F-H) refer to mean +/− SD and all box plots display min to max, with median and 25th and 75th interquartile range.
Extended Data Fig. 7
Extended Data Fig. 7. Myogenic transcription factor expression in the left ventricles of aged non-human primates and mice
(A) Expression of three housekeeping genes for mice are plotted as a function of age with a linear and associated p-value shown. Data is plotted for raw Cq values. (B) Expression of four transcription factors in mice is shown, normalized to each housekeeper gene. Data normalized to Eef1e1 (black), Rpl4 (medium gray), and ACTB (light gray) are plotted using the left and right y-axes, depending on the axis label colors. P-values for each fit are shown in the upper right corner. (C) Expression of three housekeeping genes for rhesus macaques are plotted as a function of age with a linear and associated p-value shown. Data is plotted for raw Cq values. (D) Expression of four transcription factors in rhesus macaques is shown, normalized to each housekeeper gene. Data normalized to Rpl13a (black) and TUBB2 (light gray) use the left y-axis whereas Rpl32 uses the right y-axis (medium gray). P-values for each fit are shown in the upper right corner.
Figure 1:
Figure 1:
Age-Associated Changes in Cardiac Nuclear Morphology and Mechanics. (A) Schematic of ventral Drosophila body plan with the heart tube in the abdomen highlighted in blue. Expanded view of the heart tube shows a coronal (XY) confocal section through the heart tube (center) as well as a transverse (XZ) confocal section and schematic to highlight nuclear position in the luminal space (right). Asterisks indicate cardiomyocyte nuclei. Scale bar is 20 μm. (B) Images of w1118 fly nuclei (left) and plot of their corresponding 2D projection data (right). Scale bar is 5 μm. n = 96, 116, and 141 nuclei for 1- , 3-, and 5-week adults, respectively. The brightness of the LaminB staining was autoscaled to highlight nuclear edge and not to represent local protein concentration. (C) 3D renderings of cardiac nuclei (left) and their corresponding for volume and surface area. n = 27, 37, and 34 nuclei for 1- , 3-, and 5-week adult w1118 flies respectively. (D) Atomic force microscopy (AFM) nuclear indentation schematic (top) and plot of stiffness values, i.e., Young’s modulus, for nuclei of w1118 flies (bottom). n = 35 and 28 nuclei for 1- and 5-week adults, respectively. **p<10−2 and ****p<104 by one-way ANOVA with Tukey multiple comparisons test in (B-C) and two-sided unpaired t-test with Welch’s correction in (D). Error bars in (B-C) refer to mean +/− SD, and in (D) show min to max, with median and 25th and 75th interquartile range.
Figure 2:
Figure 2:
Natural Aging Downregulates Nuclear Envelope Proteins. (A) Volcano plot and heat map of bulk RNA-seq from surgically dissected heart tubes. Fold change (FC) represents 5-week w1118 fly hearts normalized to 1-week old hearts and p-adjusted was computed from quadruplicate repeats. 1,494 differentially expressed genes (DEGs) were assessed from cutoffs of −0.32 > log2(FC) > 0.32 (or −1.25 > FC > 1.25) and p-adj < 0.05 (dashed lines) from comparisons of 15 fly hearts in quadruplicate biological replicates; DEGs increasing and decreasing with age are shown in green and purple, respectively. Heat maps are normalized within each gene/row. (B) The top 100 molecular function and cellular component gene ontological terms are plotted based on elimination pruning p-value. Terms related to cytoskeleton & sarcomere, ECM & adhesion, and chromatin remodeling & nuclear envelope are annotated by color. (C) Given as absolute fold change, the expression of selected genes associated with nuclear envelope terms are plotted, with Lamin C (LamC) expression noted with italics. (D) Confocal projection images of cardiomyocyte nuclei showing Lamin B (LamB) and C expression with age (left). Scale bar is 5 μm. (right) Corrected total nuclear fluorescence (CTNF), which adjusts for nucleus size, is plotted for LamB and LamC as a function of adult fly age. n = 141, 124, 116, 114, 107, and 69 nuclei/condition from left to right for LamC and LamB aged 1-, 3-, or 5-weeks of adulthood, respectively. ****p<104 by one-way ANOVA with Tukey multiple comparisons test. Error bars refer to mean +/− SD.
Figure 3:
Figure 3:
LamC, but not LamB, impacts Cardiomyocyte Aging, Heart Function, and Lifespan. (A) Confocal cross-section images are shown for transgenic flies knocking down LamB and LamC by RNAi (right) and their background fly line (left). Dashed lines indicate nuclear position based on DNA. Scale bar is 5 μm. (B) Plots quantifying nuclear area (left) and circularity (right) based on confocal images of LamB and LamC RNAi lines and their genetic control background at 1-week of adulthood. n = 111, 95, 46, and 90 (hearts/condition; left to right). (C) Plot of Young’s modulus values is shown for nuclei of the indicated adult ages for LamC (green), LamB (blue) RNAi, and their control strains (grey). n = 53, 36, 63, 35, 38, 31, 52, and 46 (hearts/condition; left to right). (D) Representative kymographs of surgically exposed heart tubes for LamC (green), LamB (blue) RNAi, and their control strains. White arrows mark the diastolic and systolic diameters. (E) Fractional shortening at 1- and 4-weeks of adulthood is plotted for LamC (green) and LamB (blue) RNAi, and their control strains. n = 21,18, 21, 23, 27, 20, 22, and 20 (hearts/condition; left to right). (F) Representative images of α-actinin staining for the indicated transgenic flies and their control backgrounds (paired by row) used to calculate Organizational index in (G) . Scale bar is 10 μm. (G) Organizational index is plotted for each heart tube. n = 22,19, 32, 26, 31, 25, 15, and 14 (hearts/condition; left to right). (H) Kaplan-Meier survival curve for LamC (green) and LamB (blue) RNAi, and their control strains. 102, 148, 95, and 200 flies for attp2, LamC RNAi, attp40, and LamB RNAi, respectively, were used in the plot. *p<0.05, **p<102, ***p<103, and ****p<104 by one-way ANOVA with Tukey multiple comparisons test for (B-G). ****p<10−4 based on Log-Rank (Mantel-Cox) test in (H). Error bars in (B, G) refer to mean +/− SD, and in (C,E) min to max, with median and 25th and 75th interquartile range.
Figure 4:
Figure 4:
Chromatin Accessibility Decreases with Age and LamC RNAi at Sites of Myogenic Control. (A) Map of accessibility peaks for Drosophila cardiac transcription factor genes Hand (top) and tinman (tin; upper middle) and sarcomere genes Tropomyosin (Tm1 and Tm2; lower middle) and Mhc (bottom). Data is shown in triplicate sequencing runs using 1-week adult w1118 flies, i.e., 3 lines plotted in the panel for 50 pooled hearts per replicate. (B) Volcano plots of the indicated aging or transgenic comparisons of differentially accessible regions (DARs) from ATAC-seq, assessed from −0.32 > log2(FC) > 0.32 (or −1.25 > FC > 1.25) and p-adj < 0.05. The number of peaks is annotated at the bottom for each comparison indicating if the region is more (black) or less (red) accessible relative to the comparator line. (C) Scatter plot is shown for ATAC-seq data comparing the Log2(FC) in accessibility for genes based on effects from aging and LamC (green) or LamB (blue) RNAi. Percentage of data in each quadrant are shown. (D) Top gene ontological terms are plotted for co-downregulated peaks (closest associated gene) in aged and LamC RNAi fly comparisons and ordered based on the false discovery rate p-value. (E) Genes within the anatomical structure term were plotted for their fold change for aging (gray) and LamC RNAi (green). Genes names in red represent myogenic transcription factors or muscle-specific structure proteins. (F) Map of accessibility peaks for the myogenic transcription factor Hand. Arrows indicate the location of a common DAR in Hand that is present and reduces in aged and LamC RNAi flies but not in LamB RNAi flies. Multiple lines per map indicate multiple sequencing runs of biological replicates. DAR fold change is annotated for each comparison.
Figure 5:
Figure 5:
LamC Loss Transcriptionally Regulates Myogenic Transcription Factors. (A) Volcano plot and heat map of bulk RNA-seq from surgically dissected heart tubes from LamC RNAi flies compared to attp2 control background flies at 1-week of age. 344 DEGs were assessed from cutoffs of −0.32 > log2(FC) > 0.32 (or −1.25 > FC > 1.25) and p-adj < 0.05 (dashed lines) from comparisons of 15 fly hearts in quadruplicate biological replicates; DEGs increasing and decreasing with LamC RNAi are shown in green and purple, respectfully. Heat maps are normalized within each gene/row. (B) Scatter plot is shown comparing Log2 Fold Change from aging (1- and 5-weeks of age) and LamC RNAi compared to control background (attp2). Number of DEGs represent genes of known function. Data was categorized based on which cellular component ontology term it most closely matches. Distance from the red dashed line of unity was used identify co-regulated genes whose (C) biological process ontology terms were annotated and ordered based on their false discovery rate p-value. (D) Genes within the anatomical structure term were plotted for their fold change for aging (gray) and LamC RNAi (green). Genes names in red represent myogenic transcription factors or muscle-specific structure proteins. (E) Representative images of in situ hybridization chain reaction for transcription factors H15, Hand, and tin, co-stained with DAPI, for LamC RNAi and control attp2 flies at 1- and 4-weeks of adulthood with quantification (F) for each transcription factor is also shown (right) and quantifies the per cell percent area covered by each transcript. For H15, n = 39, 76, 64, and 45 cells for 1-week control, 1-week LamC RNAi, 4-week control, and 4-week LamC RNAi, respectively. For Hand, n = 71, 84, 52, and 43 cells for 1-week control, 1-week LamC RNAi, 4-week control, and 4-week LamC RNAi, respectively. For tin, n = 69, 101, 103, and 85 cells for 1-week control, 1-week LamC RNAi, 4-week control, and 4-week LamC RNAi, respectively. *p<0.05, **p<10−2, ***p<10−3, and ****p<104 by one-way ANOVA with Tukey multiple comparisons test. Bars in (F) represent min to max, with median and 25th and 75th interquartile range.
Figure 6:
Figure 6:
Myogenic Transcription Factors maintain heart contractility in aged flies (A) Schematic of temperature sensitive transgenic expression where 18°C minimizes Gal4 mediated expression up to adult fly eclosure. At 25°C transgene expression is high enabling assessment of gene role in adult heart. (B) Quantification of fractional shortening for surgically exposed hearts with Hand-Gal4 driving expression of LamC RNAi (green), Hand RNAi (red), Tin RNAi (pink) and respective control attp2 (grey), and H15 RNAi (blue) with attp40 control (grey) with temperature schedule shown in (A), n = 10, 12, 18, 15, 19 and 14 (heart tubes left to right). (C) Fractional shortening plots for Hand-Gal4 driven expression of LamC OE by the regime shown in (A) with control, over expression of LacZ (A). n = 20, 20, 16, 19, 18, 16 (Heart tubes/age, left to right). (D) Representative images of RNA in situ with hybridization chain reaction for Hand, H15 and Tin transcripts, with corresponding quantification of the per cell, percentage area for each transcript, for LacZ control and LamC OE in (E) and Hand OE in (G) each at 1, 4 and 7 weeks at 25°C. (E) n = 36, 47, 27, 34, 29, 43 (CM nuclei/Genotype/age, left to right). Scale bar in (D) is 5 μm. (F) Fractional shortening plots for Hand-Gal4 driven expression of Hand OE by the regime shown in (A) with control, over expression of LacZ (A). n = 20, 20, 16, 21, 19, 18 (Heart tubes/age, left to right). (G) n = 36, 47, 27, 30, 35, 35 (Note same control; CM nuclei/age, left to right). *p<0.05, **p<10−2, ***p<10−3, and ****p<104 by one-way ANOVA with Kruskal-Wallis test and Dunn’s comparisons test in (B), and two-way ANOVA with Sidaks multiple comparisons test. In all graphs, bars represent min to max, with median and 25th and 75th interquartile range.
Figure 7:
Figure 7:
Nuclear remodeling induces adult-onset transcription factor loss, a process conserved in Mice and Non-human Primates. (A) Schematic depicting how age-associated, cardiac-specific reduction of nuclear lamins reduces nuclear volume and chromatin accessibility, especially for myogenic transcription factors. With less muscle transcription from key cardiac loci, sarcomeres become disordered with age and heart function is reduced. Lamin overexpression can overcome age-associate reduction and preserve function. (B) Immunofluorescent staining of mouse heart sections at 9 and 29 months of age with anti-LamA/C (green) and DAPI (magenta). Scale bar = 30 μm. Below shows plots of projected nuclear area and circularity with respective ages. n = 3 biological replicates and 3 technical replicates. (C) Immunofluorescent staining of monkey left ventricle sections at 8.9 and 25.5 years of age with anti-LamA/C (green) and DAPI (magenta). Scale bar = 30 μm. Below shows plots of projected nuclear area and circularity with respective ages. n = 3 biological replicates and 3 technical replicates. qPCR results are plotted for (D) mouse and (E) rhesus macaque for the myogenic transcription factors Hand 1, Hand 2, Nkx2–5, and TBX20 as normalized by housekeepers Eef1e1, Rpl4, and ACTB for mouse and Rpl13a, Rpl20, and TUBB2 for macaque. Data were normalized to maximum and minimum expression within each gene and housekeeper for heatmap. Bar graph and regression indicate the average expression and standard error of the mean across all genes and housekeepers for each animal; r2 = 0.50 and 0.71 for mouse and macaque, respectively. *p<0.05, **p<10−2, ***p<10−3, and ****p<104 by two-sided unpaired t-test (B and C, circularity) and with Welch’s correction in (B and C, nuclear area). Significance in (D) and (E) indicate deviation from 0 for simple linear regression. Error bars in (B, left and center, C) refer to mean +/− SD, and in (B, right) min to max, with median and 25th and 75th interquartile range.

Comment in

Similar articles

Cited by

References

    1. Phillip JM, Aifuwa I, Walston J & Wirtz D The Mechanobiology of Aging. Annu Rev Biomed Eng 17, 113–141 (2015). - PMC - PubMed
    1. Gilbert HTJ & Swift J The consequences of ageing, progeroid syndromes and cellular senescence on mechanotransduction and the nucleus. Exp Cell Res 378, 98–103 (2019). - PubMed
    1. CDC, N. Underlying Cause of Death 1999-2013 on CDC WONDER Online Database, released 2015. Data are from the Multiple Cause of Death Files, 1999-2013, as compiled from data provided by the 57 vital statistics jurisdictions through the Vital Statistics Cooperative . (2015).
    1. Sessions AO et al. Extracellular matrix downregulation in the Drosophila heart preserves contractile function and improves lifespan. Matrix Biol 62, 15–27 (2017). - PMC - PubMed
    1. Kaushik G et al. Vinculin network-mediated cytoskeletal remodeling regulates contractile function in the aging heart. Sci Transl Med 7, 292ra99 (2015). - PMC - PubMed

Publication types