. 2023 Feb 9:14:1034356.
doi: 10.3389/fimmu.2023.1034356. eCollection 2023.

Dysregulation of innate cell types in the hepatic immune microenvironment of alcoholic liver cirrhosis

Affiliations

Dysregulation of innate cell types in the hepatic immune microenvironment of alcoholic liver cirrhosis

Ao Ren et al. Front Immunol. .

Abstract

Introduction: The risk of alcoholic cirrhosis increases in a dose- and time-dependent manner with alcohol consumption and ethanol metabolism in the liver. Currently, no effective antifibrotic therapies are available. We aimed to obtain a better understanding of the cellular and molecular mechanisms involved in the pathogenesis of liver cirrhosis.

Methods: We performed single-cell RNA-sequencing to analyze immune cells from the liver tissue and peripheral blood form patients with alcoholic cirrhosis and healthy controls to profile the transcriptomes of more than 100,000 single human cells and yield molecular definitions for non-parenchymal cell types. In addition, we performed single-cell RNA-sequencing analysis to reveal the immune microenvironment related to alcoholic liver cirrhosis. Hematoxylin and eosin, Immunofluorescence staining and Flow cytometric analysis were employed to study the difference between tissues and cells with or without alcoholic cirrhosis.

Results: We identified a fibrosis-associated M1 subpopulation of macrophages that expands in liver fibrosis, differentiates from circulating monocytes, and is pro-fibrogenic. We also define mucosal-associated invariant T (MAIT) cells that expand in alcoholic cirrhosis and are topographically restricted to the fibrotic niche. Multilineage modeling of ligand and receptor interactions between the fibrosis-associated macrophages, MAIT, and NK cells revealed the intra-fibrotic activity of several pro-fibrogenic pathways, including responses to cytokines and antigen processing and presentation, natural killer cell-mediated cytotoxicity, cell adhesion molecules, Th1/Th2/Th17 cell differentiation, IL-17 signaling pathway, and Toll-like receptor signaling pathway.

Discussion: Our work dissects unanticipated aspects of the cellular and molecular basis of human organ alcoholic fibrosis at the single-cell level and provides a conceptual framework for the discovery of rational therapeutic targets in liver alcoholic cirrhosis.

Keywords: MAIT cells; NKT cells; fibrosis; macrophages; scRNA-seq.


Conflict of interest statement

The authors declare that the research was conducted in the absence of any commercial or financial relationships that could be construed as a potential conflict of interest.

Figures
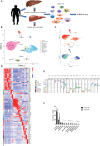
Figure 1
Figure 1
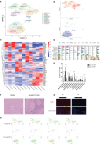
Single-cell atlas of human liver non-parenchymal cells (NPCs). (A) An overview of the isolation, FACS, and single-cell sequencing (scRNA-seq) analyses of NPC fractions from liver tissue and peripheral blood mononuclear cells (PBMCs). (B) Clustering of 21638 liver-resident cells and PBMCs from five liver tissue and peripheral blood samples (n = 2 healthy and n = 3 alcoholic cirrhosis) (C) Annotation of the conditions of the patients. (D) Heatmap of cluster marker genes. (E) Scaled gene expression of NPCs cells. (F) Fraction of cells from NPCs. (*P < 0.05, **P < 0.01, ***P < 0.001).
Figure 2
Figure 2
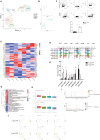
The monocyte and macrophage subpopulations. (A) Clustering of 5176 monocytes and macrophages from five liver tissue and peripheral blood samples (n = 2 healthy and n = 3 alcoholic cirrhosis) (B) Annotation of monocytes and macrophages by patient’s condition. (C) Heatmap of MP cluster marker genes. (D) Scaled gene expression of monocytes and macrophages. (E) Fraction of monocyte and macrophage cells. (F) Pathological changes in the liver tissues of patients with alcoholic cirrhosis (10×). (G) Representative immunofluorescent images of CD80 (red), CD206 (white), CD68 (green), and DAPI (blue) in alcoholic cirrhotic livers (10×), and the distribution of M1 and M2 in healthy and alcoholic cirrhotic livers. (H) Proteomic analysis of CD80, CD52, CD163, and CD206. (*P < 0.05, **P < 0.01, ***P < 0.001).
Figure 3
Figure 3
(A) Pseudotime analysis of monocyte and macrophage subpopulations. (B) Heatmap displaying the expressions of selected marker genes in monocytes and macrophages that are arranged along the pseudotime trajectory.
Figure 4
Figure 4
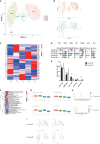
Identifying MAIT cell subpopulations. (A) Clustering of 969 mucosal-associated invariant T (MAIT) cells from five liver tissue and peripheral blood samples (n = 2 healthy and n = 3 alcoholic cirrhosis) (B) Annotation of MAIT cells by patient’s condition. (C) Heatmap of MAIT cell cluster marker genes. (D) Scaled gene expression in MAIT cells. (E) Fraction of MAIT cells. (F) Flow analysis of MAIT cells in each group. (G) QuSAGE analysis of MAIT cells in the A, AP, and H groups. (H) Single-sample GSEA (ssGSEA) analysis of MAIT cells in the A, AP, H, and HP groups. (I) Cytokine and chemokine analyses of MAIT cells in the A, AP, H, and HP groups. (J) Proteomic analysis of KLRG1, CD69, and TCR. (*P < 0.05, **P < 0.01, ***P < 0.001).
Figure 5
Figure 5
Identifying NK cell subpopulations. (A) Clustering of 3578 natural killer (NK) cells from five liver tissue and peripheral blood samples (n = 2 healthy and n = 3 alcoholic cirrhosis). (B) Annotation of NK cells by patient’s condition. (C) Heatmap of NK cell cluster marker genes. (D) Scaled gene expression in NK cells. (E) Fraction of NK cells. (F) QuSAGE analysis of NK cells in the A, AP, H, and HP groups. (G) Single-sample GSEA (ssGSEA) analysis of NK cells in the A, AP, H, and HP groups. (H) Cytokine and chemokine analyses of NK cells in the A, AP, H, and HP groups. (I) Proteomic analysis of CD62L and CD44. (*P < 0.05, **P < 0.01, ***P < 0.001).
Figure 6
Figure 6
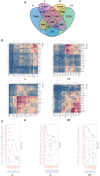
The interactions among NK cells, macrophages, and MAIT cells in the A, AP, H, and HP groups. (A) Venn diagram comparing different groups. (B) Heatmap showing the interactions among NK cells, macrophages, and MAIT cells in the A, AP, H, and HP groups. (C) Dot plot of ligand–receptor interactions among macrophages, MAIT, and NK cells in the A and AP groups.

Similar articles

Cited by

References

    1. Thomson MJ, Tapper EB, Lok ASF. Dos and don'ts in the management of cirrhosis: A view from the 21st century. Am J Gastroenterol (2018) 113(7):927–31. doi: 10.1038/s41395-018-0028-5 - DOI - PMC - PubMed
    1. Wilde B, Katsounas A. Immune dysfunction and albumin-related immunity in liver cirrhosis. Mediators Inflamm (2019) 2019:7537649. doi: 10.1155/2019/7537649 - DOI - PMC - PubMed
    1. Tsochatzis EA, Bosch J, Burroughs AK. Liver cirrhosis. Lancet (2014) 383(9930):1749–61. doi: 10.1016/S0140-6736(14)60121-5 - DOI - PubMed
    1. Mann RE, Smart RG, Govoni R. The epidemiology of alcoholic liver disease. Alcohol Res Health (2003) 27(3):209–19. - PMC - PubMed
    1. Lucey MR. Alcohol-associated cirrhosis. Clin Liver Dis (2019) 23(1):115–26. doi: 10.1016/j.cld.2018.09.013 - DOI - PubMed

Publication types