

Adjuvant activity of tubeimosides by mediating the local immune microenvironment
- PMID: 36845089
- PMCID: PMC9950507
- DOI: 10.3389/fimmu.2023.1108244
Adjuvant activity of tubeimosides by mediating the local immune microenvironment
Abstract
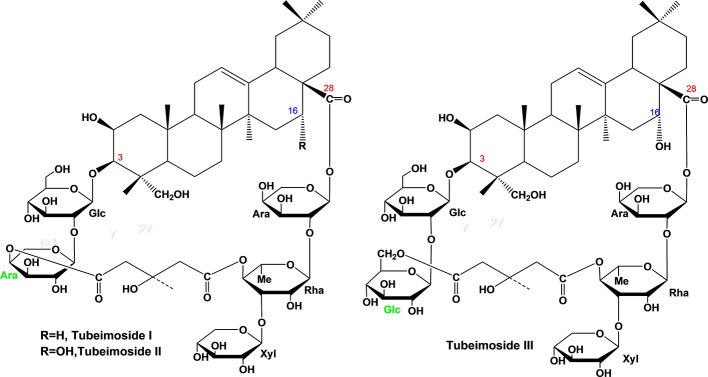
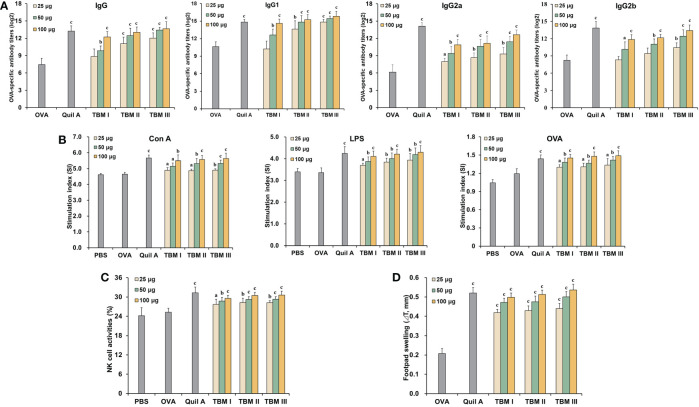
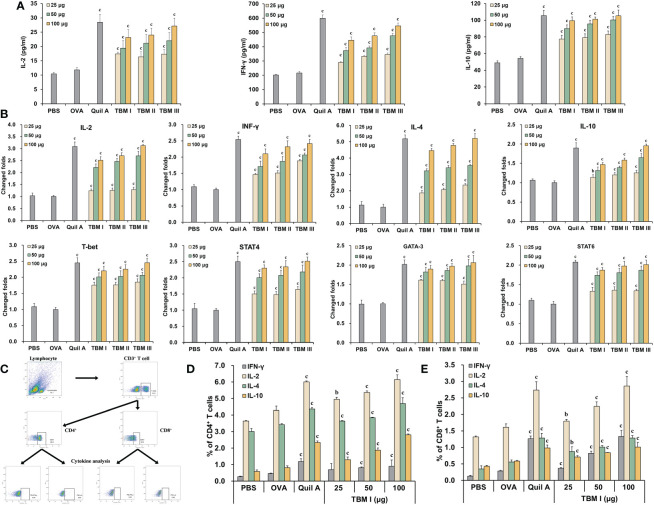
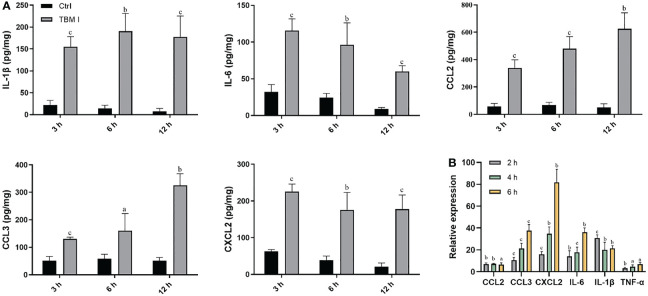
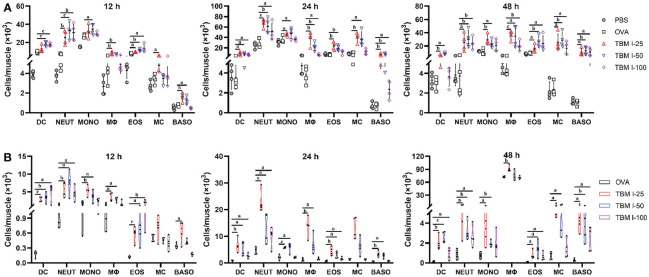
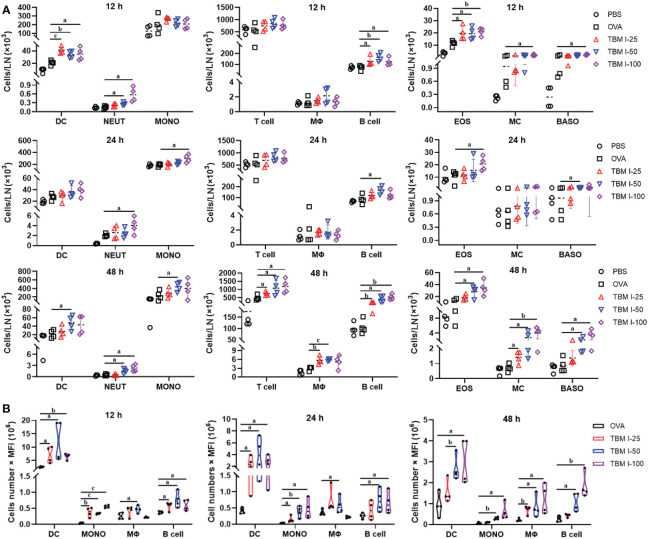
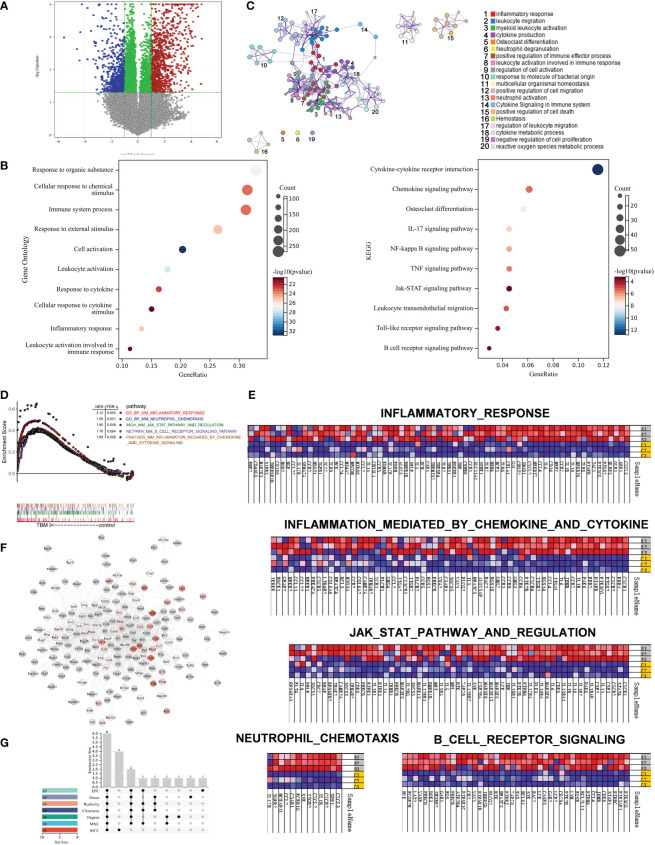
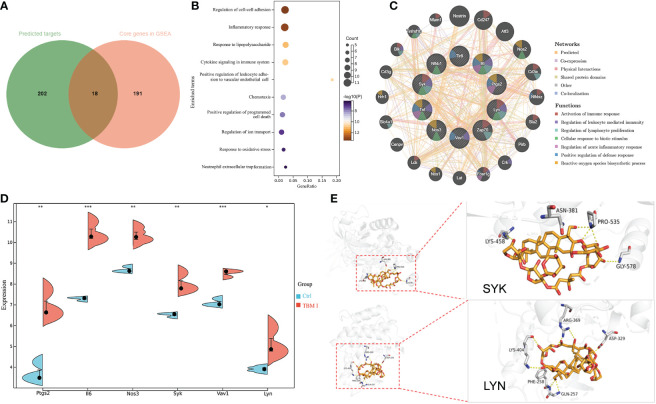
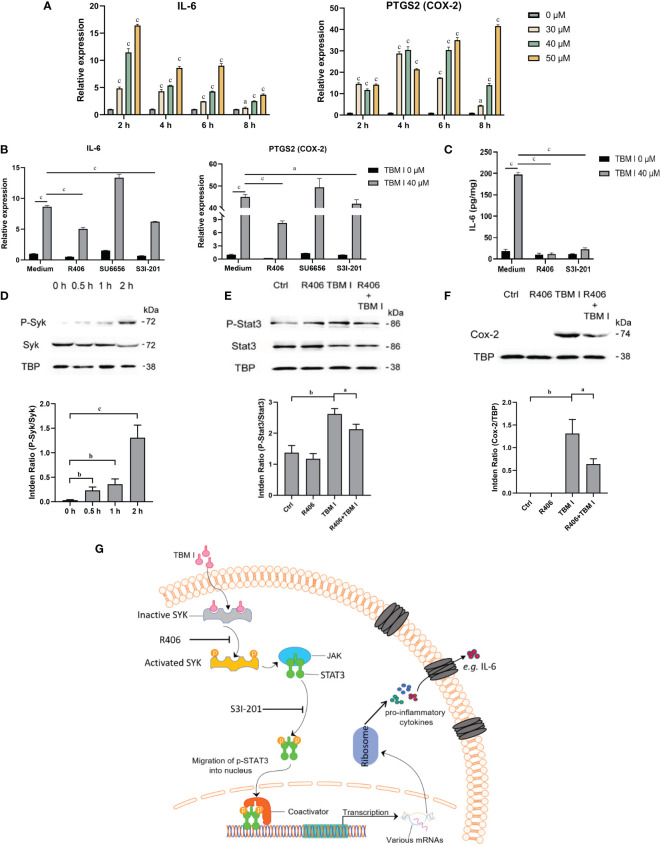
Rhizoma Bolbostemmatis, the dry tuber of Bolbostemma paniculatum, has being used for the treatment of acute mastitis and tumors in traditional Chinese medicine. In this study, tubeimoside (TBM) I, II, and III from this drug were investigated for the adjuvant activities, structure-activity relationships (SAR), and mechanisms of action. Three TBMs significantly boosted the antigen-specific humoral and cellular immune responses and elicited both Th1/Th2 and Tc1/Tc2 responses towards ovalbumin (OVA) in mice. TBM I also remarkably facilitated mRNA and protein expression of various chemokines and cytokines in the local muscle tissues. Flow cytometry revealed that TBM I promoted the recruitment and antigen uptake of immune cells in the injected muscles, and augmented the migration and antigen transport of immune cells to the draining lymph nodes. Gene expression microarray analysis manifested that TBM I modulated immune, chemotaxis, and inflammation-related genes. The integrated analysis of network pharmacology, transcriptomics, and molecular docking predicted that TBM I exerted adjuvant activity by interaction with SYK and LYN. Further investigation verified that SYK-STAT3 signaling axis was involved in the TBM I-induced inflammatory response in the C2C12 cells. Our results for the first time demonstrated that TBMs might be promising vaccine adjuvant candidates and exert the adjuvant activity through mediating the local immune microenvironment. SAR information contributes to developing the semisynthetic saponin derivatives with adjuvant activities.
Keywords: adjuvant; molecular docking; network pharmacology; structure-activity relationships; transcriptomics; tubeimosides.
Copyright © 2023 Han, Jin, Chen, He and Sun.
Conflict of interest statement
The authors declare that the research was conducted in the absence of any commercial or financial relationships that could be construed as a potential conflict of interest.
Figures
Similar articles
-
The potential role of tubeimosides in cancer prevention and treatment.Eur J Med Chem. 2019 Jan 15;162:109-121. doi: 10.1016/j.ejmech.2018.11.001. Epub 2018 Nov 3. Eur J Med Chem. 2019. PMID: 30439592 Review.
-
Adjuvant effect of two polysaccharides from the petals of Crocus sativus and its mechanisms.Int J Biol Macromol. 2022 Apr 15;204:50-61. doi: 10.1016/j.ijbiomac.2022.01.169. Epub 2022 Feb 2. Int J Biol Macromol. 2022. PMID: 35122804
-
Structure-activity relationship of tubeimosides in anti-inflammatory, antitumor, and antitumor-promoting effects.Acta Pharmacol Sin. 2001 May;22(5):463-8. Acta Pharmacol Sin. 2001. PMID: 11743898
-
Exploration of the immuno-adjuvant effect and mechanism of Anemoside B4 through network pharmacology and experiment verification.Phytomedicine. 2024 Feb;124:155302. doi: 10.1016/j.phymed.2023.155302. Epub 2023 Dec 19. Phytomedicine. 2024. PMID: 38176273
-
Elucidating the Mechanisms of Action of Saponin-Derived Adjuvants.Trends Pharmacol Sci. 2018 Jun;39(6):573-585. doi: 10.1016/j.tips.2018.03.005. Epub 2018 Apr 11. Trends Pharmacol Sci. 2018. PMID: 29655658 Review.
Cited by
-
Development of semisynthetic saponin immunostimulants.Med Chem Res. 2024;33(8):1292-1306. doi: 10.1007/s00044-024-03227-x. Epub 2024 May 18. Med Chem Res. 2024. PMID: 39132259 Free PMC article. Review.
-
Quzhou Aurantii Fructus Flavonoids Ameliorate Inflammatory Responses, Intestinal Barrier Dysfunction in DSS-Induced Colitis by Modulating PI3K/AKT Signaling Pathway and Gut Microbiome.J Inflamm Res. 2025 Feb 6;18:1855-1874. doi: 10.2147/JIR.S500014. eCollection 2025. J Inflamm Res. 2025. PMID: 39931170 Free PMC article.
-
Azoximer bromide and hydroxyapatite: promising immune adjuvants in cancer.Cancer Biol Med. 2024 Feb 5;20(12):1021-34. doi: 10.20892/j.issn.2095-3941.2023.0222. Cancer Biol Med. 2024. PMID: 38318840 Free PMC article. Review.
References
-
- Cebon JS, Gore M, Thompson JF, Davis ID, McArthur GA, Walpole E, et al. . Results of a randomized, double-blind phase II clinical trial of NY-ESO-1 vaccine with ISCOMATRIX adjuvant versus ISCOMATRIX alone in participants with high-risk resected melanoma. J Immunother Cancer (2020) 8(1):e000410. doi: 10.1136/jitc-2019-000410 - DOI - PMC - PubMed
Publication types
MeSH terms
Substances
LinkOut - more resources
Full Text Sources
Molecular Biology Databases
Miscellaneous