

The co-inhibitory receptor TIGIT regulates NK cell function and is upregulated in human intrahepatic CD56bright NK cells
- PMID: 36845105
- PMCID: PMC9948018
- DOI: 10.3389/fimmu.2023.1117320
The co-inhibitory receptor TIGIT regulates NK cell function and is upregulated in human intrahepatic CD56bright NK cells
Abstract
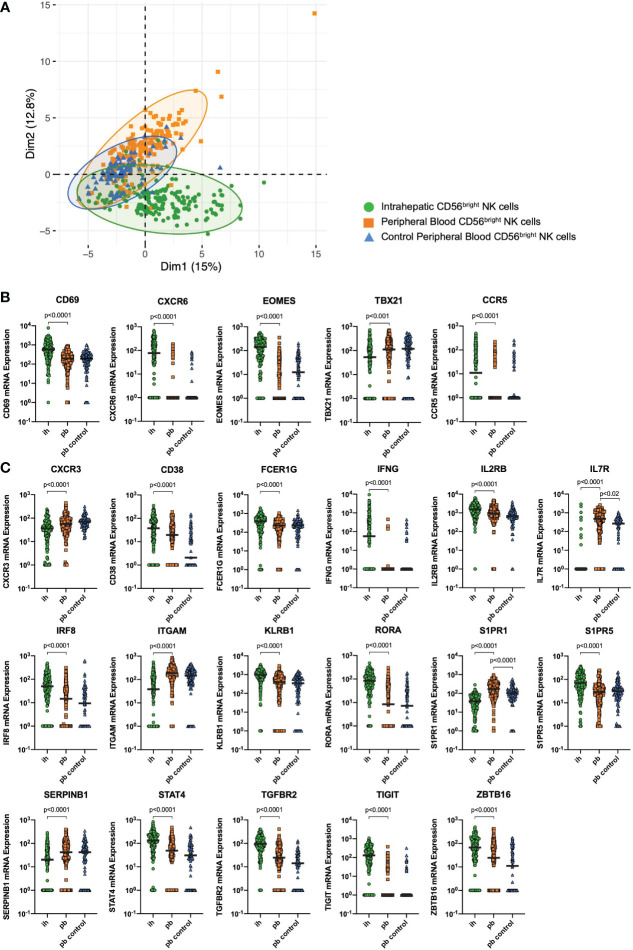
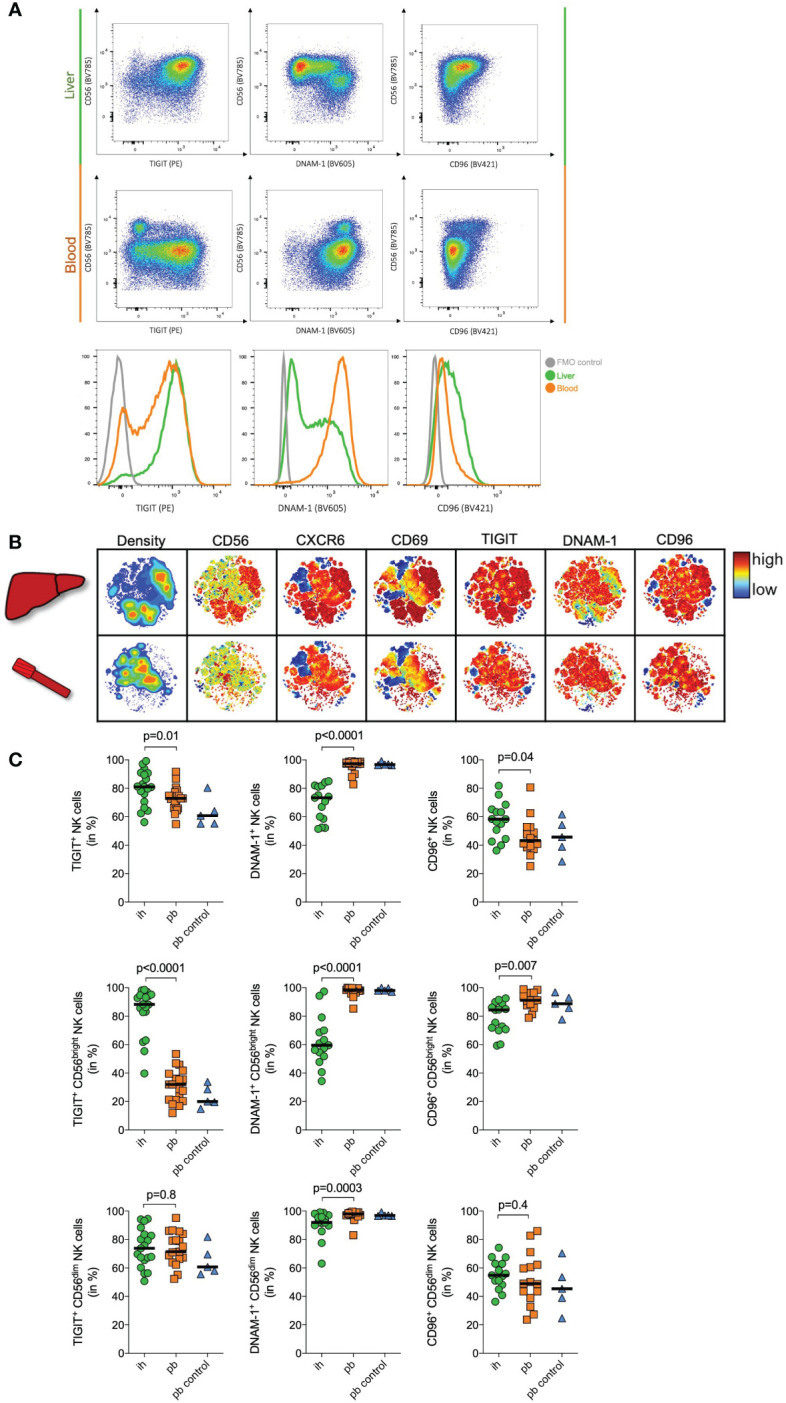
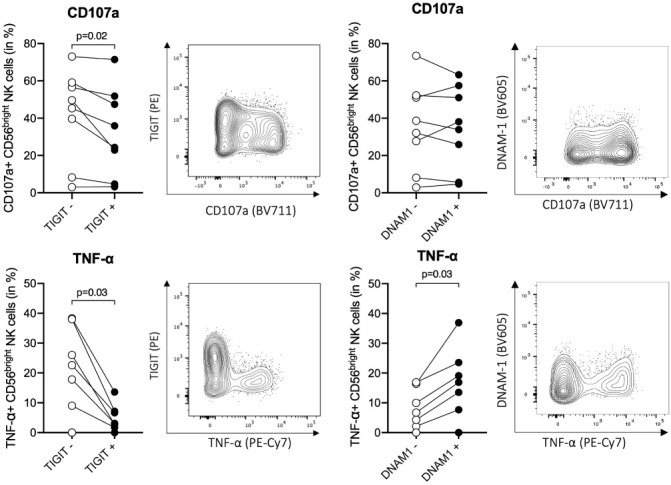
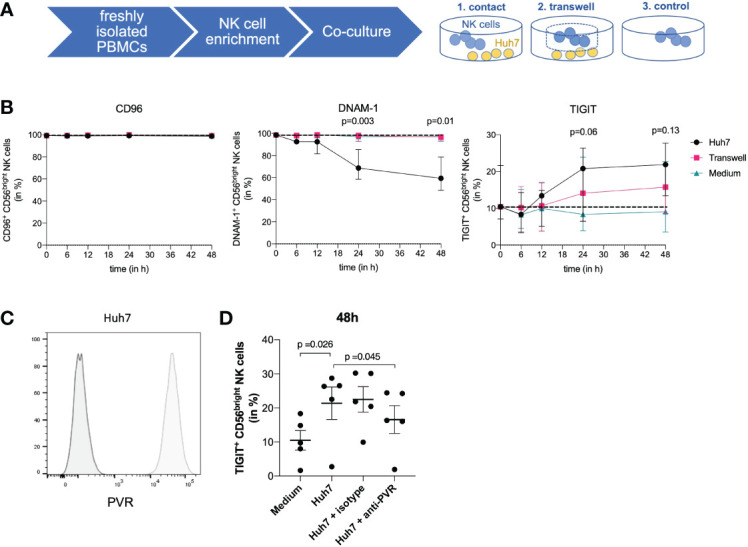
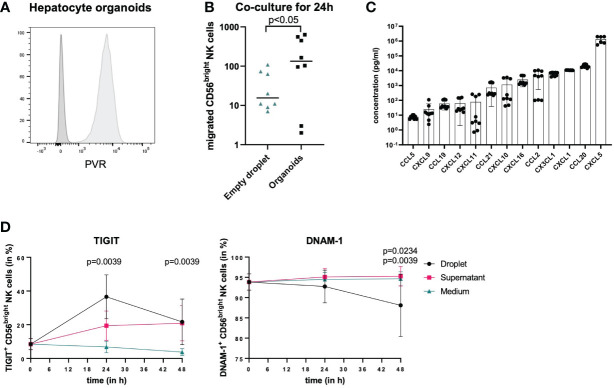
The crosstalk between NK cells and their surrounding environment is enabled through activating and inhibitory receptors, which tightly control NK cell activity. The co-inhibitory receptor TIGIT decreases NK cell cytotoxicity and is involved in NK cell exhaustion, but has also been associated with liver regeneration, highlighting that the contribution of human intrahepatic CD56bright NK cells in regulating tissue homeostasis remains incompletely understood. A targeted single-cell mRNA analysis revealed distinct transcriptional differences between matched human peripheral blood and intrahepatic CD56bright NK cells. Multiparameter flow cytometry identified a cluster of intrahepatic NK cells with overlapping high expression of CD56, CD69, CXCR6, TIGIT and CD96. Intrahepatic CD56bright NK cells also expressed significantly higher protein surface levels of TIGIT, and significantly lower levels of DNAM-1 compared to matched peripheral blood CD56bright NK cells. TIGIT+ CD56bright NK cells showed diminished degranulation and TNF-α production following stimulation. Co-incubation of peripheral blood CD56bright NK cells with human hepatoma cells or primary human hepatocyte organoids resulted in migration of NK cells into hepatocyte organoids and upregulation of TIGIT and downregulation of DNAM-1 expression, in line with the phenotype of intrahepatic CD56bright NK cells. Intrahepatic CD56bright NK cells represent a transcriptionally, phenotypically, and functionally distinct population of NK cells that expresses higher levels of TIGIT and lower levels of DNAM-1 than matched peripheral blood CD56bright NK cells. Increased expression of inhibitory receptors by NK cells within the liver environment can contribute to tissue homeostasis and reduction of liver inflammation.
Keywords: DNAM-1; PVR/CD155; TIGIT; immune tolerance; intrahepatic NK cells; liver organoids; single-cell mRNA analysis; tissue homeostasis.
Copyright © 2023 Ziegler, Fittje, Müller, Ahrenstorf, Hagemann, Hagen, Hess, Niehrs, Poch, Ravichandran, Löbl, Padoan, Brias, Hennesen, Richard, Richert, Peine, Oldhafer, Fischer, Schramm, Martrus, Bunders, Altfeld and Lunemann.
Conflict of interest statement
The authors declare that the research was conducted in the absence of any commercial or financial relationships that could be construed as a potential conflict of interest.
Figures
Similar articles
-
Increased expression of TIGIT and KLRG1 correlates with impaired CD56bright NK cell immunity in HPV16-related cervical intraepithelial neoplasia.Virol J. 2022 Apr 12;19(1):68. doi: 10.1186/s12985-022-01776-4. Virol J. 2022. PMID: 35413989 Free PMC article.
-
TIGIT blockade enhances functionality of peritoneal NK cells with altered expression of DNAM-1/TIGIT/CD96 checkpoint molecules in ovarian cancer.Oncoimmunology. 2020 Nov 8;9(1):1843247. doi: 10.1080/2162402X.2020.1843247. Oncoimmunology. 2020. PMID: 33224630 Free PMC article.
-
Analysis of the Characteristics of TIGIT-Expressing CD3-CD56+NK Cells in Controlling Different Stages of HIV-1 Infection.Front Immunol. 2021 Feb 26;12:602492. doi: 10.3389/fimmu.2021.602492. eCollection 2021. Front Immunol. 2021. PMID: 33717085 Free PMC article.
-
DNAM-1 and the TIGIT/PVRIG/TACTILE Axis: Novel Immune Checkpoints for Natural Killer Cell-Based Cancer Immunotherapy.Cancers (Basel). 2019 Jun 23;11(6):877. doi: 10.3390/cancers11060877. Cancers (Basel). 2019. PMID: 31234588 Free PMC article. Review.
-
The biology of human natural killer-cell subsets.Trends Immunol. 2001 Nov;22(11):633-40. doi: 10.1016/s1471-4906(01)02060-9. Trends Immunol. 2001. PMID: 11698225 Review.
Cited by
-
The development and application of chimeric antigen receptor natural killer (CAR-NK) cells for cancer therapy: current state, challenges and emerging therapeutic advances.Exp Hematol Oncol. 2024 Dec 4;13(1):118. doi: 10.1186/s40164-024-00583-7. Exp Hematol Oncol. 2024. PMID: 39633491 Free PMC article. Review.
-
Kir6.1, a component of an ATP-sensitive potassium channel, regulates natural killer cell development.Front Immunol. 2024 Dec 2;15:1490250. doi: 10.3389/fimmu.2024.1490250. eCollection 2024. Front Immunol. 2024. PMID: 39687626 Free PMC article.
-
A Multi-Omics Analysis of an Exhausted T Cells' Molecular Signature in Pan-Cancer.J Pers Med. 2024 Jul 18;14(7):765. doi: 10.3390/jpm14070765. J Pers Med. 2024. PMID: 39064019 Free PMC article.
-
Effect of plasma-induced oxidation on NK cell immune checkpoint ligands: A computational-experimental approach.Redox Biol. 2024 Nov;77:103381. doi: 10.1016/j.redox.2024.103381. Epub 2024 Oct 1. Redox Biol. 2024. PMID: 39395241 Free PMC article.
-
TIGIT, as a potential immune checkpoint target for immunotherapy of breast cancer.Med Oncol. 2025 Aug 5;42(9):407. doi: 10.1007/s12032-025-02955-3. Med Oncol. 2025. PMID: 40762903 Review.
References
Publication types
MeSH terms
Substances
LinkOut - more resources
Full Text Sources
Research Materials