. 2023 Feb 10:14:1106537.
doi: 10.3389/fimmu.2023.1106537. eCollection 2023.

Autoantibody repertoire characterization provides insight into the pathogenesis of monogenic and polygenic autoimmune diseases

Affiliations

Autoantibody repertoire characterization provides insight into the pathogenesis of monogenic and polygenic autoimmune diseases

Thomas Clarke et al. Front Immunol. .

Abstract

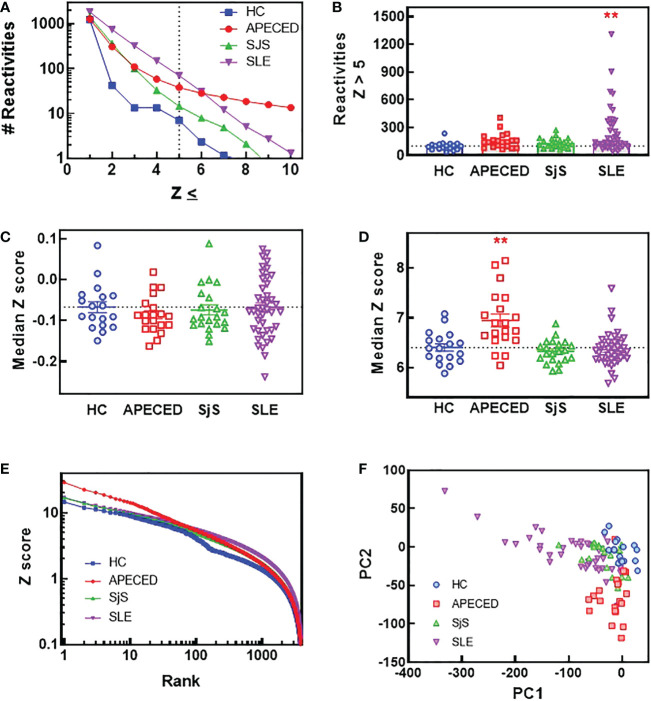
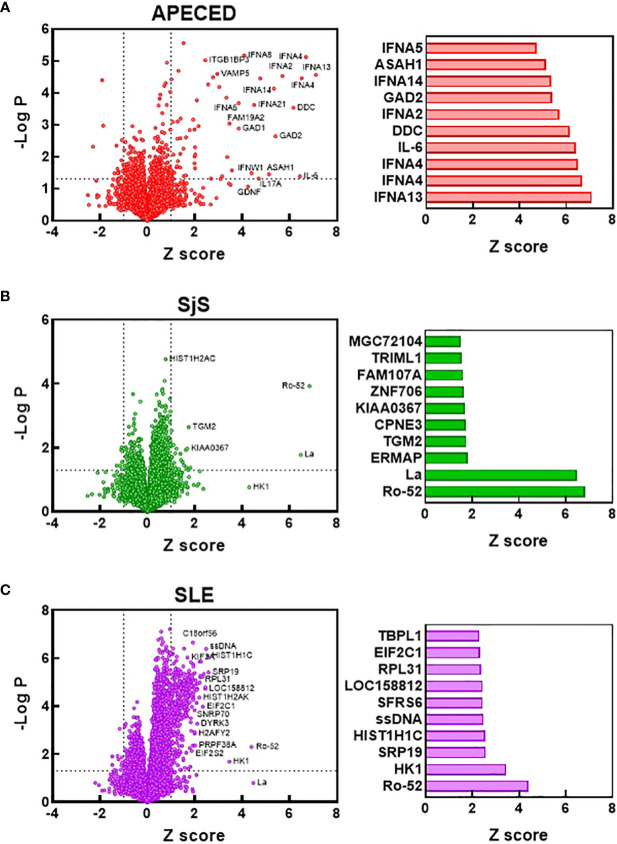
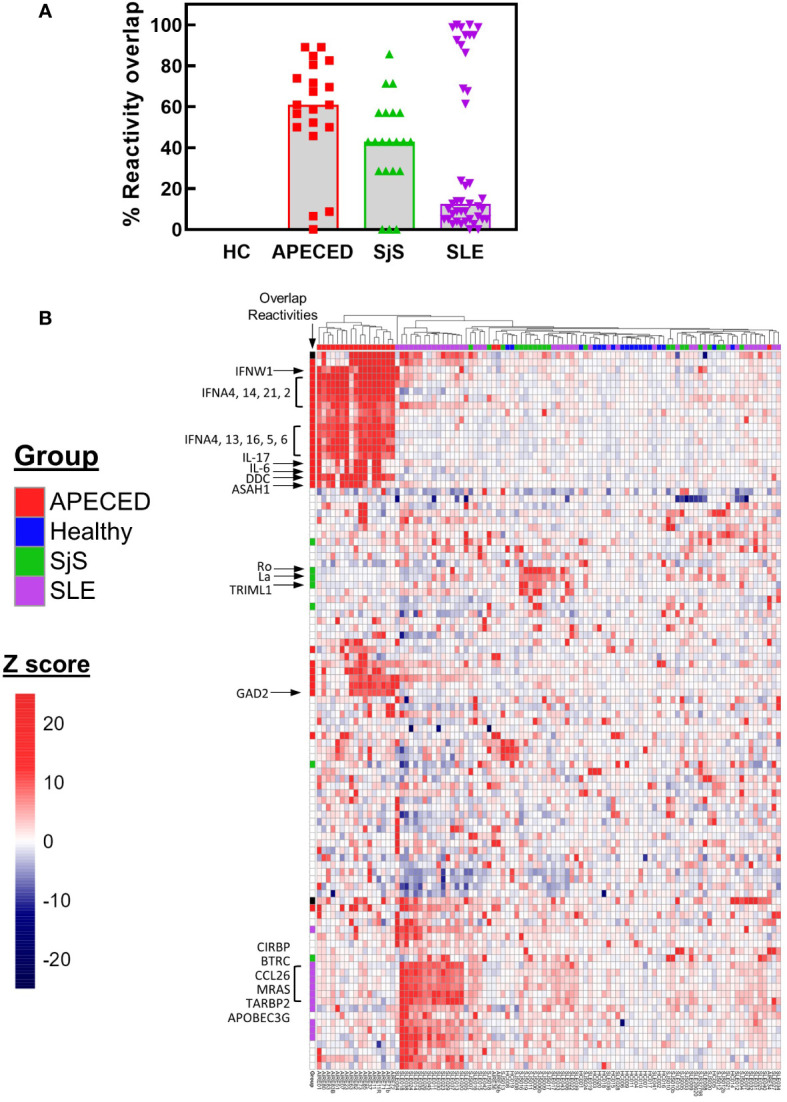
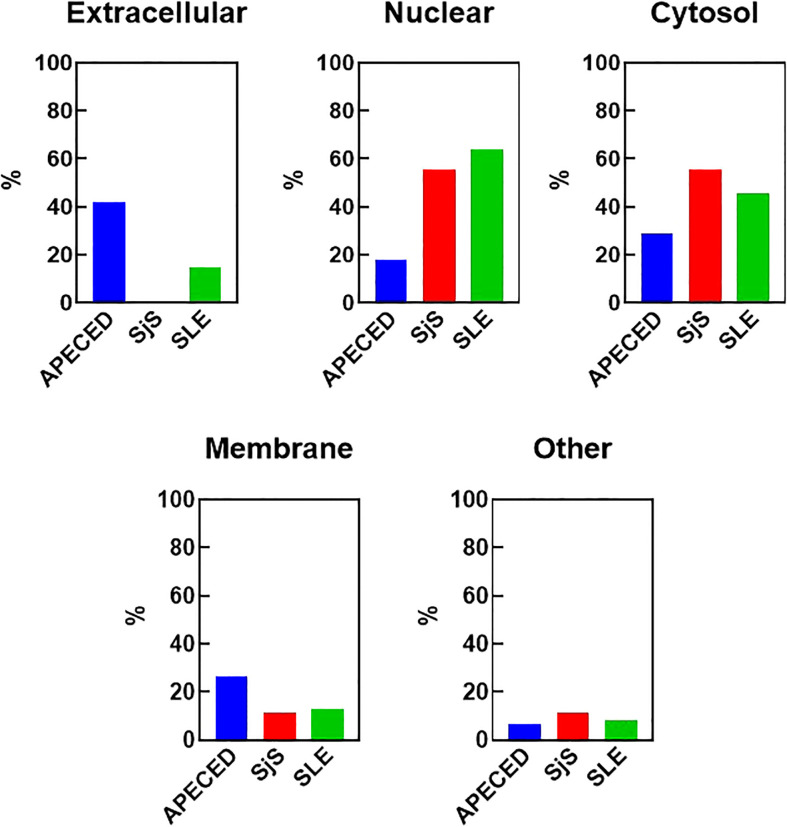
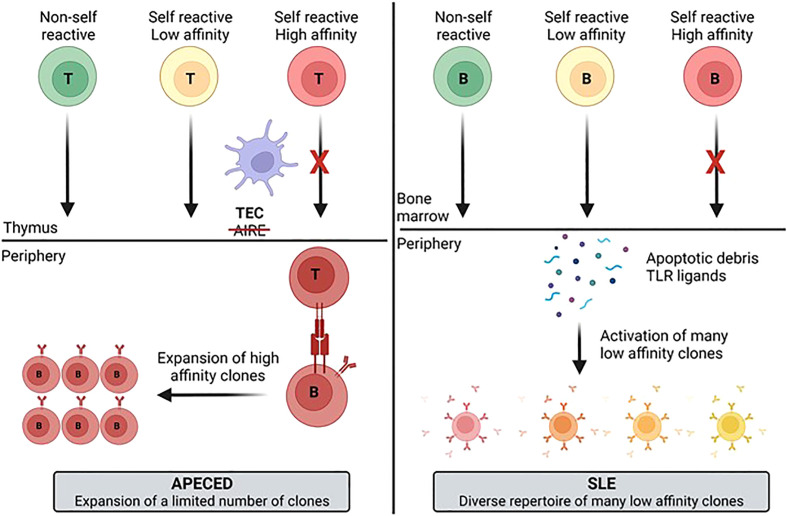
Autoimmune diseases vary in the magnitude and diversity of autoantibody profiles, and these differences may be a consequence of different types of breaks in tolerance. Here, we compared the disparate autoimmune diseases autoimmune polyendocrinopathy-candidiasis-ecto-dermal dystrophy (APECED), systemic lupus erythematosus (SLE), and Sjogren's syndrome (SjS) to gain insight into the etiology of breaks in tolerance triggering autoimmunity. APECED was chosen as a prototypical monogenic disease with organ-specific pathology while SjS and SLE represent polygenic autoimmunity with focal or systemic disease. Using protein microarrays for autoantibody profiling, we found that APECED patients develop a focused but highly reactive set of shared mostly anti-cytokine antibodies, while SLE patients develop broad and less expanded autoantibody repertoires against mostly intracellular autoantigens. SjS patients had few autoantibody specificities with the highest shared reactivities observed against Ro-52 and La. RNA-seq B-cell receptor analysis revealed that APECED samples have fewer, but highly expanded, clonotypes compared with SLE samples containing a diverse, but less clonally expanded, B-cell receptor repertoire. Based on these data, we propose a model whereby the presence of autoreactive T-cells in APECED allows T-dependent B-cell responses against autoantigens, while SLE is driven by breaks in peripheral B-cell tolerance and extrafollicular B-cell activation. These results highlight differences in the autoimmunity observed in several monogenic and polygenic disorders and may be generalizable to other autoimmune diseases.

Keywords: B cell receptor (BCR); Sjogren's syndrome; autoantibody; autoimmune disease (AD); autoimmune polyendocrinopathy candidiasis ecotodermal dystrophy (APECED); systemic lupus erythematosus (SLE).


Conflict of interest statement

TC, PD, SK, SO, MS, QA, JZ, ET, JV, JD, AB are/have been employees of EMD Serono, Billerica MA, USA or Merck KGaA, Darmstadt, Germany. The remaining authors declare that the research was conducted in the absence of any commercial or financial relationships that could be constructed as a potential conflict of interest. The authors declare that this study received funding from EMD Serono Inc and Merck KGaA. The funders were involved in the study design, collection, analysis, interpretation of data, the writing of this article and the decision to submit it for publication.

Figures

Figure 1
Figure 1
ProtoArray analysis of autoimmune patients reveals that autoantibody repertoires differ in the number of reactivities and their clonality between diseases. Plasma samples from patients and HCs were tested using the human ProtoArray covering 9483 proteins for IgG reactivity. Z scores were calculated to quantify reactivity for patients versus the HC group. (A) The median number of reactivities above a Z score threshold ranging from 1 to 10 were plotted for each group. (B) The number of reactivities with a median Z score >5 are plotted for each group. (C) The median Z score is plotted for each subject and also (D) for only reactivities with a Z score >5. (E) The top 4000 reactivities for each group are plotted ranked by highest Z score with the Z score for each reactivity on the Y axis. (F) A PCA plot was constructed of all subjects based on the ProtoArray data. (**significantly different from HC ANOVA p<0.01). HCs, healthy controls; IgG, immunoglobulin G; PCA, principal component analysis.
Figure 2
Figure 2
Identification of the most significantly elevated autoantibodies. Volcano plots were constructed based on the ProtoArray data for the APECED (A), SjS (B), and SLE (C) patient groups. Dotted lines define reactivities with a Z scores >1 and a p value of <0.05 (t test) compared with the HC group. Notable reactivities are labeled. Bar charts show the 10 reactivities that were significantly different from HCs (p<0.05) with the largest Z scores for each disease. APECED, autoimmune polyendocrinopathy–candidiasis–ecto-dermal dystrophy; SLE, systemic lupus erythematosus; SjS, Sjogren’s syndrome.
Figure 3
Figure 3
ProtoArray analysis of autoimmune patients reveals that autoantibody repertoires differ in the number of reactivities within and between groups. (A) The amount of overlap in the ProtoArray reactivity for each subject with other subjects in each group is shown. Overlap was considered for common reactivities with a Z >5 in 30% of the subjects for each group. (B) The highest 100 reactivities by variance are presented in a hierarchal clustered heat map. The heat map is colored by Z score and each column represents an individual subject with the group identified by the color bar above the column. Several key canonical reactivities are identified with arrows. Markings in the column labeled ‘Overlap’ identify which reactivities had a high degree of overlap for each group (Z >5 in 30% of the subjects for each group). APECED, autoimmune polyendocrinopathy–candidiasis–ecto-dermal dystrophy; HC, healthy control; SLE, systemic lupus erythematosus; SjS, Sjogren’s syndrome.
Figure 4
Figure 4
Cellular localization of the reactivities defining the different disease groups. The reactivities changed with a Z-score greater than 5 in at least 30% of the patients for each group were considered to be representative for each disease group. The cellular localization of the different antigens was determined using GO terms and also by manual curation for undefined genes. The percent of the group defining reactivities assigned to each cellular location are graphed. Some antigens have an unknown localization and were classified as “other”. An antigen may have more than one localization. APECED, autoimmune polyendocrinopathy–candidiasis–ecto-dermal dystrophy; SLE, systemic lupus erythematosus; SjS, Sjogren’s syndrome; GO, gene ontology.
Figure 5
Figure 5
RNA-seq gene expression analysis. RNA-seq gene expression analysis was performed on blood samples from HCs, SjS, and SLE subjects. (A) Gene expression data is presented in a heat map as normalized expression to show comparisons for SLE versus HC or SLE ‘cold’ versus SLE ‘hot’. (B, C) Volcano plots were constructed for differential expression comparisons and dotted lines show a Z score cutoff of 0.7 and a p value cutoff of 0.01 and notable gene changes are labeled. HCs, healthy controls; SLE, systemic lupus erythematosus; SjS, Sjogren’s syndrome.
Figure 6
Figure 6
RNA-seq analysis of IFN response gene expression in SLE and SjS patients. RNA-seq analysis was performed on blood samples collected from HCs, SLE, and SjS subjects. (A) Z scores were calculated and a heat map was constructed to show the relative expression of 84 ImSig IFN pathway genes. (B) IFN gene signature scores were calculated using a panel of 9 IFN-regulated genes with the score for each subject represented by a different symbol and lines show the group medians. (**significantly different from HC ANOVA p<0.01). HCs, healthy controls; ImSig, immune cell type-specific gene expression signatures; SLE, systemic lupus erythematosus; SjS, Sjogren’s syndrome.
Figure 7
Figure 7
NGS BCR repertoire analysis of the sequence diversity and clonality of different disease groups. Switched memory B-cells were isolated from peripheral blood and RNA was purified for BCR sequencing. (A) The fraction of all reads for each clonotype were plotted with the clonotypes ranked from most abundant to least abundant for the top 4000 clonotypes. (B) The Gini score was calculated based on the clonotype frequency for each patient and the results are plotted by groups. (C) Clonality was determined for each subject and the R20 values for each subject are presented by group as the fraction of unique clones representing 20% of the sequenced repertoire, so the higher the R20 the less clonal dominance. (**significantly different from HC ANOVA p<0.01). APECED, autoimmune polyendocrinopathy–candidiasis–ecto-dermal dystrophy; BCR, B-cell receptor; HC, healthy control; NGS, next-generation sequencing; SLE, systemic lupus erythematosus; SjS, Sjogren’s syndrome.
Figure 8
Figure 8
Analysis of VH gene family usage and CDR3 length. Switched memory B-cells were isolated from peripheral blood and RNA was purified for BCR sequencing. The relative frequency of VH gene sequences was determined and the mean was plotted for the top 30 most frequent VH genes for each group (A). A Mann Whitney test with p value adjustment to account for multiple testing (FDR) was performed but no significant differences were found between groups for any of the genes. The CDR3 length distribution for all groups is plotted (B) and the mean CDR3 length for each subject was calculated and the group means are presented (C). The number of mutations per VH gene was determined and the mean values are plotted for each individual (D) and the mean for the groups ± SEM (E). A two-sided Mann Whitney U was run and found a significant difference between all the autoimmune groups and the HCs. (** significantly different from HC ANOVA p<0.01). APECED, autoimmune polyendocrinopathy–candidiasis–ecto-dermal dystrophy; BCR, B-cell receptor; CDR3, complementarity determining region 3; HC, healthy control; VH, immunoglobulin heavy chain variable region; SLE, systemic lupus erythematosus; SjS, Sjogren’s syndrome.
Figure 9
Figure 9
Model for development of the autoimmune B-cell repertoire for different diseases. The differences in the diversity and clonotype expansion of the autoimmune repertoire of different diseases may be a function of multiple variables including antigen availability, the presence of PRR ligands that activate B-cells, and T-cell help. These different factors likely contribute to generation of a more focused and clonally expanded repertoire in APECED patients and a more diverse, but less expanded repertoire in SLE patients. APECED, autoimmune polyendocrinopathy–candidiasis–ecto-dermal dystrophy; PRR, pattern recognition receptor; SLE, systemic lupus erythematosus.

Similar articles

Cited by

References

    1. Constantine GM, Lionakis MS. Lessons from primary immunodeficiencies: Autoimmune regulator and autoimmune polyendocrinopathy-candidiasis-ectodermal dystrophy. Immunol Rev (2019) 287(1):103–20. doi: 10.1111/imr.12714 - DOI - PMC - PubMed
    1. Nagamine K, Peterson P, Scott HS, Kudoh J, Minoshima S, Heino M, et al. . Positional cloning of the APECED gene. Nat Genet (1997) 17(4):393–8. doi: 10.1038/ng1297-393 - DOI - PubMed
    1. Finnish-German AC. An autoimmune disease, APECED, caused by mutations in a novel gene featuring two PHD-type zinc-finger domains. Nat Genet (1997) 17(4):399–403. doi: 10.1038/ng1297-399 - DOI - PubMed
    1. Bastard P, Orlova E, Sozaeva L, Levy R, James A, Schmitt MM, et al. . Preexisting autoantibodies to type I IFNs underlie critical COVID-19 pneumonia in patients with APS-1. J Exp Med (2021) 218(7). doi: 10.1084/jem.20210554 - DOI - PMC - PubMed
    1. Bastard P, Rosen LB, Zhang Q, Michailidis E, Hoffmann HH, Zhang Y, et al. . Autoantibodies against type I IFNs in patients with life-threatening COVID-19. Science (2020) 370(6515). doi: 10.1126/science.abd4585 - DOI - PMC - PubMed

Publication types