. 2023 Jan 6;2(2):pgad002.
doi: 10.1093/pnasnexus/pgad002. eCollection 2023 Feb.

Histone deacetylation regulates de novo shoot regeneration

Affiliations

Histone deacetylation regulates de novo shoot regeneration

Haruka Temman et al. PNAS Nexus. .

Abstract

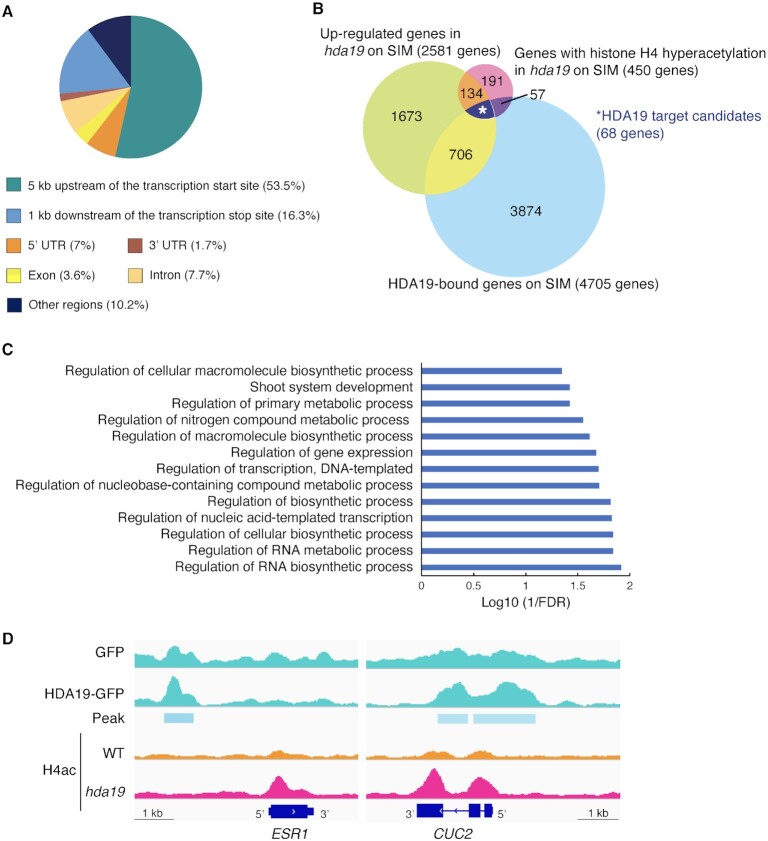
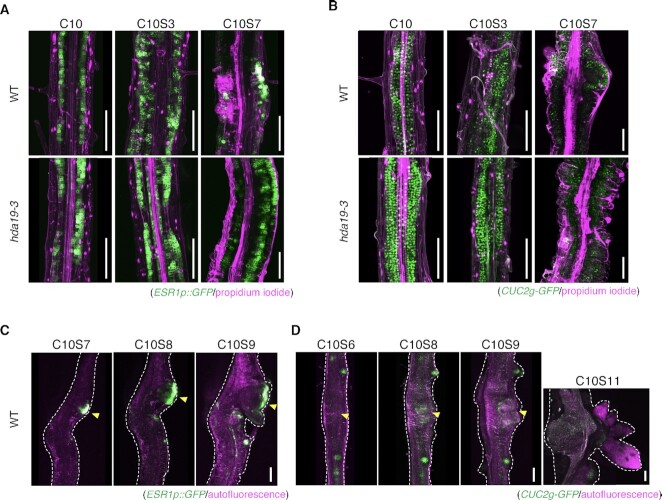
During de novo plant organ regeneration, auxin induction mediates the formation of a pluripotent cell mass called callus, which regenerates shoots upon cytokinin induction. However, molecular mechanisms underlying transdifferentiation remain unknown. Here, we showed that the loss of HDA19, a histone deacetylase (HDAC) family gene, suppresses shoot regeneration. Treatment with an HDAC inhibitor revealed that the activity of this gene is essential for shoot regeneration. Further, we identified target genes whose expression was regulated through HDA19-mediated histone deacetylation during shoot induction and found that ENHANCER OF SHOOT REGENERATION 1 and CUP-SHAPED COTYLEDON 2 play important roles in shoot apical meristem formation. Histones at the loci of these genes were hyperacetylated and markedly upregulated in hda19. Transient ESR1 or CUC2 overexpression impaired shoot regeneration, as observed in hda19. Therefore, HDA19 mediates direct histone deacetylation of CUC2 and ESR1 loci to prevent their overexpression at the early stages of shoot regeneration.

Keywords: epigenetics; histone deacetylation; shoot regeneration; transdifferentiation.


Figures

Fig. 1.
Fig. 1.
Shoot regeneration phenotypes in hda19 and WT under suppressed HDAC activity. (A) Schematic of de novo shoot regeneration. Root tip (0 to 1 cm root explants) were excited from seedlings at 7 days after germination and incubated on CIM for 10 days, followed by SIM for 21 days. Phenotypes were observed at 10 days on CIM, 7 days on SIM, and 21 days on SIM. (B) Gene structure of HDA19 and the sites of T-DNA insertion and T-residue insertion using CRISPR/CAS9. Boxes: exons; bars: introns. (C) Phenotypes of WT, hda19-3, hda19-5, and a complementation line (complement, HDA19p-HDA19g-sGFP in hda19-3) at 10 days on CIM, 7 days on SIM, and 21 days on SIM. Scale bars = 2 mm. Arrow heads: regenerated shoots. (D) Shoot regeneration rate (the ratio of shoot-forming explants to the total explants) in WT, hda19-3, and complement explants at 21 days on SIM. Results are presented as means ± SE of at least three independent experiments (***P < 0.001, Student’s t-test). (E) Phenotypes of WT explants at 7 and 21 days on SIM with 1 μM Ky-2 on CIM and/or SIM. Ky-2 treatment is indicated by magenta letters. Scale bars = 2 mm. Yellow arrowheads indicate regenerated shoots.
Fig. 2.
Fig. 2.
Expression pattern of HDA19 in roots and callus during shoot induction. (A to C) Expression pattern of the HDA19 translational reporter (HDA19p::HDA19g-sGFP, shown in green) in (A) root apical meristem at 7 days after germination (7 DAG), (B) LRP at 11 DAG, and (C) calli at 10 days on CIM (C10) and 3, 7, and 14 days on SIM (C10S3, C10S7, and C10S14, respectively). Cell outlines were visualized using propidium iodide (PI) staining (shown in magenta). Images in (A) and (B) represent a single optical section. Images in (C) represent z-projections. Scale bars = 45 μm. A yellow arrowhead indicates a developing SAM, and red arrowheads indicate leaf primordia.
Fig. 3.
Fig. 3.
Histone acetylation and gene expression levels in hda19 during shoot induction. (A) Histone H3 and acetylated histone H4 levels in hda19 compared with WT at 7 days on SIM. Each black dot represents the square root of the count of mapped reads of all genes. Magenta dots indicate 450 genes with histone H4 hyperacetylation in hda19 compared with WT (q < 0.01, FC > 1.5). (B) Positional profiles of histone H3 and acetylated histone H4 in WT and hda19 on genic region (gene plus 2 kb sequence up- and downstream) of 450 genes with histone H4 hyperacetylation in hda19 on SIM shown in (A). (C) Association between histone acetylation and gene expression level in hda19. Based on differences in histone H4 acetylation level between WT and hda19 [log2(RPM _hda19/RPM_WT)] at 7 days on SIM shown in (A), genes were divided into six groups (x-axis). Gene expression fold-changes between WT and hda19 [log2(RPM_hda19/RPM_WT)] at 7 days on SIM were calculated and plotted for group. (D) Venn diagram of genes with histone H4 hyperacetylation in hda19 on SIM shown in (A) and upregulated genes on SIM in hda19 compared with WT (q < 0.01, FC > 1.5).
Fig. 4.
Fig. 4.
Identification of HDA19 target genes involved in shoot regeneration. (A) Pie chart showing the percentage of gene regions to which HDA19 could bind. HDA19 binding sites were determined using MACS2 peak calling (q < 0.001). A total of 8,823 peaks were analyzed. (B) Venn diagram of genes with histone H4 hyperacetylation in hda19 on SIM (q < 0.01, FC > 1.5), upregulated in hda19 on SIM (q < 0.01, FC > 1.5), bound to HDA19 on SIM [q < 0.001, −log10(P-value) > 20]. Genes that met all conditions were considered HDA19 target candidates. (C) Gene Ontology analysis of HDA19 target candidates (FDR < 0.05). (D) Distribution of acetylated histone H4 and HDA19 binding sites around the ESR1 and CUC2 loci at 7 days on SIM. Blue boxes indicate exons and blue lines indicate introns.
Fig. 5.
Fig. 5.
Effects of ESR1 and CUC2 overexpression on the shoot regeneration phenotype. (A) Shoot regeneration phenotypes of ESR1 conditional overexpression line pER8-ESR1 explants at 7 and 21 days on SIM with 5 μM 17β-estradiol on CIM and/or SIM. 17β-Estradiol treatment is indicated by magenta letters. (B) Shoot regeneration phenotypes of CUC2 conditional overexpression line CUC2g-m4-GR explants at 7 and 21 days on SIM with 1 μM DEX on CIM and/or SIM. DEX treatment is indicated by magenta letters. Shoot rate is the ratio of normal shoot-forming explants to the total explants. Pin rate is the ratio of shoot-forming explants with a pin-like leaf to the total shoot-forming explants. Shoot average is the number of shoots per explant tested. Scale bars = 2 mm. Red and orange arrowheads indicate regenerated shoots and a pin-like leaf, respectively.
Fig. 6.
Fig. 6.
Dynamics of ESR1 and CUC2 expression during shoot induction in hda19. Expression patterns of (A) ESR1p::GFP and (B) CUC2g-GFP during shoot induction in WT and hda19. Time-lapse images of ESR1p::GFP (C) and CUC2g-GFP (D) expression. The same explants were observed at each time point. GFP fluorescence is shown in green, and the outline of PI-stained cells or autofluorescence is shown in magenta. The images represent z-projections. Scale bar = 100 µm. Arrowheads indicate developing SAMs.

References

    1. Ikeuchi M, et al. . 2019. Molecular mechanisms of plant regeneration. Annu Rev Plant Biol. 70:377–406. - PubMed
    1. Gaillochet C, Lohmann JU. 2015. The never-ending story: from pluripotency to plant developmental plasticity. Development. 142:2237–2249. - PMC - PubMed
    1. Skoog F, Miller CO. 1957. Chemical regulation of growth and organ formation in plant tissues cultured in vitro. Symp Soc Exp Biol. 11:118–130. - PubMed
    1. Valvekens D, Montagu MV, Lijsebettens MV. 1988. Agrobacterium tumefaciens-mediated transformation of Arabidopsis thaliana root explants by using kanamycin selection. Proc Natl Acad Sci. 85:5536–5540. - PMC - PubMed
    1. Christianson ML, Warnick DA. 1983. Competence and determination in the process of in vitro shoot organogenesis. Dev Biol. 95:288–293. - PubMed