Review
. 2023 Feb 9:10:1051491.
doi: 10.3389/fmolb.2023.1051491. eCollection 2023.

Companion diagnostic requirements for spatial biology using multiplex immunofluorescence and multispectral imaging

Affiliations
Review

Companion diagnostic requirements for spatial biology using multiplex immunofluorescence and multispectral imaging

Darren Locke et al. Front Mol Biosci. .

Abstract

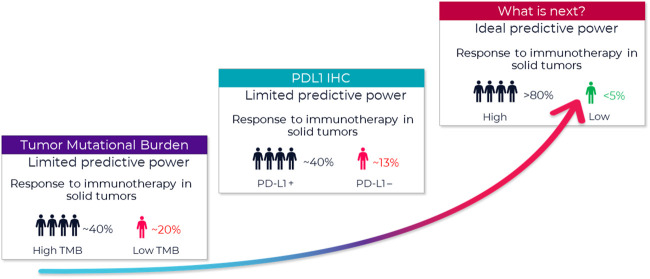
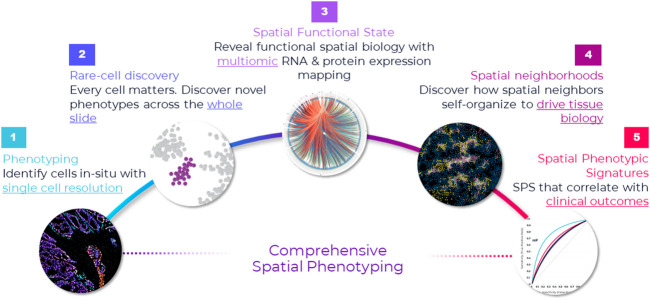
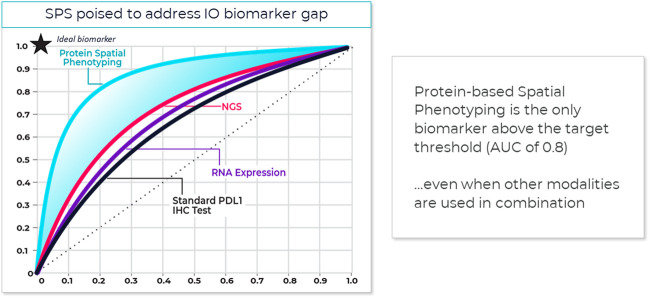
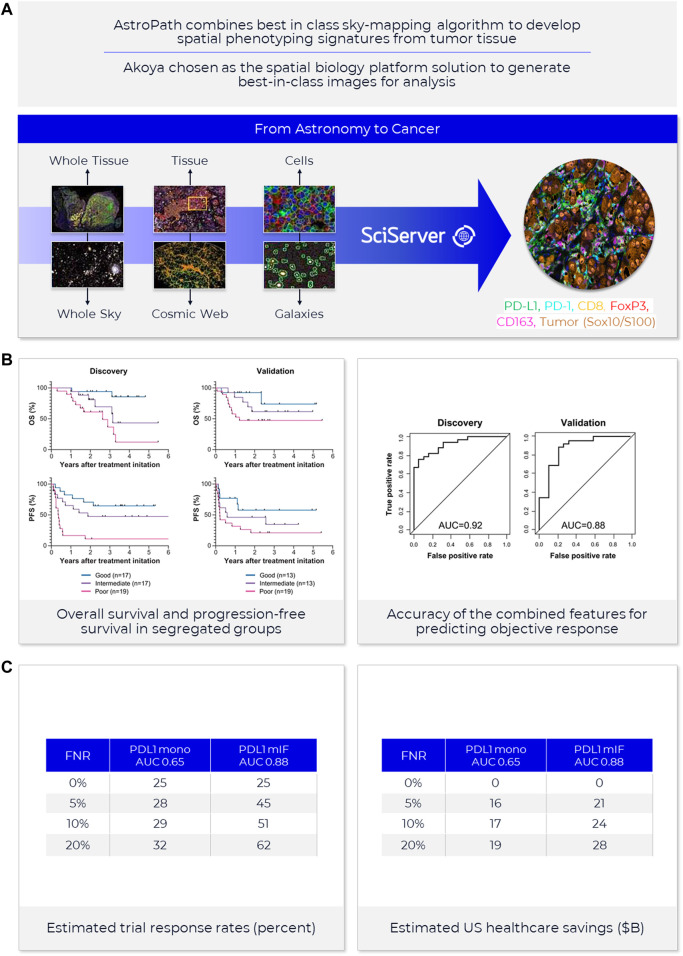
Immunohistochemistry has long been held as the gold standard for understanding the expression patterns of therapeutically relevant proteins to identify prognostic and predictive biomarkers. Patient selection for targeted therapy in oncology has successfully relied upon standard microscopy-based methodologies, such as single-marker brightfield chromogenic immunohistochemistry. As promising as these results are, the analysis of one protein, with few exceptions, no longer provides enough information to draw effective conclusions about the probability of treatment response. More multifaceted scientific queries have driven the development of high-throughput and high-order technologies to interrogate biomarker expression patterns and spatial interactions between cell phenotypes in the tumor microenvironment. Such multi-parameter data analysis has been historically reserved for technologies that lack the spatial context that is provided by immunohistochemistry. Over the past decade, technical developments in multiplex fluorescence immunohistochemistry and discoveries made with improving image data analysis platforms have highlighted the importance of spatial relationships between certain biomarkers in understanding a patient's likelihood to respond to, typically, immune checkpoint inhibitors. At the same time, personalized medicine has instigated changes in both clinical trial design and its conduct in a push to make drug development and cancer treatment more efficient, precise, and economical. Precision medicine in immuno-oncology is being steered by data-driven approaches to gain insight into the tumor and its dynamic interaction with the immune system. This is particularly necessary given the rapid growth in the number of trials involving more than one immune checkpoint drug, and/or using those in combination with conventional cancer treatments. As multiplex methods, like immunofluorescence, push the boundaries of immunohistochemistry, it becomes critical to understand the foundation of this technology and how it can be deployed for use as a regulated test to identify the prospect of response from mono- and combination therapies. To that end, this work will focus on: 1) the scientific, clinical, and economic requirements for developing clinical multiplex immunofluorescence assays; 2) the attributes of the Akoya Phenoptics workflow to support predictive tests, including design principles, verification, and validation needs; 3) regulatory, safety and quality considerations; 4) application of multiplex immunohistochemistry through lab-developed-tests and regulated in vitro diagnostic devices.

Keywords: cell phenotyping; clinical workflow; image analysis; immuno-oncology; multiplex immunofluorescence; phenoptics; predictive biomarker; spatial biology.


Conflict of interest statement

Authors DL and CH are employed by Akoya Biosciences. Both authors are employees of and shareholders in Akoya Biosciences Inc. All claims expressed in this article are solely those of the authors and do not necessarily represent those of their affiliated organizations, or those of the publisher, the editors, and the reviewers. Any product that may be evaluated in this article, or claim that may be made by its manufacturer, is not guaranteed or endorsed by the publisher, the editors, or the reviewers.

Figures

FIGURE 1
FIGURE 1
Growing need to improve prediction of patient response. FDA approved companion diagnostics show limited predictive value. A new type of biomarker with better predictive power is urgently needed. A biomarker with an ideal predictive power (>80% accuracy) remains a critical missing link to identifying appropriate candidates for immunotherapy and tailoring immunotherapy treatment regimens. One of the new promising biomarkers is tumor mutational burden (TMB) (Hendriks et al., 2018), and those tumors with high TMB may respond best to ICIs. Several studies using samples of patients included in clinical trials as well as retrospective series reported ICI outcome for patients in relation to TMB. That said, outcome on ICI can be influenced by several factors. For example, several tumor and patient characteristics appear to influence response to PD-1/PD-L1 inhibitors, and this must be considered when selecting patients for this treatment (Diggs and Hsueh, 2017). With multiple possible treatment options, biomarkers are needed to identify which subgroup of patients is likely to benefit the most from a certain therapy.
FIGURE 2
FIGURE 2
Comprehensive framework for spatial applications. Spatial applications depend on the type of study that the researcher is engaged in. This comprehensive framework captures the continuum of needs across discovery, translational and clinical research. Starting from the far left, the first step in spatial biology is phenotyping cells in situ. In many ways, this is a foundational element in any spatial biology study—map cells with spatial context. This is the starting point, and it requires single-cell resolution. If the goal is to discover novel cell types or rare cells, then it warrants an unbiased approach to discovery—that is, mapping every single cell in the tissue through whole slide imaging. This approach not only provides a macro-level view of the tissue architecture but also a micro-level view into each cell and is necessary for uncovering extremely rare cell types—down to less than <0.1% abundance (e.g., Nguyen et al., 2018). Once cells are phenotyped, they can be mapped to distinct tissue substructures, called cellular neighborhoods, based on spatial interactions and how the cells cluster. Cellular neighborhoods are emerging as a seminal concept in spatial analysis because of their correlation to cancer progression and treatment response (e.g., Schurch et al., 2020). On the translational/clinical side of the spectrum, far right, the goal is discovering spatial biomarker signatures (e.g., Theobald et al., 2018; Badve et al., 2021; Griffin et al., 2021) and establishing their clinical significance, which requires studying large cohorts and a high throughput approach.
FIGURE 3
FIGURE 3
Spatial phenotyping provides the highest predictive value. The standard for comparing the diagnostic accuracy of biomarkers is the receiver operating characteristics (ROC) curve (Nahm, 2022). This is a plot of sensitivity versus 1-specificity across a range of cut points for a biomarker. The plot illustrates how well a model can discriminate or separate the cases and controls. The area under the curve (AUC) has a value between 0.50 and 1.0, with 0.5 indicating no discrimination and with 1.0 indicating perfect discrimination (Simundic, 2009). An excellent biomarker has an AUC of 0.8 or higher. The AUC of the ROC curve reflects the overall accuracy and separation performance of the biomarker (or biomarkers) and can be readily used to compare different biomarker combinations or models (Sanghera et al., 2013).
FIGURE 4
FIGURE 4
AstroPath—astronomy meets pathology, a novel approach to developing SPS that is highly predictive of PD-1 therapy. (A) AstroPath is a sky-mapping algorithm developed at Johns Hopkins University to stitch together millions of images of billions of celestial objects, each expressing distinct signatures. Applying those principles to mIF imaging using Akoya’s spatial biology platform, John Hopkins researchers were able to develop SPS. (B) Using a six-plex (PD-1, PD-L1, CD8, FoxP3, CD163, and Sox10/S100) Akoya mIF panel, the team at John Hopkins University were able to develop 41 combinations of expression patterns and map relatively rare cells. This multifactorial analysis was used to study 10 features for predicting objective response in melanoma patients after immune checkpoint—blocking therapies, ranked in decreasing order of predictive value. Patients could then be assigned to one sof three groups: poor, intermediate, and good prognosis, with characteristic cell co-expression phenotypes detected by the mIF assay. The TME from patients with poor prognosis was characterized by high densities of tumor cells and CD163+ cells that lack PD-L1 expression, irrespective of whether other immune cells were present. The area under the curve (AUC) values were assessed for the 10 features for both the discovery cohort and the validation cohort and showed an excellent accuracy in predicting objective response (AUC of 0.92 and 0.88, respectively) (Berry et al., 2021). (C) AUC implications for trials and healthcare costs, with Build Model based on publicly available data on response rates for leading IO tumor indications. Shown are estimated trial response rates and United States healthcare savings if using PD-L1 monoplex (AUC 0.65—Lu et al., 2019) or PD-L1 mIF (AUC 0.88—Lu et al., 2019) for patient selection with false-negative rates of 0%–20%. Publication copyright for Berry et al., 2021 is governed by a CC BY 4.0 License.
FIGURE 5
FIGURE 5
MITRE: multi-institutional TSA amplified multiplexed immunofluorescence reproducibility evaluation. Before mIF technology can potentially be translated into clinical practice, demonstration of the analytical validity and reproducibility of an end-to-end mIF workflow that supports multisite trials and clinical laboratory processes is vital. In this first multisite study, four leading academic medical centers, one pharma company, and Akoya Biosciences assessed the intersite and intrasite reproducibility of a 6-plex 7-color mIF assay. The results of the study show that the PhenoImager HT is the first spatial biology platform to meet reproducibility requirements for clinical applications (Taube et al., 2021).
FIGURE 6
FIGURE 6
mIF better predicts patient response—lymphoma. (A) Conventional biomarkers fail to predict outcomes in lymphoma (Phillips et al., 2021). (B) Spatial neighborhood analysis identified differences in TME spatial organization in responders vs. non-responders - cellular neighborhoods (CNs) enriched in tumor and dendritic cells (CN-5, purple region, p = 0.0029) and tumor and CD4+ T cells (CN-8, yellow region, p = 0.005) were present at significantly higher frequencies in responders’ post-treatment compared to other groups suggesting a more immune-activated TME observed in responders following pembrolizumab therapy. Treg enriched CN (CN-10, pink region, p = 0.0165 and 0.0085) was present at a significantly higher frequency in non-responders than responders pre- and post-treatment (Phillips et al., 2021). (C) High-plex analysis identified three key cellular neighborhoods with differences in responders vs. non-responders. This data was then focused using the PhenoImager HT to enable greater throughput and direct investigation of the potential utility of a SPS in clinical samples. A lower SPS (CD4+ T cells are closer to tumor cells than Tregs) suggested increased T cell effector activity and higher SPS (iCD4+ T cells are closer to Tregs than tumor cells) suggested increased T cell suppression. Distances between a specific tumor and immune cell types could be employed to identify a predictive biomarker of immunotherapy response (CD4+ cells, tumor cells, and Tregs) (Phillips et al., 2021). Publication copyright for Phillips et al., 2021 is governed by a CC BY 4.0 License.
FIGURE 7
FIGURE 7
mIF better predicts patient response—HNSCC. (A) Immune cell infiltrate densities at the tumor invasive margin are insufficient to predict favorable overall survival (OS) for oral squamous cell cancer patients. CD8+, FoxP3+, and PD-L1+ cell densities on both the tumor and stromal sides of the invasive margin were examined. Although higher densities CD8+ T cell showed some prognostic value, sufficient classification was lacking (Feng et al., 2017). (B) A positive correlation between an increased number of Tregs (FoxP3+) and CD8+ T cell infiltrates was observed; authors postulated that Tregs might not be close enough to the CD8+ T cells to suppress their effector function. In response, they developed a “Suppression Index.” This index reflected the number of FoxP3+ and PD-L1+ cells within a 3 “lymphocyte wide” or a 30 μm distance around CD8+ T cells. Using this index, patients were ranked for number of PD-L1+ and FoxP3+ cells within 30 μm distance around CD8+ T cells. Patients who were ranked in the top 50% for both PD-L1+ and FoxP3+ cells had a high suppression index with a low overall survival while those that did not rank in the top 50% for either PD-L1+ and FoxP3+ cells had a low suppression index and a high overall survival rate (Feng et al., 2017). (C) Analysis of the entire cohort demonstrates that by combining the suppressive index of both the stromal and tumor side of the invasive margin provides a cumulative suppressive index scoring system that better stratifies patients than conventional IHC. Multiplex IF plus spatial analysis of the proximity of FoxP3+ and PD-L1+ to CD8+ cells lead to a highly significant stepwise reduction of overall survival based on an increasing cumulative suppressive index and the development of a highly indicative prognostic marker superior to the prognostic index of the single markers (Feng et al., 2017). Publication copyright for Feng et al., 2017 is governed by a CC BY 4.0 License.
FIGURE 8
FIGURE 8
Example order-to-result mIF workflow. This schematic represents one example of a complete deployable mIF lab process, showing the multiplicity of steps inherent within the process from sample-to-result and some of the factors that can impact the outcome that might be considered outside the mIF technical process. Lab workflow comprises a series of individual layers/solutions that respect and exploit the unique characteristics and needs for each operation; no two labs are the same, so specific workload processes and loads may be different, and components of this end-to-end process may also be facility-specific (e.g., autostainer and scanner, digital pathology software, overarching LIMs and CRM).

References

    1. Aeffner F., Zarella M. D., Buchbinder N., Bui M. M., Goodman M. R., Hartman D. J., et al. (2019). Introduction to digital image analysis in whole-slide imaging: A white paper from the digital pathology association. J. Pathol. Inf. 10, 9. 10.4103/jpi.jpi_82_18 - DOI - PMC - PubMed
    1. Atha D. H., Manne U., Grizzle W. E., Wagner P. D., Srivastava S., Reipa V. (2010). Standards for immunohistochemical imaging: A protein reference device for biomarker quantitation. J. Histochem Cytochem 58 (11), 1005–1014. 10.1369/jhc.2010.956342 - DOI - PMC - PubMed
    1. Badve S. S., Cho S., Gokmen-Polar Y., Sui Y., Chadwick C., McDonough E., et al. (2021). Multi-protein spatial signatures in ductal carcinoma in situ (DCIS) of breast. Br. J. Cancer 124 (6), 1150–1159. 10.1038/s41416-020-01216-6 - DOI - PMC - PubMed
    1. Baharlou H., Canete N. P., Bertram K. M., Sandgren K. J., Cunningham A. L., Harman A. N., et al. (2021). AFid: A tool for automated identification and exclusion of autofluorescent objects from microscopy images. Bioinformatics 37 (4), 559–567. 10.1093/bioinformatics/btaa780 - DOI - PubMed
    1. Baker M. (2015). Reproducibility crisis: Blame it on the antibodies. Nature 521 (7552), 274–276. 10.1038/521274a - DOI - PubMed