. 2021:9:684196.
doi: 10.3389/fphy.2021.684196. Epub 2021 Jul 28.

A review of recent and emerging approaches for the clinical application of Cerenkov luminescence imaging

Affiliations

A review of recent and emerging approaches for the clinical application of Cerenkov luminescence imaging

Benedict Mc Larney et al. Front Phys. 2021.

Abstract

Cerenkov luminescence (CL) is a blue-weighted emission of light produced by a vast array of clinically approved radioisotopes and LINAC accelerators. When β particles (emitted during the decay of radioisotopes) are present in a medium such as water or tissue, they are able to travel faster than the speed of light in that medium and in doing so polarize the molecules around them. Once the particle has left the local area, the polarized molecules relax and return to their baseline state releasing the additional energy as light (luminescence). This blue glow has commonly been used to determine the output of nuclear power plant cores and, in recent years, has found traction in the preclinical and clinical imaging field. This brief review will discuss the technology which has enabled the emergence of the biomedical Cerenkov imaging field, recent pre-clinical studies with potential clinical translation of Cerenkov luminescence imaging (CLI) and the current clinical implementations of the method. Finally, an outlook is given as to the direction in which the field is heading.

Keywords: Cerenkov; Cherenkov; clinical; dosimetry; image-guided; preclinical; review; surgery.


Conflict of interest statement

9Conflict of interest The authors declare that the research was conducted in the absence of any commercial or financial relationships that could be construed as a potential conflict of interest.

Figures

Figure 1.
Figure 1.. The process in which Cerenkov luminescence is generated.
(I) Top, the particle travelling at a velocity faster than light in the dielectric medium e.g. water or tissue polarizes the surrounding molecules in the medium. Bottom, once the particle has passed, molecules return to their ground state and release blue weighted light (CL, blue wavy lines). (II) The produced waves are coherent in nature travelling as a wavefront of light in the same direction as the particles travel at a forward angle theta. Reproduced with permission from [14], © 2017 Springer Nature Limited.
Figure 2.
Figure 2.. The energy limits for β particles to produce CL and the corresponding CL spectrum.
(I) The refractive index has a direct effect on the kinetic energy required for a β particle to produce CL. This example assumes a β particle with a kinetic energy of 0.511 MeV. (II) The CL spectrum is blue weighted with the amount of light produced corresponding to the wavelength and path length. Representative of a particle with charge e and B = 0.9 in a dielectric medium with a refractive index of 1.4. Reproduced with permission under creative commons license (4.0) from [11], © Ciarrocchi et al. 2017, BioMed Central Ltd.
Figure 3.
Figure 3.. Preclinical applications of CLI.
(I) CLI is used to determine the specificity of antibody-based targeting over time of 64Cu-NODAGA-PSMA-IgG (top) or 64Cu-NODAGA-PSMA-Mb (bottom). PSMA positive tumors are on the RHS with PSMA negative tumors on the LHS. Reproduced with permission from [23], © 2017 SNMMI. (II) CLI can readily act as a complementary modality to PET, NIRF and Β imaging. Reproduced with permission from [42] under Creative Commons Licence, © Lee et al. 2019.
Figure 4.
Figure 4.. Clinical screening implementations of CLI.
(I) (a) CLI of the thyroid gland in a patient 24 hours post 131I administration. (b) Overlaying the CL image and the anatomical white light image reveal the CL image is well correlated with the anatomy and expected location of radioactivity uptake. Color scale is in arbitrary units. Reproduced with permission from [43] under creative commons licence, © Spinelli et al., 2013 . (II) CL images along with corresponding PET/CT images from the same patient. (A, B) CL images of ipsi- and contralateral axillae. (C, D) The low CL signal from 18F-FDG negative lymph node and the high CL signal from the 18F-FDG positive lymph node. Both CL images are overlaid on the white light anatomical image. E, CL images are confirmed by the PET/CT scan. For clinical screening images are always taken in an enclosure devoid of ambient light (complete darkness). Reproduced with permission from [10], © 2014 SNMMI.
Figure 5.
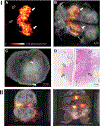
Figure 5.. Intraoperative assessment of tumor resection boundaries in patients undergoing breast-conserving surgery and radical prostatectomy.
(I) (A) Cerenkov image of wide local excision of a grade 3, estrogen receptor–negative/human epidermal growth factor receptor 2–negative carcinoma. Filled white arrows indicate increased Cerenkov signal from the tumor, while outlined arrows indicate non-specific phosphorescent signal. (B) Gray-scale photographic image overlaid with the Cerenkov image. Blue lines mark the 2 mm posterior margin, while green lines mark the 5 mm medial margin. (C) Specimen radiography image. (D) Histopathology image from two pathology slides where the posterior margin is visible at the bottom of image. Open arrows highlight the primary tumor. Reproduced from with permission from [45], © 2017 SNMMI. (II) CL images are overlaid onto grey-scale photography images of prostate gland specimens from two patients. Incisions are marked by dotted lines. Dark and light blue marked regions of interest (ROIs) are used for background determination in the images. The pink and green ROIs highlight the increased CL signal that was correlated with histopathology to be cancerous. The orange ROI shows a non-cancerous area with increased CL signal. Reproduced with permission from [49], © 2020 SNMMI.
Figure 6.
Figure 6.. Clinical dosimetry monitoring with CLI.
(I) The patient setup for dosimetry measurement with CLI during breast radiotherapy. The CLI camera is synced to the pulses of the LINAC to remove ambient light. Optical surface guidance systems aid in alignment of the patient prior to and tracking during treatment. Reproduced with permission under creative commons 4.0 from [59], © Hachadorian et al., 2017, Springer Nature Ltd. (II) A-C Cumulative CLI images of CL generated in the eye as a patient undergoes radiation therapy. D displays the planned cumulative dose (color) overlaid on a sample CT slice (grayscale). Reproduced with permission from [56] under creative commons licence 4.0, © Tendler et al., 2020. (III) Representative CLI images of three patients undergoing TSET as they progress through the six standard Stanford technique positions. Reproduced from with permission from [57], © 2016, American Association of Physicists in Medicine, John Wiley & Sons. (IV) Images captured using the setup in (I) representing the uncorrected, estimated dose and corrected CLI images from both RPO and LAO 6 MV beams from breast radiotherapy. Reproduced with permission under creative commons 4.0 from [59], © Hachadorian et al., 2017, Springer Nature Ltd.

Similar articles

Cited by

References

    1. Curie M, Curie P, and Bemont G, Another new radio-active element. CR, 1898. 127: p. 1215–1217.
    1. Čerenkov P. Visible light from pure liquids under the impact of γ-rays. in CR (Dokl.) Acad. Sci. URSS. 1934.
    1. Tamm I. and Frank I. Coherent radiation of fast electrons in a medium. in Dokl. Akad. Nauk SSSR. 1937.
    1. Arkani M. and Gharib M, Reactor core power measurement using Cherenkov radiation and its application in Tehran Research Reactor. Annals of Nuclear Energy, 2009. 36(7): p. 896–900.
    1. Robertson R, et al., Optical imaging of Cerenkov light generation from positron-emitting radiotracers. Physics in medicine & biology, 2009. 54(16): p. N355. - PMC - PubMed

LinkOut - more resources