

Mendelian randomization reveals no associations of genetically-predicted obstructive sleep apnea with the risk of type 2 diabetes, nonalcoholic fatty liver disease, and coronary heart disease
- PMID: 36846222
- PMCID: PMC9949721
- DOI: 10.3389/fpsyt.2023.1068756
Mendelian randomization reveals no associations of genetically-predicted obstructive sleep apnea with the risk of type 2 diabetes, nonalcoholic fatty liver disease, and coronary heart disease
Abstract
Background: Obstructive sleep apnea (OSA) has been reported to affect cardiometabolic diseases. However, whether such association is causal is still unknown. Here, we attempt to explore the effect of OSA on type 2 diabetes (T2D), nonalcoholic fatty liver disease (NAFLD) and coronary heart disease (CHD).
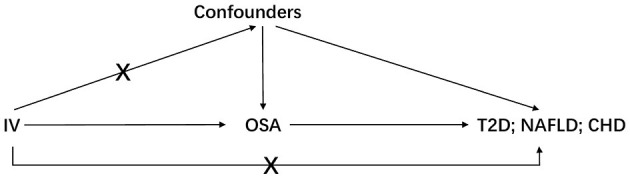
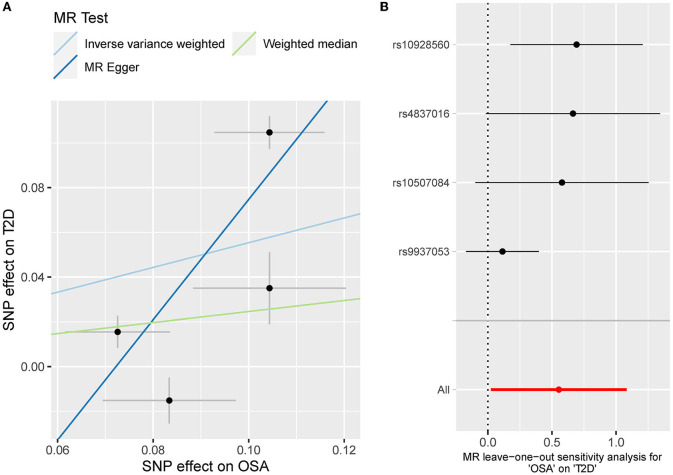
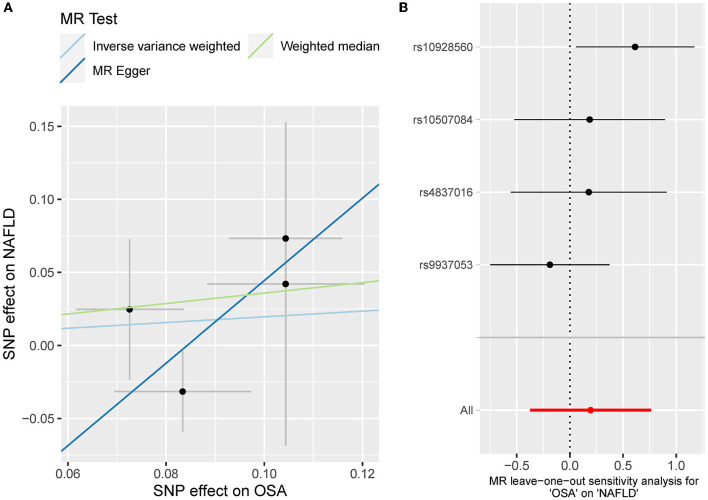
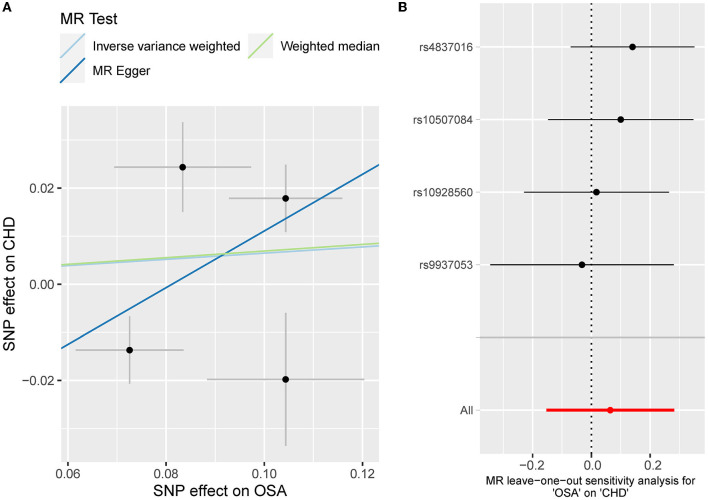
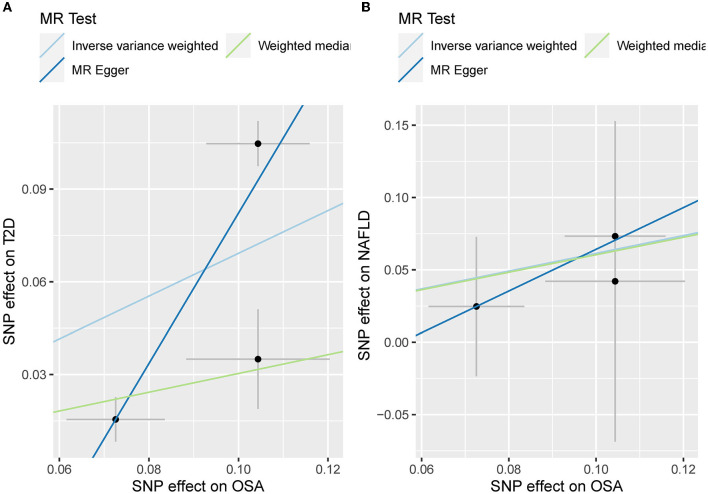
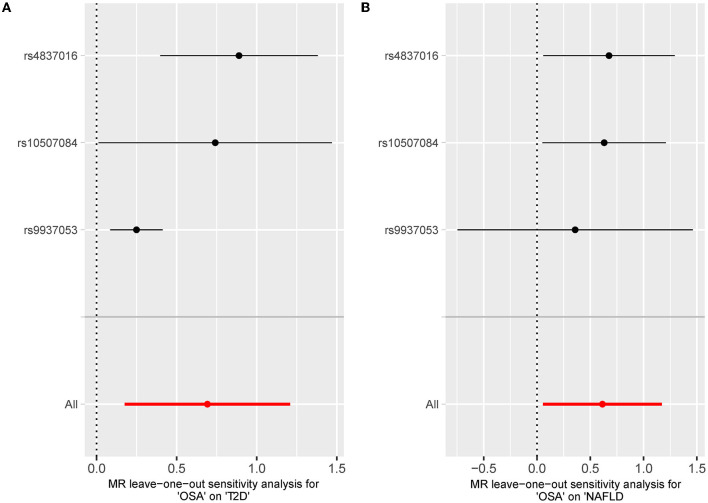
Methods: Genetic variants associated with OSA were requested from a published genome-wide association study (GWAS) and those qualified ones were selected as instrumental variables (IV). Then, the IV-outcome associations were acquired from T2D, NAFLD and CHD GWAS consortia separately. The Mendelian randomization (MR) was designed to estimate the associations of genetically-predicted OSA on T2D, NAFLD and CHD respectively, using the inverse-variance weighted (IVW) method. We applied the Bonferroni method to adjust the p-value. Besides, MR-Egger regression and weighted median methods were adopted as a supplement to IVW. The Cochran's Q value was used to evaluate heterogeneity and the MR-Egger intercept was utilized to assess horizontal pleiotropy, together with MR-PRESSO. The leave-one-out sensitivity analysis was carried out as well.
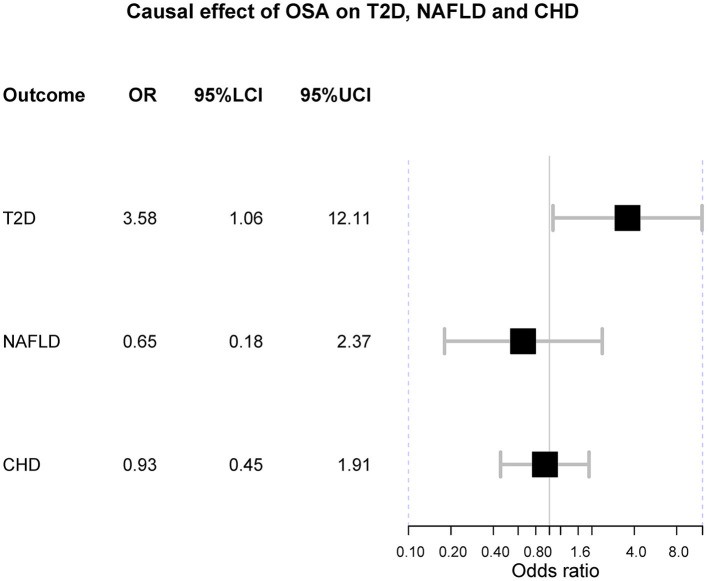
Results: No MR estimate reached the Bonferroni threshold (p < 0.017). Although the odds ratio of T2D was 3.58 (95% confidence interval (CI) [1.06, 12.11], IVW-p-value = 0.040) using 4 SNPs, such causal association turned insignificant after the removal of SNP rs9937053 located in FTO [OR = 1.30 [0.68, 2.50], IVW p = 0.432]. Besides, we did not find that the predisposition to OSA was associated with CHD [OR = 1.16 [0.70, 1.91], IVW p = 0.560] using 4 SNPs.
Conclusion: This MR study reveals that genetic liability to OSA might not be associated with the risk of T2D after the removal of obesity-related instruments. Besides, no causal association was observed between NAFLD and CHD. Further studies should be carried out to verify our findings.
Keywords: Mendelian randomization; cardiometabolic diseases; causal inference; obstructive sleep apnea; type 2 diabetes.
Copyright © 2023 Ding, Zhao, Cui, Qi and Chen.
Conflict of interest statement
The authors declare that the research was conducted in the absence of any commercial or financial relationships that could be construed as a potential conflict of interest.
Figures
Similar articles
-
The Causal Relationship Between Opioid Use and Obstructive Sleep Apnea: A Bidirectional Mendelian Randomization Study.Pain Physician. 2025 Mar;28(2):E147-E156. Pain Physician. 2025. PMID: 40168564
-
Genetic causal relationship between age at menarche and benign oesophageal neoplasia identified by a Mendelian randomization study.Front Endocrinol (Lausanne). 2023 Mar 21;14:1113765. doi: 10.3389/fendo.2023.1113765. eCollection 2023. Front Endocrinol (Lausanne). 2023. PMID: 37025412 Free PMC article.
-
The genetic causal relationship between type 2 diabetes, glycemic traits and venous thromboembolism, deep vein thrombosis, pulmonary embolism: a two-sample Mendelian randomization study.Thromb J. 2024 Mar 29;22(1):33. doi: 10.1186/s12959-024-00600-z. Thromb J. 2024. PMID: 38553747 Free PMC article.
-
Monounsaturated Fatty Acid Levels May Not Affect Cardiovascular Events: Results From a Mendelian Randomization Analysis.Front Nutr. 2020 Sep 2;7:123. doi: 10.3389/fnut.2020.00123. eCollection 2020. Front Nutr. 2020. PMID: 32984395 Free PMC article.
-
Homocysteine, folate, and nonalcoholic fatty liver disease: a systematic review with meta-analysis and Mendelian randomization investigation.Am J Clin Nutr. 2022 Dec 19;116(6):1595-1609. doi: 10.1093/ajcn/nqac285. Am J Clin Nutr. 2022. PMID: 36205540
Cited by
-
Association Between Obstructive Sleep Apnea and Non-Alcoholic Fatty Liver Disease: Epidemiological Cross-Sectional Study and Mendelian Randomization Analysis.Nat Sci Sleep. 2025 Jun 17;17:1361-1376. doi: 10.2147/NSS.S524675. eCollection 2025. Nat Sci Sleep. 2025. PMID: 40547339 Free PMC article.
-
Causal Associations of Sleep Apnea With Alzheimer Disease and Cardiovascular Disease: A Bidirectional Mendelian Randomization Analysis.J Am Heart Assoc. 2024 Sep 17;13(18):e033850. doi: 10.1161/JAHA.123.033850. Epub 2024 Sep 11. J Am Heart Assoc. 2024. PMID: 39258525 Free PMC article.
-
Obstructive sleep apnea mediates genetic risk of Diabetes Mellitus: The Hispanic Community Health Study/Study of Latinos.medRxiv [Preprint]. 2024 Sep 10:2024.09.10.24313336. doi: 10.1101/2024.09.10.24313336. medRxiv. 2024. PMID: 39314966 Free PMC article. Preprint.
-
Associations Between Obstructive Sleep Apnea and Metabolic Dysfunction-Associated Fatty Liver Disease: Insights from Comprehensive Mendelian Randomization and Gene Expression Analysis.Nat Sci Sleep. 2025 Jul 8;17:1571-1585. doi: 10.2147/NSS.S511115. eCollection 2025. Nat Sci Sleep. 2025. PMID: 40655952 Free PMC article.
-
Bidirectional Mendelian Randomization to Elucidate the Relationship Between Healthy Sleep, Brains, and Hearts.J Am Heart Assoc. 2024 Sep 17;13(18):e037394. doi: 10.1161/JAHA.124.037394. Epub 2024 Sep 11. J Am Heart Assoc. 2024. PMID: 39258560 Free PMC article. No abstract available.
References
LinkOut - more resources
Full Text Sources