. 2023 Feb 8:10:1039931.
doi: 10.3389/fvets.2023.1039931. eCollection 2023.

Fecal identification markers impact the feline fecal microbiota

Affiliations

Fecal identification markers impact the feline fecal microbiota

Nora Jean Nealon et al. Front Vet Sci. .

Abstract

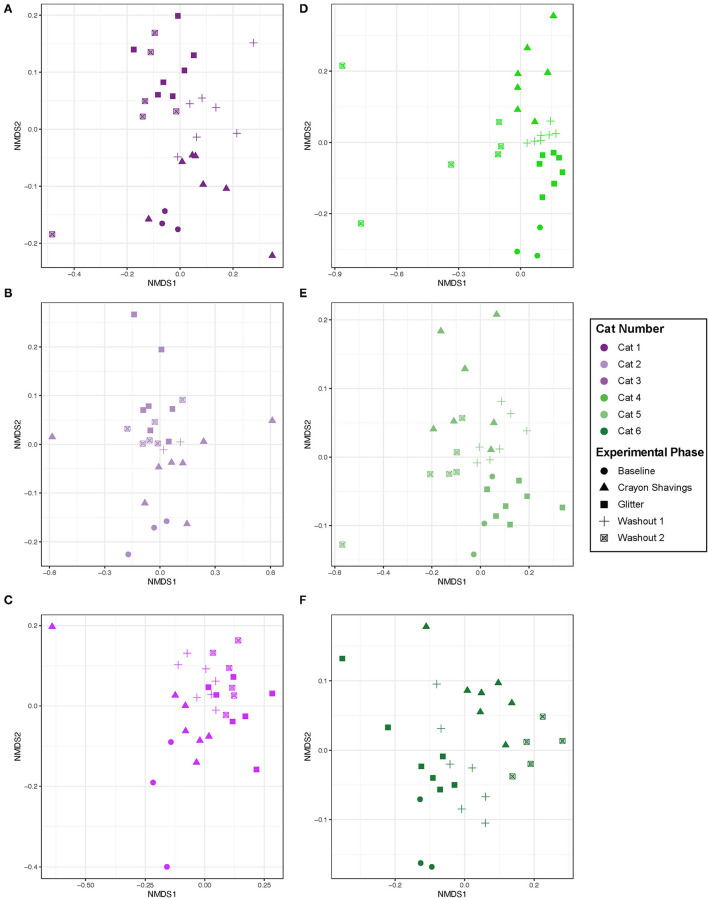
Fecal diagnostics are a mainstay of feline medicine, and fecal identification markers help to distinguish individuals in a multi-cat environment. However, the impact of identification markers on the fecal microbiota are unknown. Given the increased interest in using microbiota endpoints to inform diagnosis and treatment, the objective of this study was to examine the effects of orally supplemented glitter and crayon shavings on the feline fecal microbiota (amplicon sequencing of 16S rRNA gene V4 region). Fecal samples were collected daily from six adult cats that were randomized to receive oral supplementation with either glitter or crayon for two weeks, with a two-week washout before receiving the second marker. No adverse effects in response to marker supplementation were seen for any cat, and both markers were readily identifiable in the feces. Microbiota analysis revealed idiosyncratic responses to fecal markers, where changes in community structure in response to glitter or crayon could not be readily discerned. Given these findings, it is not recommended to administered glitter or crayon shavings as a fecal marker when microbiome endpoints are used, however their clinical use with other diagnostics should still be considered.

Keywords: 16S rRNA; amplicon sequencing; fecal marker; fecal microbiota; fecal sample; feline microbiota; veterinary medicine.


Conflict of interest statement

The authors declare that the research was conducted in the absence of any commercial or financial relationships that could be construed as a potential conflict of interest.

Figures

Figure 1
Figure 1
Experimental Timeline. Cats were randomly assigned to one of two groups, who would receive oral administration of crayon shavings during M1 followed by glitter during M2 (group CG, cats 1–3; denoted in purple) or glitter followed by crayon shavings administration (group GC, cats 4–6, denoted in green), with three cats in each group. B, Baseline; M1, Marker 1; W1, Washout 1; M2, Marker 2; W2, Washout 2.
Figure 2
Figure 2
There was no significant difference in weight or fecal scores with oral administration of fecal identification markers. (A) Mean percent change body weight and standard deviation and (B) mean fecal score and standard deviation over 56-day experiment. Points represent the mean value for group GC and group CG at each day weight and/or fecal scores were measured. Dotted lines bordering each shaded region represent the standard deviation. Statistical significance was determined using a linear mixed effect model for body weight changes and a Mann-Whitney test for fecal score changes when comparing marker order treatment groups [i.e., glitter then crayon (group GC) vs. crayon then glitter (group CG) at each experimental phase]. Significance was defined as p < 0.05 for both analyses following Bonferroni multiple comparisons correction (body weights) and a Benjamini-Hochberg correction (fecal scores). (C) Crayon shavings (red) and glitter (blue) were readily visible in cat feces (denoted by blue arrow).
Figure 3
Figure 3
Alpha diversity metrics did not significantly differ between treatment groups during any study day. Three alpha diversity metrics were calculated for each fecal sample. (A) Shannon diversity index, (B) Observed number of Amplicon Sequencing Variants (ASVs), and (C) Inverse simpson diversity index. Statistical significance was determined using a Mann-Whitney test to compare treatment groups [i.e., glitter then crayon (GC group) vs. crayon then glitter (CG group)] at each study day. Significance was defined as p < 0.05 for both analyses following a Benjamini-Hochberg correction. Points represent the mean score for each day, and the dotted lines bordering each shaded region represent the standard deviation.
Figure 4
Figure 4
Fecal sample microbiota compositions cluster by individual cats. NMDS ordination was calculated with Bray-Curtis dissimilarity algorithm on ASVs from fecal samples. Statistical significance of microbial community structure between all cats was determined with pairwise PERMANOVA analysis with a Benjamini-Hochberg post-hoc correction. Each point represents an individual fecal sample from one cat. CG group is denoted in purple (Cats 1, 2, and 3). GC group is denoted in green (Cats 4, 5, and 6). Experimental phase is represented by a different symbol as denoted in the legend.
Figure 5
Figure 5
Microbial community structure was altered between experimental phases in an idiosyncratic pattern. NMDS ordination was calculated with Bray-Curtis dissimilarity algorithm on ASVs from fecal samples. Statistical significance of microbial community structure across experimental phase for each cat was determined with pairwise PERMANOVA analysis with a Benjamini-Hochberg post-hoc correction. Cat 6 had a single outlier (day 43 during W2 when hairball vomiting reported) that was removed from the NMDS plot to allow for better visualization of data. Each point represents an individual fecal sample from one cat. CG group is denoted in purple [Cats 1, 2, and 3; plots (A–C), respectively]. GC group is denoted in green [Cats 4, 5, and 6; plots (D–F), respectively]. Experimental phase is represented by a different symbol as denoted in the legend.
Figure 6
Figure 6
Cat-dependent shifts in phyla relative abundances occurred across all experimental phases. The composition of the fecal microbiota was visualized with bar plots of the phylum relative abundance for each cat (n = 3 per treatment group). CG group is denoted in purple [Cats 1, 2, and 3; bar plots (A–C), respectively]. GC group is denoted in green [Cats 4, 5, and 6; bar plots (D–F), respectively]. Days without data indicate that no feces were collected from overnight separation.
Figure 7
Figure 7
Cat-dependent shifts in family relative abundances occurred across all experimental phases. The composition of the fecal microbiota was visualized with bar plots of the family relative abundance for each cat (n = 3 per treatment group). CG group is denoted in purple [Cats 1, 2, and 3; bar plots (A–C), respectively]. GC group is denoted in green [Cats 4, 5, and 6; bar plots (D–F), respectively]. Days without data indicate that no feces were collected from overnight separation.

References

    1. Lund EM, Armstrong PJ, Kirk CA, Kolar LM, Klausner JS. Health status and population characteristics of dogs and cats examined at private veterinary practices in the United States. J Am Vet Med Assoc. (1999) 214:1336–41. - PubMed
    1. Lyu Y, Su C, Verbrugghe A, Van de Wiele T, Martinez-Caja AM, Hesta M. Past, present, and future of gastrointestinal microbiota research in cats. Front Microbiol. (2020) 11:1661. 10.3389/fmicb.2020.01661 - DOI - PMC - PubMed
    1. Suchodolski JS. Intestinal microbiota of dogs and cats: a bigger world than we thought. Vet Clin North Am Small Anim Pract. (2011) 41:261–72. 10.1016/j.cvsm.2010.12.006 - DOI - PMC - PubMed
    1. Suchodolski JS. Analysis of the gut microbiome in dogs and cats. Vet Clin Pathol. (2022) 50:6–17. 10.1111/vcp.13031 - DOI - PMC - PubMed
    1. Wernimont SM, Radosevich J, Jackson MI, Ephraim E, Badri DV, MacLeay JM, et al. . The effects of nutrition on the gastrointestinal microbiome of cats and dogs: impact on health and disease. Front Microbiol. (2020) 11:1266. 10.3389/fmicb.2020.01266 - DOI - PMC - PubMed