. 2022 Nov 30;10(2):nwac275.
doi: 10.1093/nsr/nwac275. eCollection 2023 Feb.

Up-regulation of HCN2 channels in a thalamocortical circuit mediates allodynia in mice

Affiliations

Up-regulation of HCN2 channels in a thalamocortical circuit mediates allodynia in mice

Jun-Ma Yu et al. Natl Sci Rev. .

Abstract

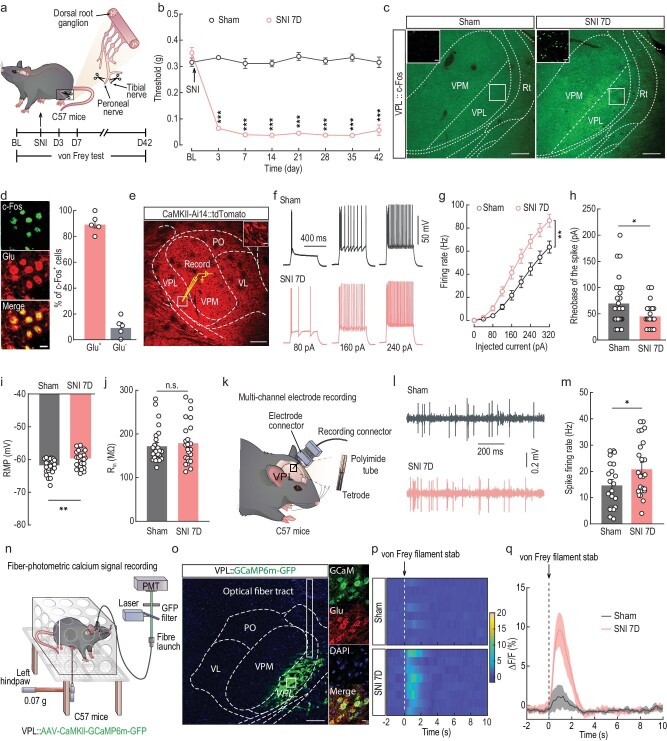
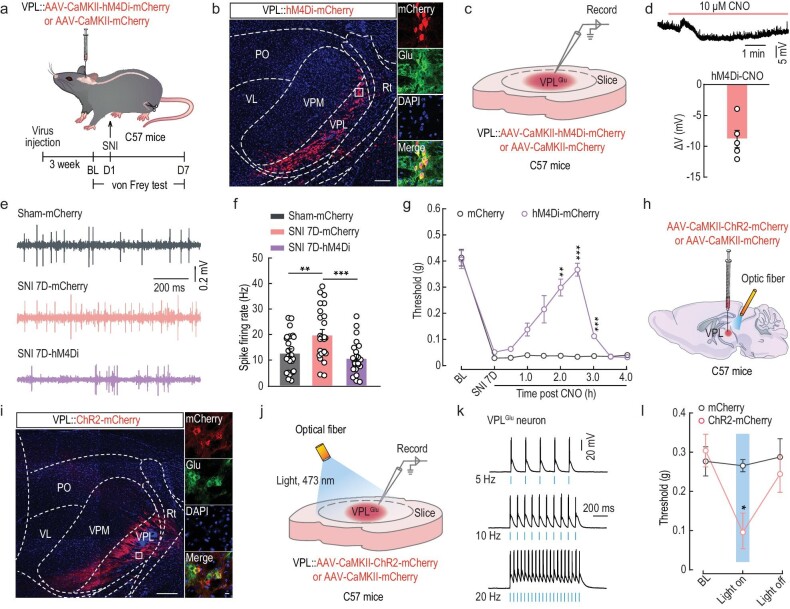
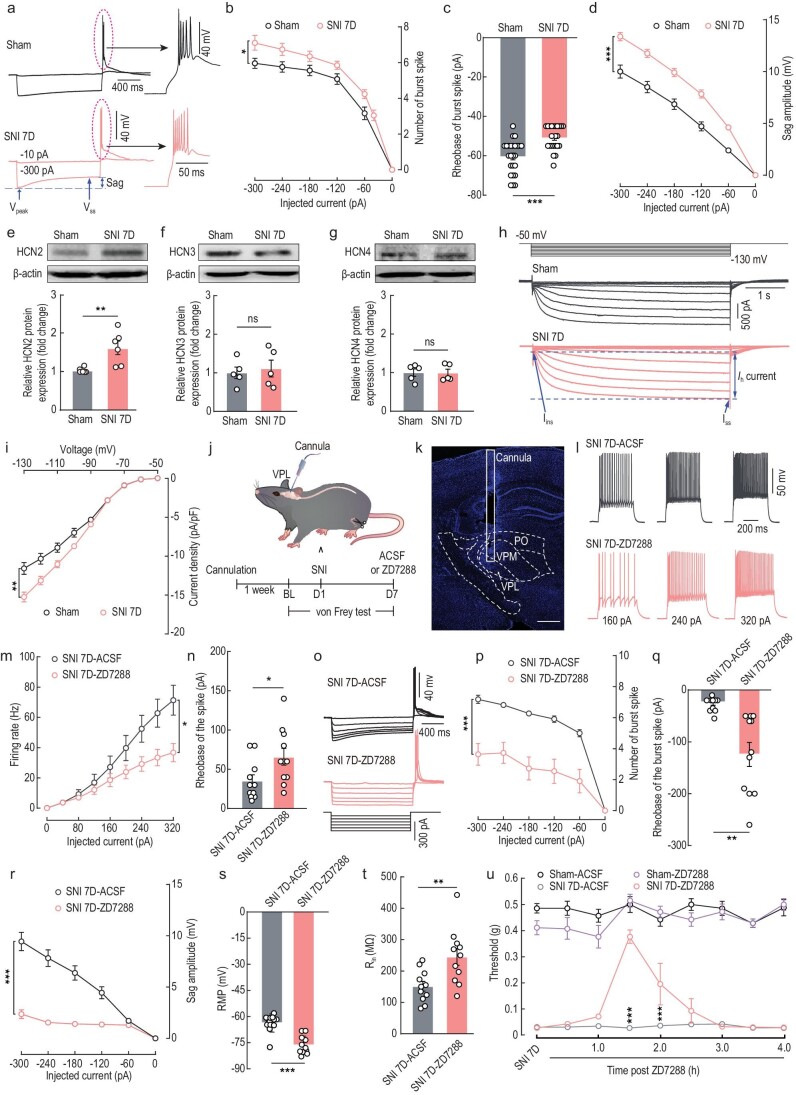
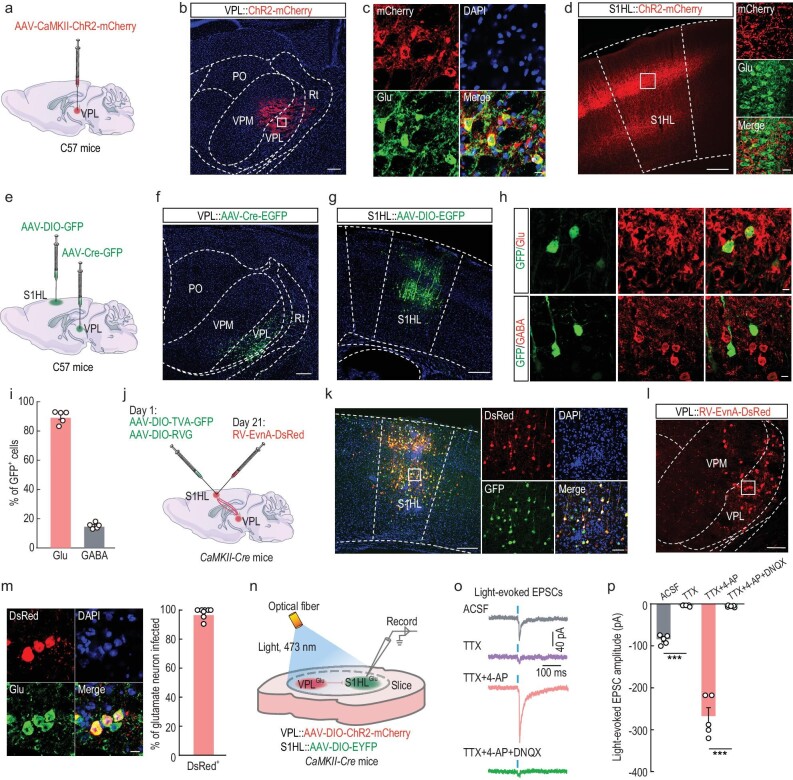
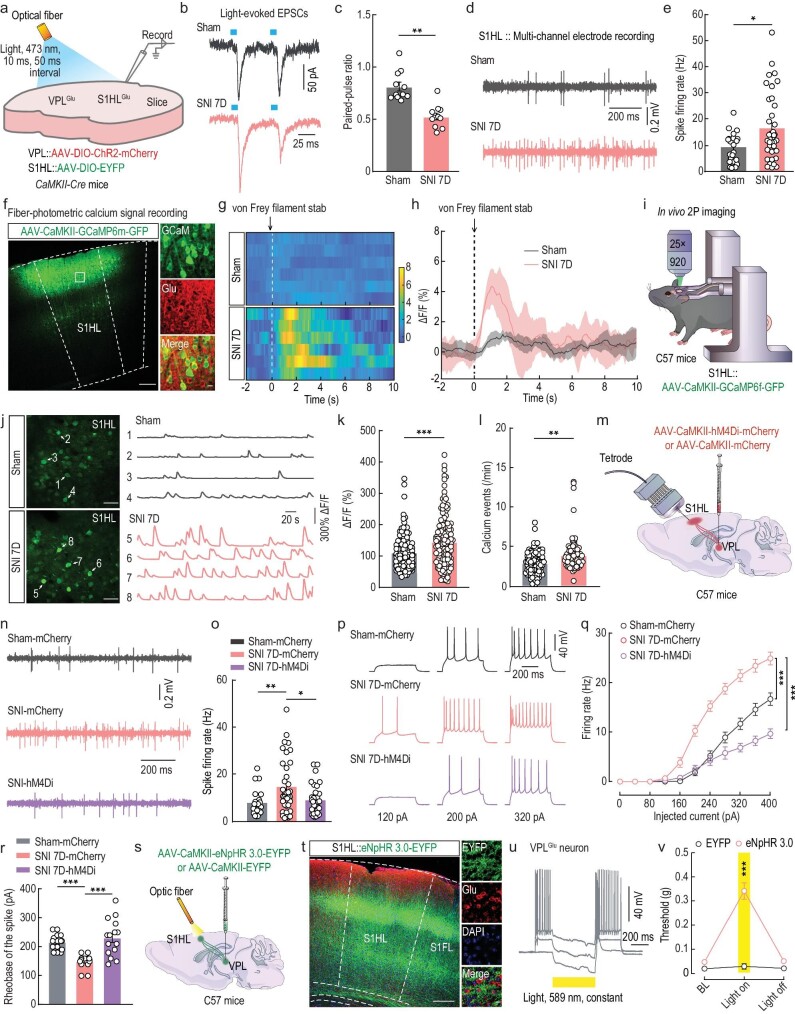
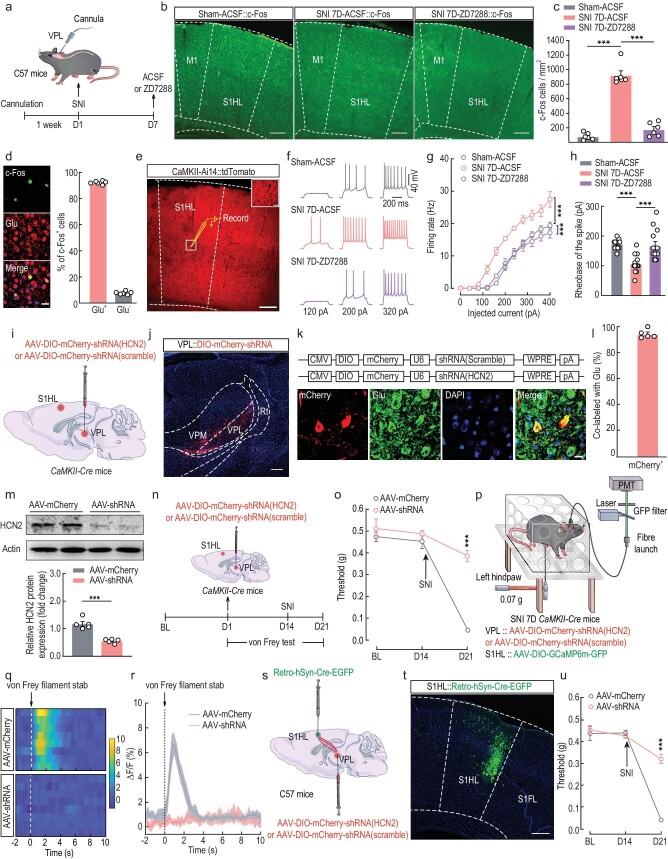
Chronic pain is a significant problem that afflicts individuals and society, and for which the current clinical treatment is inadequate. In addition, the neural circuit and molecular mechanisms subserving chronic pain remain largely uncharacterized. Herein we identified enhanced activity of a glutamatergic neuronal circuit that encompasses projections from the ventral posterolateral nucleus (VPLGlu) to the glutamatergic neurons of the hindlimb primary somatosensory cortex (S1HLGlu), driving allodynia in mouse models of chronic pain. Optogenetic inhibition of this VPLGlu→S1HLGlu circuit reversed allodynia, whereas the enhancement of its activity provoked hyperalgesia in control mice. In addition, we found that the expression and function of the HCN2 (hyperpolarization-activated cyclic nucleotide-gated channel 2) were increased in VPLGlu neurons under conditions of chronic pain. Using in vivo calcium imaging, we demonstrated that downregulation of HCN2 channels in the VPLGlu neurons abrogated the rise in S1HLGlu neuronal activity while alleviating allodynia in mice with chronic pain. With these data, we propose that dysfunction in HCN2 channels in the VPLGlu→S1HLGlu thalamocortical circuit and their upregulation occupy essential roles in the development of chronic pain.

Keywords: HCN2 channels; chronic pain; in vivo recordings; neural circuit.


Figures

Figure 1.
Figure 1.
Increased excitability of VPLGlu neurons in a mouse model of chronic neuropathic pain induced by SNI. (a) Schematic of the animal model of SNI. BL, baseline. (b) Time course of changes in response threshold to mechanical force via von Frey test in SNI mouse model of chronic pain. (c) Images showing the c-Fos expression in thalamic neurons in sham and SNI 7D mice. Scale bar, 200 μm. The insert depicts the area shown in the white box of the VPL. Scale bar, 20 μm. (d) Images (left) and statistics data (right) showing that c-Fos–positive neurons within VPL were mainly co-labeled with glutamate immunofluorescence. Scale bar, 10 μm. (e) Electrophysiological recordings from tdTomato-expressing VPLGlu neurons in CaMKII-Ai14 mice. Scale bar, 200 μm. The white box indicates the region shown in the box of the VPL. Scale bar, 10 μm. (f–h) Sample traces (f) and summarized data of firing rates (g), and rheobase of the spike (h) in VPLGlu neurons recorded from sham and SNI 7D mice. (i and j) Summarized data of resting membrane potential (RMP, i) and input resistance (Rin, j) in VPLGlu neurons recorded from sham and SNI 7D mice. (k) Schematic of multi-channel electrode recordings in the VPL of freely moving mice. (l and m) Representative traces (l) and statistical data (m) showing the spontaneous spikes recorded from VPLGlu neurons in sham and SNI 7D mice. (n) Schematic of the fiber photometry recordings. Ca2+ signal transients were recorded from GCaMP6m-expressing VPLGlu neurons in C57 mice. (o) Representative images showing the injection site of AAV-CaMKII-GCaMP6m-GFP virus (left) and GCaMP6m-labeled neurons (green) co-localized with glutamate (Glu, red) immunofluorescence (right) within the VPL. Scale bars, 200 μm (left) or 10 μm (right). (p and q) Heatmaps (p) and the mean data (q) showing the change of VPL-GluGCaMP6m signals in sham and SNI 7D mice. The colored bar at the right in (q) indicates ΔF/F (%). All data are means ± SEM. *P < 0.05, **P < 0.01, ***P < 0.001. n.s., not significant. For detailed statistics information, see Table S1.
Figure 2.
Figure 2.
Manipulation of VPLGlu neurons affects pain perception in mice. (a) Schematic of the experimental procedure. (b) Representative images of the injection site of AAV-CaMKII-hM4Di-mCherry (left) and mCherry-labeled neurons (red) co-labeled with glutamate immunofluorescence (green, right) within the VPL. Scale bars, 200 μm (left) or 20 μm (right). (c) Schematic of virus injection and the recording configuration. (d) Whole-cell recordings showing the effect of CNO on AAV-DIO-hM4Di-mCherry expressing VPLGlu neurons. (e and f) Representative traces (e) and summarized data (f) of spontaneous spikes in VPLGlu neurons of sham and SNI 7D mice infected with mCherry or hM4Di-mCherry within the VPL. (g) Effects of chemogenetic inhibition of VPLGlu neurons on the pain threshold in SNI 7D mice. (h) Schematic of optogenetic experiments in C57 mice. (i) Images showing that the injection site within VPL of AAV-CaMKII-ChR2-mCherry (left) and mCherry-labeled neurons (red) co-localized with glutamate (Glu) immunofluorescence (right). Scale bars, 200 μm (left) or 10 μm (right). (j) Schematic of VPL injection of CaMKII-ChR2-mCherry in C57 mice and recording configuration in acute slices. (k) Sample traces of action potentials evoked by light (473 nm, 20 ms, blue line) recorded from VPLGlu neurons in acute brain slices. (l) Effects of optogenetic activation of VPLGlu neurons on the pain threshold in naive mice. All data are means ± SEM. *P < 0.05, **P < 0.01, ***P < 0.001. For detailed statistics information, see Table S1.
Figure 3.
Figure 3.
Inhibition of HCN2 channels attenuates VPLGlu neuronal activity and relieves allodynia in SNI 7D mice. (a and b) Sample traces (a) and summarized data (b) of the spike in burst of VPLGlu neurons recorded from CaMKII-Ai14 sham and SNI 7D mice. ‘Sag’ was indicated at the end of the hyperpolarized potentials. (c) Statistical data of the rheobase of burst spike in VPLGlu neurons recorded from sham and SNI 7D mice. (d) Summarized data of sag amplitude recorded from VPLGlu neurons of sham and SNI 7D mice. (e–g) Western blotting of VPL lysates showing the HCN2 (e), HCN3 (f) and HCN4 (g) protein levels in sham and SNI 7D mice. (h) Representative traces of Ih currents recorded from VPLGlu neurons in sham and SNI 7D mice. (i) Current density (pA/pF) of Ih is plotted against the voltage step. (j) Schematic of the experimental procedure. (k) Image showing the site of the cannula implanted in mice. Scale bar, 500 μm. (l and m) Sample traces (l) and summarized data (m) of firing rates recorded from VPLGlu neurons in SNI 7D mice treated with ACSF or ZD7288. (n) Summarized data of the rheobase of the spike of VPLGlu neurons in SNI 7D mice treated with ACSF or ZD7288. (o and p) Sample traces (o) and summarized data (p) of the spike in burst recorded from VPLGlu neurons in SNI 7D mice treated with ACSF or ZD7288. (q–t) Statistical data of the rheobase of the burst spike (q), sag amplitude (r), RMP (s), and Rin (t) in VPLGlu neurons from SNI 7D mice treated with ACSF or ZD7288. (u) Effects of pharmacological inhibition of HCN2 channels in the VPL on the pain threshold of sham and SNI 7D mice All data are means ± SEM. *P < 0.05, **P < 0.01, ***P < 0.001, n.s., not significant. For detailed statistics information, see Table S1.
Figure 4.
Figure 4.
Dissection of the VPLGlu→S1HLGlu circuit. (a) Schematic of viral injection. (b) Images showing that the injection site within the VPL by AAV-CaMKII-ChR2-mCherry. Scale bar, 200 μm. (c) Images showing ChR2-mCherry-labeled neurons (red) co-localized with glutamate immunofluorescence (Glu, green) within the VPL. Scale bar, 10 μm. (d) Representative images of mCherry+ fibers in the S1HL. Scale bars, 200 μm (left) or 20 μm (right). (e) Schematic of viral injection. (f and g) Representative images of viral expression within the VPL (f) and S1HL (g). Scale bars, 100 μm (f) or 200 μm (g). (h and i) Images (h) and statistical data showing that the majority of GFP-labeled neurons (green) within the S1HL are co-localized with glutamate immunofluorescence (Glu, red). Scale bar, 10 μm. (j) Schematic of the Cre-dependent retrograde trans-monosynaptic rabies virus tracing strategy in S1HLGlu neurons of CaMKII-Cre mice. (k) Representative images of the injected site (left) and viral expression (right) within the S1HL. Starter cells (yellow) co-expressing AAV-DIO-TVA-GFP, AAV-DIO-RVG (green), and rabies RV-EnvA-ΔG-DsRed (red). Scale bars, 200 μm (left) and 60 μm (right). (l) Typical images showing that DsRed+ neurons (red) within VPL traced from the S1HL. Scale bar, 100 μm. (m) Images (left) and summarized data (right) showing that the DsRed+ neurons co-localized with glutamate immunofluorescence. Scale bar, 10 μm. (n) Schematic of virus injection and the recording configuration. (o and p) Representative traces (o) and summarized data (p) showing light-evoked EPSCs recorded from ipsilateral S1HLGlu neurons held at −70 mV in the thalamocortical slices under the recording configuration shown in (n). All data are means ± SEM. ***P < 0.001. For detailed statistics information, see Table S1.
Figure 5.
Figure 5.
The VPLGlu→S1HLGlu circuit modulates allodynia in SNI 7D mice. (a) Schematic of virus injection and the recording configuration. (b and c) Representative traces (b) and summarized data (c) of paired pulse ratios (PPRs) of light-evoked EPSCs in S1HLGlu neurons. (d and e) Representative traces (d) and statistical data (e) showing the spontaneous spikes recorded from S1HLGlu neurons in sham and SNI 7D mice. (f) Images showing that the injection site within the S1HL by AAV-CaMKII-GCaMP6m–(left) and GCaMP6m-labeled neurons (green) co-localized with glutamate (Glu, red) immunofluorescence within the S1HL (right). Scale bars, 200 μm (left) or 10 μm (right). (g and h) Heatmaps (g) and the mean data (h) showing the change of S1HL-GluGCaMP6m signals in sham and SNI 7D mice. The colored bar at the right in (g) indicates ΔF/F (%). (i) Schematic of the in vivo two-photon (2P) calcium image in head-restrained C57 mice with AAV-CaMKII-GCaMP6f-GFP expressing in S1HLGlu neurons. (j) Representative images of 2P GCaMP6f+ imaging fields (left) and numbers matching spontaneous ΔF/F time series traces (right) from the imaging fields of S1HLGlu neurons from sham and SNI 7D mice. Scale bar, 50 μm. (k and l) Statistical data showing the fluorescence intensity (k) and calcium influx events (l) of GCaMP6m-expressing S1HLGlu neurons in sham and SNI 7D mice. (m) Schematic of virus injection and the recording configuration. (n and o) Representative traces (n) and summarized data (o) of spontaneous spikes in S1HLGlu neurons of sham and SNI 7D mice infected with mCherry or hM4Di-mCherry within the VPL. (p and q) Sample traces (p) and summarized data (q) of current-evoked spikes recorded from S1HLGlu neurons of sham and SNI 7D mice infected with mCherry or hM4Di-mCherry within the VPL. (r) Summarized data of the rheobase of the spike recorded from S1HLGlu neurons of sham and SNI 7D mice. (s) Schematic of optogenetic experiments in C57 mice. (t) Left: images showing that the EYFP+ fibers within S1HL with VPL injection of AAV-CaMKII-eNpHR3.0-EYFP or AAV-CaMKII-EYFP. The background color (red) is the immunofluorescence staining of glutamate (Glu). Right: typical images showing the region in the white box in the S1HL. Scale bars, 200 μm (left) or 10 μm (right). (u) Sample traces of action potentials suppressed by light (589 nm, yellow line) recorded from VPLGlu neurons in acute brain slices. (v) Effects of optogenetic inhibition of VPLGlu neuronal fibers in the S1HL on pain thresholds. All data are means ± SEM. *P < 0.05, **P < 0.01, ***P < 0.001. For detailed statistics information, see Table S1.
Figure 6.
Figure 6.
Functional knockdown of HCN2 channels in the VPLGlu→S1HLGlu circuit rescues allodynia in SNI 7D mice. (a) Schematic of the experimental procedure. (b and c) Images (b) and statistical analysis (c) showing the distribution of c-Fos–positive neurons in the S1HL of sham and SNI 7D mice infused with ACSF or ZD7288 in the VPL. Scale bar, 200 μm. (d) Images (left) and statistical data (right) showing c-Fos–postive neurons (green) within S1HL were mainly co-labeled with glutamate immunofluorescence (Glu, red). Scale bar, 10 μm. (e) Electrophysiological recordings from tdTomato-expressing S1HLGlu neurons in CaMKII-Ai14 mice. Scale bar, 200 μm. The white box indicating the region shown in the box of the S1HL. Scale bar, 20 μm. (f and g) Sample traces (f) and summarized data (g) of current-evoked spike in S1HLGlu neurons recorded from sham and SNI 7D mice treated with ACSF or ZD7288 infusion into the VPL. (h) Summarized data of the rheobase of current-evoked spike in S1HLGlu neurons. (i) Schematic of viral injection. (j) Representative image showing the injection site within the VPL by AAV-DIO-mCherry-shRNA. Scale bar, 100 μm. (k) Top: schematic illustration of the construction strategy used for HCN2 channels downregulation with AAV-shRNA; Bottom: images showing mCherry-labeled neurons (red) co-localized with glutamate immunofluorescence (Glu, green) within the VPL. Scale bar, 10 μm. (l) Statistical data showing that mCherry-labeled neurons were mainly co-localized with glutamate immunofluorescence. (m) Western blotting of shRNA-scramble–infected and shRNA-HCN2–infected VPL lysates with antibodies against HCN2, β-actin. (n) Schematic of the experimental procedure. (o) Downregulation of HCN2 channels in VPLGlu neurons alleviated allodynia of SNI 7D mice. (p) Schematic of the fiber photometry recordings in SNI 7D mice. (q and r) Heatmaps (q) and the mean data (r) showing the change of S1HL-GluGCaMP6m signals in SNI 7D mice infusion of AAV-DIO-mCherry-shRNA (HCN2) or AAV-DIO-mCherry-shRNA (scramble) with the VPL. The colored bar at the right in (q) indicates ΔF/F (%). (s) Schematic of virus injection in the VPL and S1HL. (t) Typical image showing the injection site within the S1HL. Scale bar, 200 μm. (u) Effects of downregulation of HCN2 channels in VPLGlu→S1HLGlu pathway on pain thresholds in SNI 7D mice. All data are means ± SEM. ***P < 0.001. For detailed statistics information, see Table S1.

References

    1. GBD 2016 Disease and Injury Incidence and Prevalence Collaborators. Global, regional, and national incidence, prevalence, and years lived with disability for 328 diseases and injuries for 195 countries, 1990–2016: a systematic analysis for the Global Burden of Disease Study 2016. Lancet 2017; 390: 1211–59. - PMC - PubMed
    1. Cohen SP, Vase L, Hooten WM. Chronic pain: an update on burden, best practices, and new advances. Lancet North Am Ed 2021; 397: 2082–97. 10.1016/S0140-6736(21)00393-7 - DOI - PubMed
    1. Choi S, Hachisuka J, Brett MAet al. . Parallel ascending spinal pathways for affective touch and pain. Nature 2020; 587: 258–63. 10.1038/s41586-020-2860-1 - DOI - PMC - PubMed
    1. Navratilova E, Porreca F. Reward and motivation in pain and pain relief. Nat Neurosci 2014; 17: 1304–12. 10.1038/nn.3811 - DOI - PMC - PubMed
    1. Wager TD, Rilling JK, Smith EEet al. . Placebo-induced changes in FMRI in the anticipation and experience of pain. Science 2004; 303: 1162–7.10.1126/science.1093065 - DOI - PubMed