. 2023 Feb 9:14:1120341.
doi: 10.3389/fphys.2023.1120341. eCollection 2023.

Nucleus tractus solitarii is required for the development and maintenance of phrenic and sympathetic long-term facilitation after acute intermittent hypoxia

Affiliations

Nucleus tractus solitarii is required for the development and maintenance of phrenic and sympathetic long-term facilitation after acute intermittent hypoxia

Daniela Ostrowski et al. Front Physiol. .

Abstract

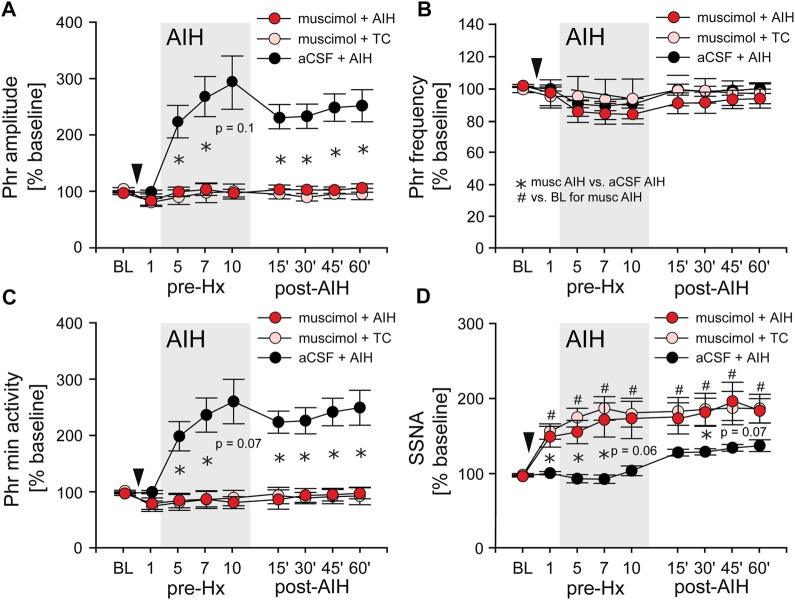
Exposure to acute intermittent hypoxia (AIH) induces prolonged increases (long term facilitation, LTF) in phrenic and sympathetic nerve activity (PhrNA, SNA) under basal conditions, and enhanced respiratory and sympathetic responses to hypoxia. The mechanisms and neurocircuitry involved are not fully defined. We tested the hypothesis that the nucleus tractus solitarii (nTS) is vital to augmentation of hypoxic responses and the initiation and maintenance of elevated phrenic (p) and splanchnic sympathetic (s) LTF following AIH. nTS neuronal activity was inhibited by nanoinjection of the GABAA receptor agonist muscimol before AIH exposure or after development of AIH-induced LTF. AIH but not sustained hypoxia induced pLTF and sLTF with maintained respiratory modulation of SSNA. nTS muscimol before AIH increased baseline SSNA with minor effects on PhrNA. nTS inhibition also markedly blunted hypoxic PhrNA and SSNA responses, and prevented altered sympathorespiratory coupling during hypoxia. Inhibiting nTS neuronal activity before AIH exposure also prevented the development of pLTF during AIH and the elevated SSNA after muscimol did not increase further during or following AIH exposure. Furthermore, nTS neuronal inhibition after the development of AIH-induced LTF substantially reversed but did not eliminate the facilitation of PhrNA. Together these findings demonstrate that mechanisms within the nTS are critical for initiation of pLTF during AIH. Moreover, ongoing nTS neuronal activity is required for full expression of sustained elevations in PhrNA following exposure to AIH although other regions likely also are important. Together, the data indicate that AIH-induced alterations within the nTS contribute to both the development and maintenance of pLTF.

Keywords: muscimol; peripheral chemoreflex; phrenic nerve activity; splanchnic sympathetic nerve activity; sympathorespiratory coupling.


Conflict of interest statement

The authors declare that the research was conducted in the absence of any commercial or financial relationships that could be construed as a potential conflict of interest.

Figures

FIGURE 1
FIGURE 1
Timeline of general hypoxic experimental protocols (A) and example nTS injection site (B). (A) AIH: Animals exposed to AIH undergo 10 bouts of hypoxia (Hx, 45s; black bars) separated by 5 min breathing O2 enriched air (grey). 1 hour following the conclusion of Hx 10, they underwent a final bout of Hx (Hx post-AIH). TC: Time control (TC) animals received only the first (Hx 1) and final (Hx post TC) bout of hypoxia. Separate groups of rats received nTS nanoinjections (arrows) of muscimol or aCSF, either prior to Hx 1 or following the AIH or TC protocol. Muscimol injections after AIH or TC were only given in rats that had no intervention or aCSF injections prior to AIH. Rats were then subjected to another bout of hypoxia (Hx post-inj). As an additional control, rats were subjected to one period of sustained hypoxia (Sus. Hx) of the same total duration as the combined time in Hx 1–10. (B) schematic representation (left) and photomicrograph (right) of a coronal brainstem section (−150 µm to calamus scriptorius) showing the center of the injection site (arrow). Gr, gracile nucleus; nTS, nucleus tractus solitarii; DMV, dorsal motor nucleus of the vagus; XII, hypoglossal nucleus.
FIGURE 2
FIGURE 2
Representative recording of AP (red, MAP superimposed in light color), integrated phrenic (ʃPhrNA, green), integrated splanchnic sympathetic nerve activity (ʃSSNA, purple; mean in light purple) and O2 saturation (red) in response to repeated hypoxia. (A) AIH, Hx 1–10 and Hx post-AIH. (B) time control (TC). Black bars in time lines indicate periods of hypoxia. Horizontal dashed lines in traces indicate baseline PhrNA and SSNA. Insets on the right show an expanded time scale of ʃPhrNA and ʃSSNA before (a, b) and 1 h after AIH or TC (a’, b’).
FIGURE 3
FIGURE 3
AIH induces long-term facilitation (LTF) of both PhrNA and SSNA. (A), Phr amplitude; (B), Phr frequency; (C), Phr min activity; (D), SSNA in periods of breathing O2 enriched air before (BL, pre-Hx 1), within (pre-Hx 5, 7, 10; grey box) and after (15′, 30′, 45′, 60′) AIH or TC protocols in animals exposed to AIH (green (PhrNA) or purple (SSNA) circles; n = 13) or TC (white circles, n = 6, PhrNA; n = 7, SSNA). Two-way repeated measures ANOVA: p ≤ 0.05; * AIH vs. TC, # relative to pre-AIH baseline within a group.
FIGURE 4
FIGURE 4
AIH increases PhrNA and SSNA responses to hypoxia. (A) Mean response to an initial bout of hypoxia (10% O2, 45 sec; Hx 1, white circles) and hypoxia following time control (A1), Hx post-TC, green (PhrNA) or purple (SSNA) circles, n = 6) or after exposure to AIH (A2), Hx post-AIH, green (PhrNA) or purple (SSNA) circles, n = 11). Vertical line marks the onset of the animal breathing 10% O2. Neither baseline PhrNA and SSNA nor the response to Hx (Hx 1 vs. Hx post-TC) was altered in TC (A1). 1 h after AIH, baseline Phr amplitude and SSNA were elevated and the post-AIH Hx responses were augmented (Interaction: Phr amplitude, p = 0.001; SSNA, p = 0.003, Two-way repeated measures ANOVA) whereas Phr frequency responses were very similar (A2). (B) Mean peak Phr min activity (B1) and SSNA (B2) in response to a given hypoxic episode. Initial Hx (Hx 1) responses were not different between groups (Phr min activity: p = 0.93, SSNA: p = 0.48, t-test). TC did not alter the response to hypoxia (Hx 1 vs. Hx post-TC: Phr min activity: p = 0.74, SSNA p = 0.53, paired t-test). The PhrNA and SSNA responses to hypoxia increased later during exposure to AIH (One-way repeated measures ANOVA: p ≤0.05; # relative to Hx 1, † relative to Hx 5). PhrNA during Hx post-AIH was also significantly greater compared to Hx post-TC (p ≤0.05, * AIH vs. TC, t-test).
FIGURE 5
FIGURE 5
Hypoxia but not LTF alters sympathorespiratory coupling. (A): Example recording of ʃPhrNA (green), Phr frequency (black, right axis) and ʃSSNA (purple, mean in light purple) during Hx 1 (A1) and Hx-post-AIH (A2). Dashed box highlights analysis window for sympathorespiratory coupling during hypoxia, taken during the peak SSNA response; note that this occurred after the initial increase in Phr freq. Horizontal black line indicates period breathing 10% O2 (45 s). (B): Phrenic triggered averages of SSNA from a representative animal during baseline breathing O2 enriched air, Hx 1, AIH-induced LTF in O2 enriched air (1 h after AIH) and during Hx post-AIH. Green trace is average respiratory cycle. SSNA during inspiration (I) is marked in light purple and during expiration (E) in purple. Dotted lines divide phases into first and second half of inspiration (I1, I2) and first and second half of expiration (E1, E2). (C1): Mean area under the curve of phrenic triggered averages of absolute values of SSNA (n = 12). Most SSNA during pre-AIH (BL, white bars) occurred during expiration (I1 = I2 < E1 < E2; p ≤ 0.05, Two-way repeated measures ANOVA). During hypoxia (Hx 1, purple bars) SSNA increased in E1 and SSNA during E1 was similar to E2 (I1 = I2 < E1 = E2). 1 h after AIH in O2 enriched air (LTF, light purple bars) SSNA increased in almost all phases (BL vs. LTF: I1: p = 0.16, I2: p = 0.004, E1: p = 0.0006, E2: p = 0.034. One-way repeated measures ANOVA). (C2): Normalized SSNA (% total activity within a given cycle). Hypoxia increased the relative amount of SSNA in E1 but decreased relative SSNA in I1, I2 and E2. No differences in the pattern of PhrNA and SSNA coupling were observed after AIH in O2 (BL vs. LTF: p = 0.89) or hypoxia (Hx 1 vs. Hx post-AIH: p = 0.967. (C3): Mean time of I and E. Total time of inspiration and expiration was not significantly altered by LTF or during the peak SSNA response to Hx (I: p = 0.77, E p = 0.91). Two-way repeated measures ANOVA, p ≤ 0.05; * Hx vs. respective control (Hx 1 vs. BL; Hx post-AIH vs. LTF), # post-AIH vs. respective O2 level pre-AIH (LTF vs. BL; Hx-post vs. Hx 1).
FIGURE 6
FIGURE 6
Inhibition of nTS neuronal activity prior to AIH prevents the initiation of pLTF. (A) Phr amplitude; (B) Phr frequency; (C) Phr min activity; (D) SSNA (while breathing O2 enriched air) before (BL, pre-Hx 1), during (pre-Hx 5, 7, 10; grey box) and after (15′, 30′, 45′, 60′) AIH in animals that received bilateral nTS muscimol injection (arrowhead) prior to either TC (muscimol + TC; pink circles, n = 5) or AIH (muscimol + AIH; red circles, n = 8; PhrNA, n = 6, SSNA). Data for animals exposed to AIH without nTS inhibition (aCSF + AIH; black circles, n = 13) prior to AIH are presented for comparison (same data as in Figure 3). Two-way repeated measures ANOVA: p ≤ 0.05; * aCSF + AIH vs. muscimol + AIH, # relative to pre-AIH baseline within a group.
FIGURE 7
FIGURE 7
Inhibition of nTS activity prior to AIH inhibits PhrNA and SSNA responses to Hx with no changes in sympathorespiratory coupling. (A): Change in PhrNA (A1) and SSNA (A2) during Hx 1, 5, 7, 10 and Hx post-AIH. Animals received bilateral nTS muscimol injections prior to either AIH (red bars, n = 8; PhrNA, n = 6, SSNA) or TC (pink bars, n = 5; PhrNA, n = 3, SSNA). Changes due to hypoxia were calculated relative to the appropriate pre-Hx baseline. Data for animals exposed to AIH (black bars) without nTS inhibition prior to AIH are presented for comparison (same data as in Figure 4B). Muscimol injections blunted PhrNA and SSNA responses to Hx. No differences were observed between muscimol + AIH and muscimol + TC at Hx 1 or Hx post-AIH (Phr min activity: Hx 1: p = 0.38, Hx post-AIH: p = 0.99; SSNA: Hx 1: p = 0.89, Hx post-AIH: p = 0.65, t-test). Two-way ANOVA for repeated measures: p ≤ 0.05; * aCSF + AIH vs. muscimol + AIH or muscimol + TC, # relative to Hx 1. (B): Phrenic triggered averages of normalized SSNA (% total activity within a given cycle, (B1) and mean time of inspiration and expiration (B2) at baseline (BL, prior to muscimol injection; white bars), post-muscimol injection (red bars), during Hx 1 (grey bars), 1 h after AIH (LTF, light grey bars) and Hx post-AIH (grey striped bars). Most SSNA during baseline occurred during expiration (I1 = I2 < E1 < E2; p ≤ 0.05, One-way ANOVA). Muscimol injections did not change SSNA pattern in O2 enriched air either prior to (BL) or after AIH (LTF). However, nTS inhibition prevented changes in pattern during Hx 1 compared to periods of O2 enriched air, and Hx post-AIH (p > 0.1 for all). Inspiration and expiration time was not different following muscimol (Insp: p = 0.20; Exp: p = 0.23). One-way repeated measures ANOVA.
FIGURE 8
FIGURE 8
Inhibition of nTS activity following AIH reverses pLTF. (A) Example recording of AP (red, MAP superimposed in light red), ʃPhrNA (green) and ʃSSNA (purple, mean in light purple) at baseline (BL), LTF (1 h after AIH), during Hx post-AIH, in response to bilateral nTS injection of muscimol after LTF development and during Hx post-injection of muscimol. (B) Phr min activity (B1) or SSNA (B2) during periods in enriched O2 in animals injected with muscimol or aCSF after either AIH or TC. Following AIH, Phr min activity and SSNA were significantly elevated. Subsequent nTS inhibition with muscimol (AIH + muscimol; red triangles, n = 9) reduced Phr min activity whereas control injections of aCSF (AIH + aCSF; black circles, n = 5) had no significant effect. In TC rats, injections of either muscimol (TC + muscimol; pink triangles, n = 5) or aCSF (TC + aCSF; white circles, n = 3) did not alter Phr min activity. nTS muscimol significantly increased SSNA to similar levels following either AIH or TC. Two-way repeated measures ANOVA, p ≤ 0.05; * AIH vs. TC, # relative to BL within a group, † post-AIH vs. post-injection for AIH-muscimol group. (C) Mean responses to hypoxia post-AIH before (black circles) and following injection of muscimol post-AIH (red circles, n = 9). Dashed vertical line marks the onset of the animal breathing 10% O2. After injection of muscimol chemoreflex function was significantly inhibited (Interaction: Phr min activity, p < 0.001; SSNA, p < 0.001, Two-way repeated measures ANOVA). (D) Baroreflex function prior to muscimol injections (black symbols), 5 min after muscimol injections (red symbols, n = 5) and after a recovery period of 2 hrs (grey symbols, n = 3).

Similar articles

Cited by

References

    1. Abdala A. P. L., Haibara A. S., Colombari E. (2003). Cardiovascular responses to substance P in the nucleus tractus solitarii: Microinjection study in conscious rats. Am. J. Physiol. Heart Circ. Physiol. 285, H891–H898. 10.1152/ajpheart.00869.2002 - DOI - PubMed
    1. Abdala A. P., McBryde F. D., Marina N., Hendy E. B., Engelman Z. J., Fudim M., et al. (2012). Hypertension is critically dependent on the carotid body input in the spontaneously hypertensive rat. J. Physiol. 590, 4269–4277. 10.1113/jphysiol.2012.237800 - DOI - PMC - PubMed
    1. Almado C. E., Machado B. H., Leão R. M. (2012). Chronic intermittent hypoxia depresses afferent neurotransmission in NTS neurons by a reduction in the number of active synapses. J. Neurosci. 32, 16736–16746. 10.1523/JNEUROSCI.2654-12.2012 - DOI - PMC - PubMed
    1. Andresen M. C., Kunze D. L. (1994). Nucleus tractus solitarius - gateway to neural circulatory control. Annu. Rev. Physiol. 56, 93–116. 10.1146/annurev.ph.56.030194.000521 - DOI - PubMed
    1. Bach K. B., Mitchell G. S. (1996). Hypoxia-induced long-term facilitation of respiratory activity is serotonin dependent. Respir. Physiol. 104, 251–260. 10.1016/0034-5687(96)00017-5 - DOI - PubMed