Naive and memory T cells TCR-HLA-binding prediction
- PMID: 36846560
- PMCID: PMC9914496
- DOI: 10.1093/oxfimm/iqac001
Naive and memory T cells TCR-HLA-binding prediction
Abstract
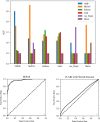
T cells recognize antigens through the interaction of their T cell receptor (TCR) with a peptide-major histocompatibility complex (pMHC) molecule. Following thymic-positive selection, TCRs in peripheral naive T cells are expected to bind MHC alleles of the host. Peripheral clonal selection is expected to further increase the frequency of antigen-specific TCRs that bind to the host MHC alleles. To check for a systematic preference for MHC-binding T cells in TCR repertoires, we developed Natural Language Processing-based methods to predict TCR-MHC binding independently of the peptide presented for Class I MHC alleles. We trained a classifier on published TCR-pMHC binding pairs and obtained a high area under curve (AUC) of over 0.90 on the test set. However, when applied to TCR repertoires, the accuracy of the classifier dropped. We thus developed a two-stage prediction model, based on large-scale naive and memory TCR repertoires, denoted TCR HLA-binding predictor (CLAIRE). Since each host carries multiple human leukocyte antigen (HLA) alleles, we first computed whether a TCR on a CD8 T cell binds an MHC from any of the host Class-I HLA alleles. We then performed an iteration, where we predict the binding with the most probable allele from the first round. We show that this classifier is more precise for memory than for naïve cells. Moreover, it can be transferred between datasets. Finally, we developed a CD4-CD8 T cell classifier to apply CLAIRE to unsorted bulk sequencing datasets and showed a high AUC of 0.96 and 0.90 on large datasets. CLAIRE is available through a GitHub at: https://github.com/louzounlab/CLAIRE, and as a server at: https://claire.math.biu.ac.il/Home.
Keywords: HLA; MHC; TCR; binding prediction; machine learning; memory T-cell; receptor; two stages.
© The Author(s) 2022. Published by Oxford University Press.
Figures


Similar articles
-
Prediction of Specific TCR-Peptide Binding From Large Dictionaries of TCR-Peptide Pairs.Front Immunol. 2020 Aug 25;11:1803. doi: 10.3389/fimmu.2020.01803. eCollection 2020. Front Immunol. 2020. PMID: 32983088 Free PMC article.
-
Contribution of T Cell Receptor Alpha and Beta CDR3, MHC Typing, V and J Genes to Peptide Binding Prediction.Front Immunol. 2021 Apr 26;12:664514. doi: 10.3389/fimmu.2021.664514. eCollection 2021. Front Immunol. 2021. PMID: 33981311 Free PMC article.
-
Deep convolutional neural networks for pan-specific peptide-MHC class I binding prediction.BMC Bioinformatics. 2017 Dec 28;18(1):585. doi: 10.1186/s12859-017-1997-x. BMC Bioinformatics. 2017. PMID: 29281985 Free PMC article.
-
Regulatory T cells and co-evolution of allele-specific MHC recognition by the TCR.Scand J Immunol. 2020 Mar;91(3):e12853. doi: 10.1111/sji.12853. Epub 2019 Dec 17. Scand J Immunol. 2020. PMID: 31793005 Free PMC article. Review.
-
Structure-Based, Rational Design of T Cell Receptors.Front Immunol. 2013 Sep 12;4:268. doi: 10.3389/fimmu.2013.00268. Front Immunol. 2013. PMID: 24062738 Free PMC article. Review.
Cited by
-
Learning predictive signatures of HLA type from T-cell repertoires.PLoS Comput Biol. 2025 Jan 6;21(1):e1012724. doi: 10.1371/journal.pcbi.1012724. eCollection 2025 Jan. PLoS Comput Biol. 2025. PMID: 39761303 Free PMC article.
-
Bw4 ligand and direct T-cell receptor binding induced selection on HLA A and B alleles.Front Immunol. 2023 Nov 21;14:1236080. doi: 10.3389/fimmu.2023.1236080. eCollection 2023. Front Immunol. 2023. PMID: 38077375 Free PMC article.
-
Counting is almost all you need.Front Immunol. 2023 Jan 20;13:1031011. doi: 10.3389/fimmu.2022.1031011. eCollection 2022. Front Immunol. 2023. PMID: 36741395 Free PMC article.
-
Neural network models for sequence-based TCR and HLA association prediction.PLoS Comput Biol. 2023 Nov 20;19(11):e1011664. doi: 10.1371/journal.pcbi.1011664. eCollection 2023 Nov. PLoS Comput Biol. 2023. PMID: 37983288 Free PMC article.
References
-
- Davis MM, Bjorkman PJ. T-cell antigen receptor genes and T-cell recognition. Nature. 1988;334:395–402 - PubMed
-
- Krogsgaard M, Davis MM.. How T cells’ see’antigen. Nat Immunol. 2005;6:239–45 - PubMed
-
- Rowen L, Koop BF, Hood L.. The complete 685-kilobase DNA sequence of the human β T cell receptor locus. Science. 1996;272:1755–62 - PubMed
LinkOut - more resources
Full Text Sources
Research Materials
