. 2023 Feb 1:11:1103719.
doi: 10.3389/fcell.2023.1103719. eCollection 2023.

Validating expression of beta cell maturation-associated genes in human pancreas development

Affiliations

Validating expression of beta cell maturation-associated genes in human pancreas development

Daniel M Tremmel et al. Front Cell Dev Biol. .

Abstract

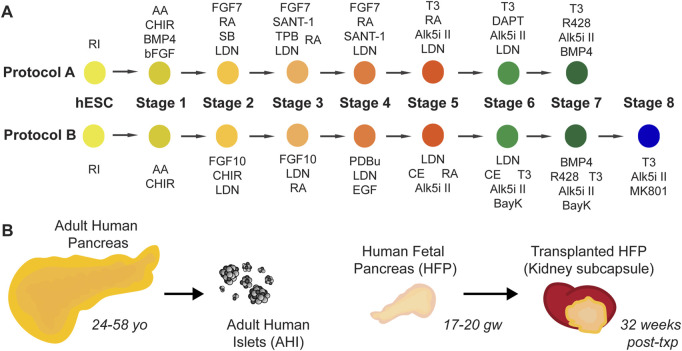
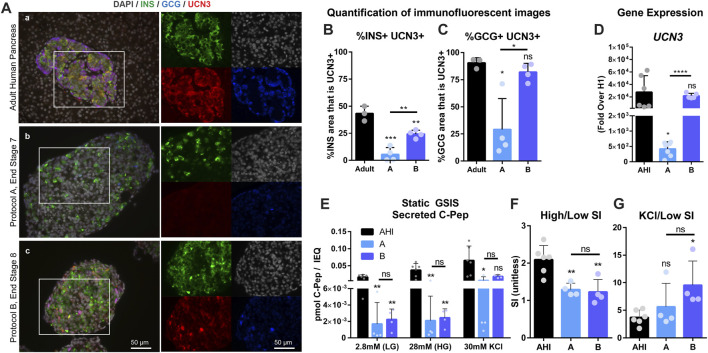
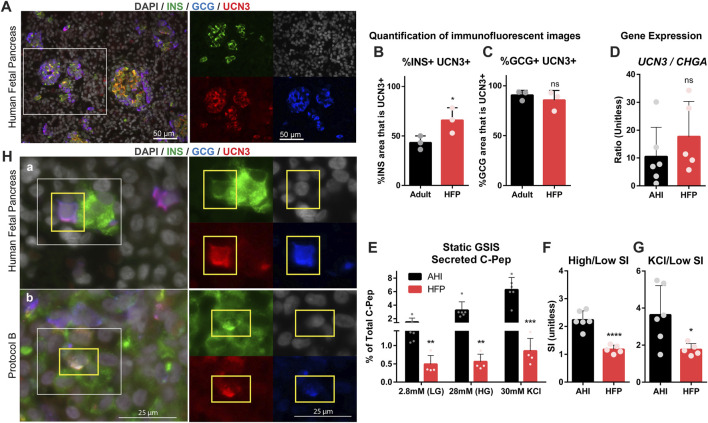
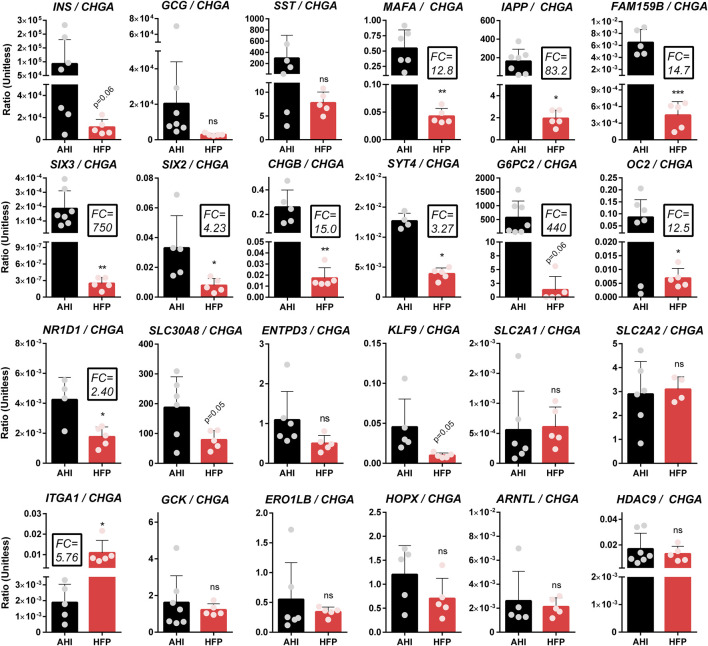
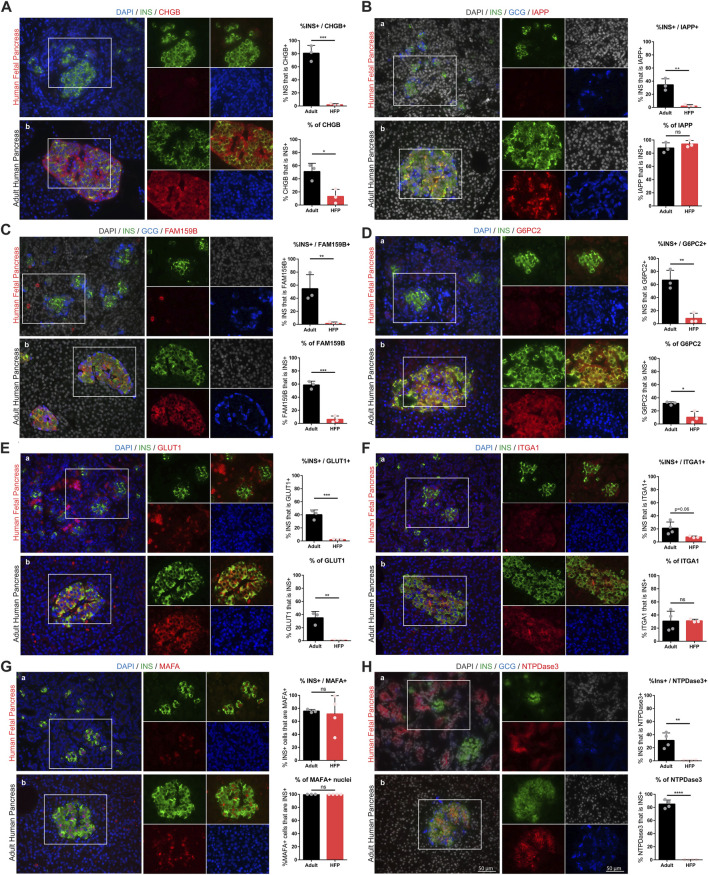
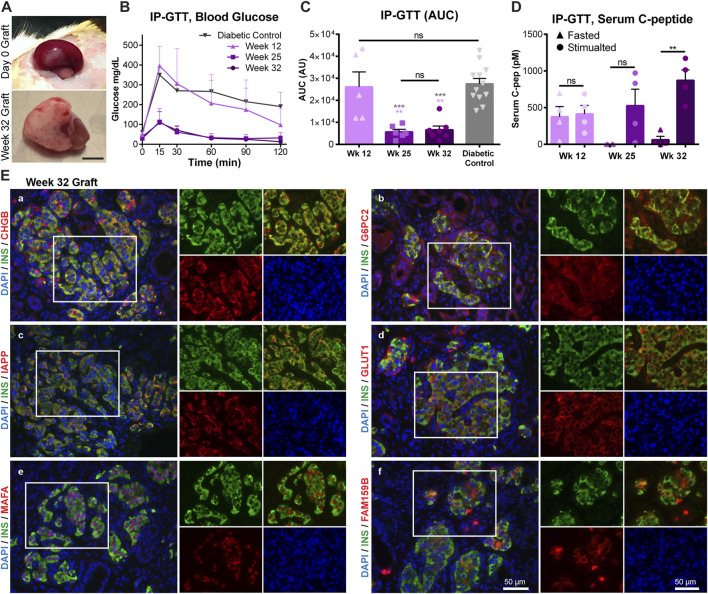
The identification of genes associated with human pancreatic beta cell maturation could stimulate a better understanding of normal human islet development and function, be informative for improving stem cell-derived islet (SC-islet) differentiation, and facilitate the sorting of more mature beta cells from a pool of differentiated cells. While several candidate factors to mark beta cell maturation have been identified, much of the data supporting these markers come from animal models or differentiated SC-islets. One such marker is Urocortin-3 (UCN3). In this study, we provide evidence that UCN3 is expressed in human fetal islets well before the acquisition of functional maturation. When SC-islets expressing significant levels of UCN3 were generated, the cells did not exhibit glucose-stimulated insulin secretion, indicating that UCN3 expression is not correlated with functional maturation in these cells. We utilized our tissue bank and SC-islet resources to test an array of other candidate maturation-associated genes, and identified CHGB, G6PC2, FAM159B, GLUT1, IAPP and ENTPD3 as markers with expression patterns that correlate developmentally with the onset of functional maturation in human beta cells. We also find that human beta cell expression of ERO1LB, HDAC9, KLF9, and ZNT8 does not change between fetal and adult stages.

Keywords: development; human; islets; maturation; stem cells.


Conflict of interest statement

The authors declare that the research was conducted in the absence of any commercial or financial relationships that could be construed as a potential conflict of interest.

Figures

FIGURE 1
FIGURE 1
Resources used in this study. (A) Schematic diagrams for two SC-islet differentiation protocols, Protocol A (“A”) and Protocol B (“B”). Full details of these protocols are detailed in Supplemental Tables 1-3. (B) Adult human pancreas tissue (age range 24–58 years old), isolated adult human islets (“AHI”), human fetal pancreas (“HFP”) (age range 17–20 gestational weeks) and matured HFP grafts (32 weeks post-transplant) are used in this study for assessment of gene expression, protein localization, and function.
FIGURE 2
FIGURE 2
UCN3 expression in SC-islets does not correlate with improved function. (A) Immunostaining for insulin (green), glucagon (blue) and UCN3 (red) in adult human pancreas (A), and end-stage cells collected after differentiation using Protocols A (B) and B (C). Images of individual channels are the same magnification as the merged images. Scale bars are 50 microns. (B) Quantification of co-localization of UCN3 with insulin in adult human pancreas, Pro A or Pro (B). (C) Quantification of co-localization of UCN3 with glucagon in adult human pancreas, Pro A or Pro (B). (D) Gene expression of UCN3 normalized to beta-actin, in adult human pancreas and SC-islets derived via Pro A or Pro B relative to undifferentiated cells (H1). (E) Static GSIS assay to assess insulin secretion in response to low glucose (LG, 2.8 mM), high glucose (HG, 28 mM) and KCl (30 mM) measured by the concentration of human C-Pep in the supernatant (pmol C-Pep/IEQ). (F) Glucose-mediated stimulation index (SI) (C-pep secreted under high glucose/C-pep secreted under low glucose) calculated from the static GSIS assay. (G) Potassium-mediated SI (C-pep secreted under KCl/C-pep secreted under low glucose) calculated from the static GSIS assay. Statistical indicators directly above each bar are compared to adult pancreas or AHI (ns = not significant, *p < 0.05, **p < 0.01, ***p < 0.001, ****p < 0.0001).
FIGURE 3
FIGURE 3
UCN3 is highly expressed in human fetal islets, long before attainment of functional maturation. (A) Immunostaining for insulin (green), glucagon (blue) and UCN3 (red) in human fetal pancreas (HFP). Scale bars are 50 microns. (B) Quantification of co-localization of UCN3 with insulin in adult human pancreas and HFP. (C) Quantification of co-localization of UCN3 with glucagon in adult human pancreas and HFP. (D) Gene expression of UCN3 normalized to CHGA in adult human islets (AHI) and HFP. (E) Static GSIS assay to assess insulin secretion in response to low glucose (LG, 2.8 mM), high glucose (HG, 28 mM) and KCl (30 mM) measured by the concentration of human C-Pep in the supernatant as a percentage of total C-Pep content. (F) Glucose-mediated stimulation index (SI) (C-pep secreted under high glucose/C-pep secreted under low glucose) calculated from the static GSIS assay. (G) Potassium-mediated SI (C-pep secreted under KCl/C-pep secreted under low glucose) calculated from the static GSIS assay. To normalize the number of islets loaded into each GSIS replicate and because the exact fetal islet IEQ could not be counted, GSIS results are presented as a percentage of the total insulin content of each sample. (H) (A) In normal HFP, polyhormonal (INS+GCG+) cells are considered an immature population and can be found to express UCN3 at this developmental stage. (B) In SC-islets derived with Protocol B, UCN3+INS+GCG+ triple-positive cells can also be found. Images of individual channels are the same magnification as the merged images. Scale bars are 25 microns. Statistical indicators directly above each bar are compared to adult pancreas or AHI (ns = not significant, *p < 0.05, **p < 0.01, ****p < 0.0001).
FIGURE 4
FIGURE 4
Gene expression of candidate maturation markers in adult human islets and fetal pancreas. QPCR-based analysis of gene expression of several candidate maturation markers in adult human islets (“AHI”) and human fetal pancreas (“HFP”). All genes were normalized to β actin within the same sample, then normalized to undifferentiated H1 cells and presented as a ratio of gene expression over CHGA to normalize for differences in endocrine mass between the various samples. Fold changes (FC) listed highlight major differences in gene expression between AHI and HFP. Statistical indicators directly above each bar are compared to AHI (ns = not significant, *p < 0.05, **p < 0.01, ***p < 0.001).
FIGURE 5
FIGURE 5
Protein expression and localization during human beta cell maturation. Immunofluorescent staining of candidate maturation markers reveals significant increase in beta cell-specific expression of CHGB (A), IAPP (B), FAM159B (C), G6PC2 (D), GLUT1 (E), ITGA1 (F), MAFA (G), NTPDase3 (H) in human fetal and adult pancreas sections. Individual channel images are the same magnification as the larger merged images. Scale bars = 50 microns. For each marker, image quantification is depicted as the percentage of insulin that co-localizes with each marker (top graphs) and the percentage of each marker that co-localizes with insulin (bottom graphs). (ns = not significant, *p < 0.05, **p < 0.01, ***p < 0.001, ****p < 0.0001).
FIGURE 6
FIGURE 6
Human fetal pancreas functional maturation corresponds with increased maturation marker expression. Transplanted HFP was monitored for in vivo function through IP-GTT. (A) Representative images of the graft on the day of transplantation (Day 0 Graft) and after 32 weeks. Scale = 0.5 cm. (B) Blood glucose values during IP-GTT at 12, 25, and 32 weeks post-transplantation compared to diabetic non-transplanted controls. (C) Area under the curve (AUC) values for the IP-GTT curves. Gray asterisks indicate statistical comparison to the diabetic control, while light purple asterisks indicate statistical comparison to Week 12. (D) Serum human C-peptide levels in fasted and stimulated (15 min after glucose injection) states. (E) Representative images of immunofluorescent staining of 32 weeks grafts for maturation markers (in red) CHGB (a), G6PC2 (b), IAPP (c), GLUT1 (d), MAFA (e), FAM159B (f). Scale = 50 microns. (ns = not significant, **p < 0.01, ***p < 0.001).

Similar articles

Cited by

References

    1. Aghazadeh Y., Sarangi F., Poon F., Nkennor B., McGaugh E. C., Nunes S. S., et al. (2022). GP2-enriched pancreatic progenitors give rise to functional beta cells in vivo and eliminate the risk of teratoma formation. Stem Cell Rep. 17 (4), 964–978. 10.1016/j.stemcr.2022.03.004 - DOI - PMC - PubMed
    1. Alvarez-Dominguez J. R., Donaghey J., Rasouli N., Kenty J. H. R., Helman A., Charlton J., et al. (2020). Circadian entrainment triggers maturation of human in vitro islets. Cell Stem Cell 26 (1), 108–122. 10.1016/j.stem.2019.11.011 - DOI - PubMed
    1. Arda H. E., Li L., Tsai J., Torre E. A., Rosli Y., Peiris H., et al. (2016). Age-Dependent pancreatic gene regulation reveals mechanisms governing human beta cell function. Cell Metab. 23 (5), 909–920. 10.1016/j.cmet.2016.04.002 - DOI - PMC - PubMed
    1. Augsornworawat P., Maxwell K. G., Velazco-Cruz L., Millman J. R. (2020). Single-cell transcriptome profiling reveals beta cell maturation in stem cell-derived islets after transplantation. Cell Rep. 32 (8), 108067. 10.1016/j.celrep.2020.108067 - DOI - PMC - PubMed
    1. Aye T., Toschi E., Sharma A., Sgroi D., Bonner-Weir S. (2010). Identification of markers for newly formed beta-cells in the perinatal period: A time of recognized beta-cell immaturity. J. Histochem Cytochem 58 (4), 369–376. 10.1369/jhc.2009.954909 - DOI - PMC - PubMed