A multiple comorbidities mouse lung infection model in ApoE‑deficient mice
- PMID: 36846615
- PMCID: PMC9944256
- DOI: 10.3892/br.2023.1603
A multiple comorbidities mouse lung infection model in ApoE‑deficient mice
Abstract
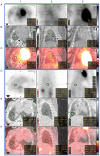
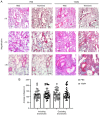
Acute pneumonia is characterised by a period of intense inflammation. Inflammation is now considered to be a key step in atherosclerosis progression. In addition, pre-existing atherosclerotic inflammation is considered to play a role in pneumonia progression and risk. In the present study, a multiple comorbidities murine model was used to study respiratory and systemic inflammation that results from pneumonia in the setting of atherosclerosis. Firstly, a minimal infectious dose of Streptococcus pneumoniae (TIGR4 strain) to produce clinical pneumonia with a low mortality rate (20%) was established. C57Bl/6 ApoE -/- mice were fed a high-fat diet prior to administering intranasally 105 colony forming units of TIGR4 or phosphate-buffered saline (PBS). At days 2, 7 and 28 post inoculation (PI), the lungs of mice were imaged by magnetic resonance imaging (MRI) and positron emission tomography (PET). Mice were euthanised and investigated for changes in lung morphology and changes in systemic inflammation using ELISA, Luminex assay and real-time PCR. TIGR4-inoculated mice presented with varying degrees of lung infiltrate, pleural effusion and consolidation on MRI at all time points up to 28 days PI. Moreover, PET scans identified significantly higher FDG uptake in the lungs of TIGR4-inoculated mice up to 28 days PI. The majority (90%) TIGR4-inoculated mice developed pneumococcal-specific IgG antibody response at 28 days PI. Consistent with these observations, TIGR4-inoculated mice displayed significantly increased inflammatory gene expression [interleukin (IL)-1β and IL-6] in the lungs and significantly increased levels of circulating inflammatory protein (CCL3) at 7 and 28 days PI respectively. The mouse model developed by the authors presents a discovery tool to understand the link between inflammation related to acute infection such as pneumonia and increased risk of cardiovascular disease observed in humans.
Keywords: ApoE-deficient mice; animal model; atherosclerosis; cardiovascular disease; pneumonia.
Copyright: © Bartlett et al.
Conflict of interest statement
GD is Wesfarmers Chair in Cardiology at the University of Western Australia with an Adjunct Professor appointment at UOHI. GD reports 3 paid lectures from AstraZeneca, Pfizer, and Amgen not related to the topic in the manuscript. GD provides consultancy services and also has an equity interest Artrya Pty Ltd. The other authors (BB, SL, HPL, TS, SV, VFCM and GW) have nothing to disclose and declare that they have no competing interests.
Figures


Similar articles
-
Cardiovascular changes after pneumonia in a dual disease mouse model.Sci Rep. 2022 Jul 1;12(1):11124. doi: 10.1038/s41598-022-15507-w. Sci Rep. 2022. PMID: 35778475 Free PMC article.
-
Electronic Cigarette (E-Cigarette) Vapor Exposure Alters the Streptococcus pneumoniae Transcriptome in a Nicotine-Dependent Manner without Affecting Pneumococcal Virulence.Appl Environ Microbiol. 2020 Jan 21;86(3):e02125-19. doi: 10.1128/AEM.02125-19. Print 2020 Jan 21. Appl Environ Microbiol. 2020. PMID: 31791951 Free PMC article.
-
Preclinical models for Chlamydia pneumoniae and cardiovascular disease: hypercholesterolemic mice.Clin Microbiol Infect. 1998 Jan;4 Suppl 4:S23-S32. Clin Microbiol Infect. 1998. PMID: 11869267
-
Intranasal Immunization with the Commensal Streptococcus mitis Confers Protective Immunity against Pneumococcal Lung Infection.Appl Environ Microbiol. 2019 Mar 6;85(6):e02235-18. doi: 10.1128/AEM.02235-18. Print 2019 Mar 15. Appl Environ Microbiol. 2019. PMID: 30683742 Free PMC article.
-
[Investigation of the sensitivities of two different serotypes of Streptococcus pneumoniae in C57BL/6 mice with acute otitis media].Zhonghua Er Bi Yan Hou Tou Jing Wai Ke Za Zhi. 2013 Dec;48(12):1028-31. Zhonghua Er Bi Yan Hou Tou Jing Wai Ke Za Zhi. 2013. PMID: 24507004 Chinese.
Cited by
-
Cellular and molecular characterization of peripheral glia in the lung and other organs.PLoS One. 2024 Dec 2;19(12):e0310303. doi: 10.1371/journal.pone.0310303. eCollection 2024. PLoS One. 2024. PMID: 39621665 Free PMC article.
-
The Risk of Adverse Cardiac Events after Pneumonia in Patients with Coronary Artery Disease.Ann Am Thorac Soc. 2025 Jun;22(6):855-862. doi: 10.1513/AnnalsATS.202407-714OC. Ann Am Thorac Soc. 2025. PMID: 39970394
References
-
- Asthma chronic obstructive pulmonary disease and other respiratory diseases in Australia, Summary. Australian Institute of Health and Welfare https://www.aihw.gov.au/reports/chronic-respiratory-conditions/asthma-ch....
-
- Corrales-Medina VF, Taljaard M, Yende S, Kronmal R, Dwivedi G, Newman AB, Elkind MSV, Lyles MF, Chirinos JA. Intermediate and long-term risk of new-onset heart failure after hospitalization for pneumonia in elderly adults. Am Heart J. 2015;170:306–312. doi: 10.1016/j.ahj.2015.04.028. - DOI - PMC - PubMed
LinkOut - more resources
Full Text Sources
Research Materials
Miscellaneous
