. 2023 Feb 27;11(2):e0385222.
doi: 10.1128/spectrum.03852-22. Online ahead of print.

Comparative and Functional Analyses Reveal Conserved and Variable Regulatory Systems That Control Lasalocid Biosynthesis in Different Streptomyces Species

Affiliations

Comparative and Functional Analyses Reveal Conserved and Variable Regulatory Systems That Control Lasalocid Biosynthesis in Different Streptomyces Species

Minghao Liu et al. Microbiol Spectr. .

Abstract

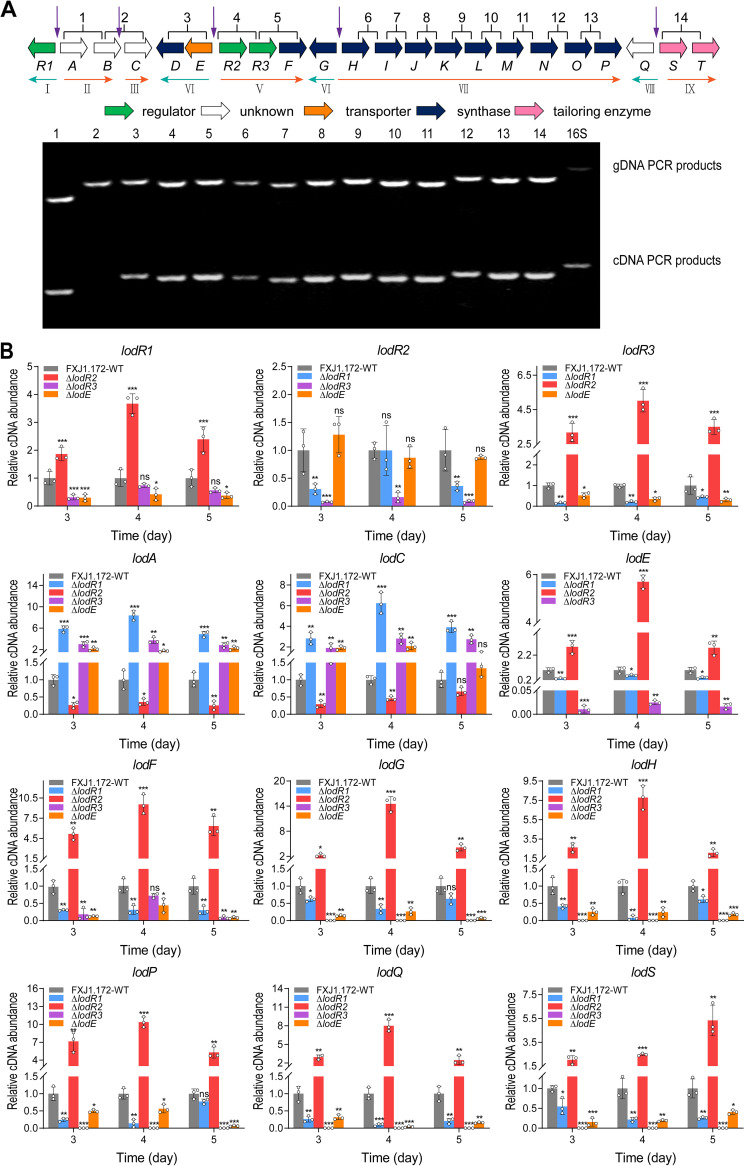
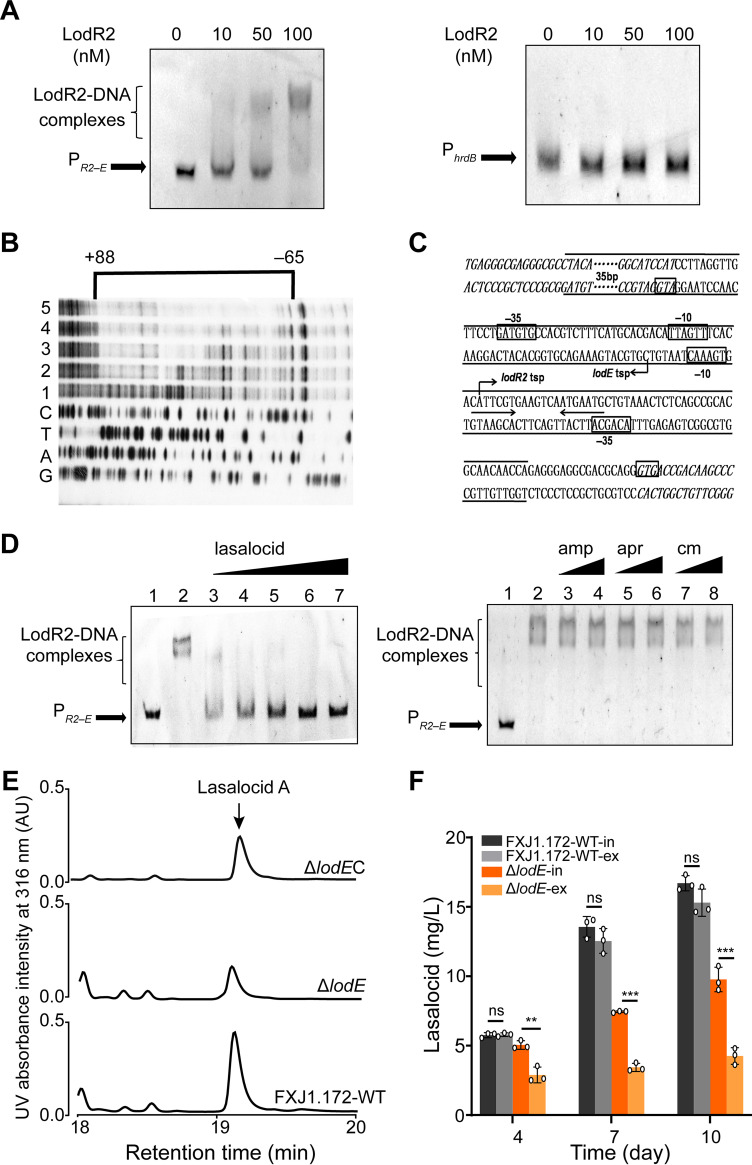
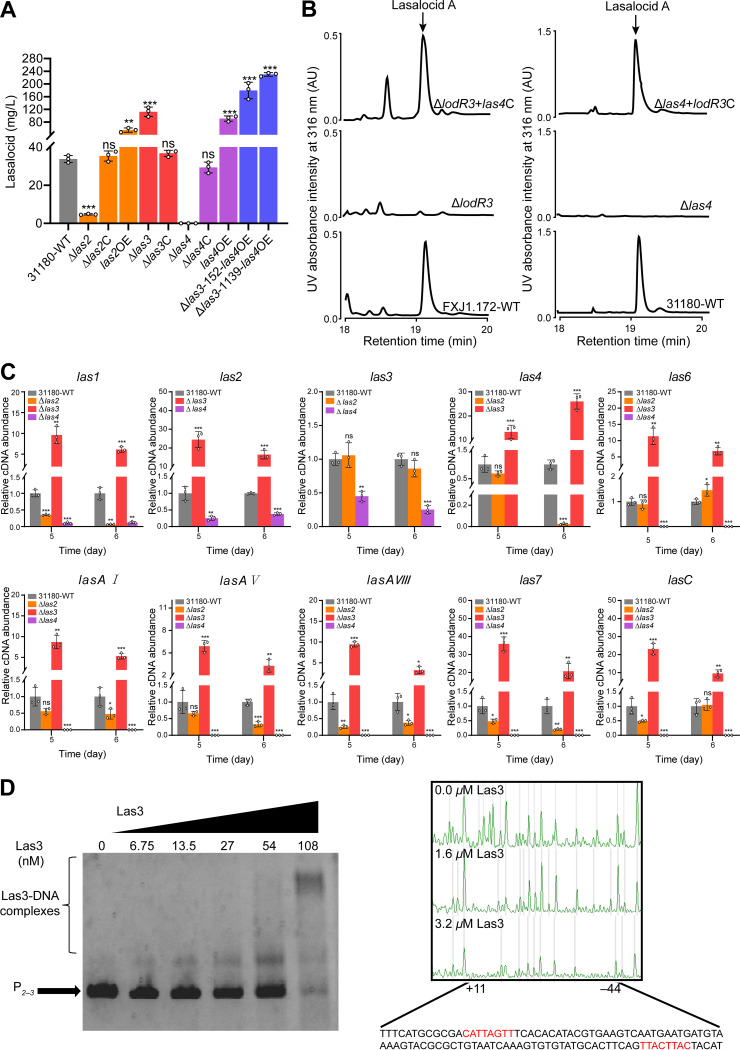
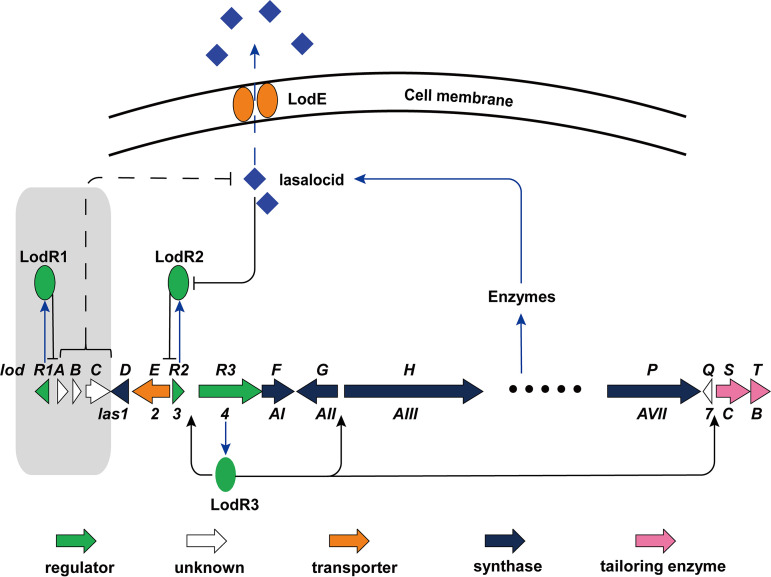
Lasalocid, a representative polyether ionophore, has been successfully applied in veterinary medicine and animal husbandry and also displays promising potential for cancer therapy. Nevertheless, the regulatory system governing lasalocid biosynthesis remains obscure. Here, we identified two conserved (lodR2 and lodR3) and one variable (lodR1, found only in Streptomyces sp. strain FXJ1.172) putative regulatory genes through a comparison of the lasalocid biosynthetic gene cluster (lod) from Streptomyces sp. FXJ1.172 with those (las and lsd) from Streptomyces lasalocidi. Gene disruption experiments demonstrated that both lodR1 and lodR3 positively regulate lasalocid biosynthesis in Streptomyces sp. FXJ1.172, while lodR2 plays a negative regulatory role. To unravel the regulatory mechanism, transcriptional analysis and electrophoretic mobility shift assays (EMSAs) along with footprinting experiments were performed. The results revealed that LodR1 and LodR2 could bind to the intergenic regions of lodR1-lodAB and lodR2-lodED, respectively, thereby repressing the transcription of the lodAB and lodED operons, respectively. The repression of lodAB-lodC by LodR1 likely boosts lasalocid biosynthesis. Furthermore, LodR2 and LodE constitute a repressor-activator system that senses changes in intracellular lasalocid concentrations and coordinates its biosynthesis. LodR3 could directly activate the transcription of key structural genes. Comparative and parallel functional analyses of the homologous genes in S. lasalocidi ATCC 31180T confirmed the conserved roles of lodR2, lodE, and lodR3 in controlling lasalocid biosynthesis. Intriguingly, the variable gene locus lodR1-lodC from Streptomyces sp. FXJ1.172 seems functionally conserved when introduced into S. lasalocidi ATCC 31180T. Overall, our findings demonstrate that lasalocid biosynthesis is tightly controlled by both conserved and variable regulators, providing valuable guidance for further improving lasalocid production. IMPORTANCE Compared to its elaborated biosynthetic pathway, the regulation of lasalocid biosynthesis remains obscure. Here, we characterize the roles of regulatory genes in lasalocid biosynthetic gene clusters of two distinct Streptomyces species and identify a conserved repressor-activator system, LodR2-LodE, which could sense changes in the concentration of lasalocid and coordinate its biosynthesis with self-resistance. Furthermore, in parallel, we verify that the regulatory system identified in a new Streptomyces isolate is valid in the industrial lasalocid producer and thus applicable for the construction of high-yield strains. These findings deepen our understanding of regulatory mechanisms involved in the production of polyether ionophores and provide novel clues for the rational design of industrial strains for scaled-up production.

Keywords: Streptomyces; biosynthesis regulation; biosynthetic gene cluster; lasalocid; regulatory diversification; repressor-activator system.


Conflict of interest statement

The authors declare no conflict of interest.

Figures

FIG 1
FIG 1
Comparison of the genetic organizations of different lasalocid biosynthetic gene clusters. The figure was obtained using Easyfig, where grayscale bars represent regions of shared similarity according to BLASTN analysis.
FIG 2
FIG 2
HPLC analysis of lasalocid A production in the Streptomyces sp. FXJ1.172 wild type (FXJ1.172-WT) and its derivatives after fermentation for 240 h. ΔlodR1, ΔlodR2, and ΔlodR3 represent lodR1, lodR2, and lodR3 mutants, respectively, constructed by disruptive in-frame deletion; ΔlodR1C, ΔlodR2C, and ΔlodR3C represent the corresponding complemented strains of the mutants. AU, arbitrary units.
FIG 3
FIG 3
Transcriptional analysis of the lod cluster. (A) Cotranscriptional analysis of the lod genes by RT-PCR. The regions used for PCR amplification are labeled 1 to 14; the operons (I to IX) and their transcriptional directions are marked by horizontal arrows. Total RNAs were isolated from FXJ1.172-WT after incubation for 96 h and used for synthesizing cDNA. The genomic DNA (gDNA) was used as a positive control for the template. The 16S rRNA gene was used as a positive control for the genes. All potential interoperonic promoter regions are indicated by vertical arrows. (B) Transcriptional analysis of representative genes in lod from the FXJ1.172-WT, ΔlodR1, ΔlodR2, ΔlodR3, and ΔlodE strains by RT-qPCR. Total RNAs were isolated from the strains after incubation for 72, 96, and 120 h. The relative transcript level of each gene was normalized against the level of the internal reference gene (16S rRNA) at the corresponding time points. Error bars show the standard deviations from three independent experiments. Data for the mutants were compared to those for FXJ1.172-WT, and statistical significance was determined by Student’s t test. *, P < 0.05; **, P < 0.01; ***, P < 0.001; ns, not significant.
FIG 4
FIG 4
Functional characterization of the regulator LodR1 in lasalocid biosynthesis. (A) EMSA of LodR1 binding to the intergenic region of lodR1lodA. All potential promoters indicated in Fig. 3A and the intergenic region of lodR2–lodR3 were used for EMSAs. PR1A and PhrdB indicate the intergenic region of lodR1–lodA and the promoter region of hrdB, respectively. (B) Determination of LodR1-binding sites on PR1–A by footprinting experiments. The concentrations of LodR1 used in lanes 1 to 5 were 0, 0.2, 0.4, 0.8, and 1.0 μM, respectively. The bracket denotes the region protected by LodR1, and the numbers at the top indicate the distances relative to the transcription start point (TSP) of lodA. (C) Nucleotide sequences of the lodR1–lodA intergenic region and LodR1-binding sites. The predicted TSP is indicated by a bent arrow. The LodR1-binding sites identified in the footprinting experiment are indicated between long lines, and the putative −10 and −35 regions are marked by boxes. The coding regions of lodA and lodR1 are italicized. The inverted repeats are marked by arrows. (D) HPLC analysis of lasalocid A production in the Streptomyces lasalocidi ATCC 31180T wild type (31180-WT) and its derivatives 31180-KABC and 31180-R1ABC after fermentation for 240 h. 31180-KABC contains plasmid pSET152 with locus lodA–C driven by PkasO*, and 31180-R1ABC contains plasmid pSET152 with locus lodR1–C.
FIG 5
FIG 5
Functional characterization of the regulator LodR2 in lasalocid biosynthesis. (A) EMSA of LodR2 binding to the intergenic region of lodElodR2. All potential promoters indicated in Fig. 3A and the intergenic region of lodR2–lodR3 were used for EMSAs. PR2–E and PhrdB indicate the intergenic region of lodR2lodE and the promoter region of hrdB, respectively. (B) Determination of LodR2-binding sites on PR2–E by footprinting experiments. The concentrations of LodR2 used in lanes 1 to 5 were 0, 0.2, 0.4, 0.8, and 1.0 μM, respectively. The bracket denotes the region protected by LodR2, and the numbers at the top indicate the distances relative to the TSP of lodE. (C) Nucleotide sequences of the lodR2–lodE intergenic region and LodR2-binding sites. The predicted TSP is indicated by a bent arrow. The LodR2-binding sequences identified in the footprinting experiment are indicated between long lines, and the putative −10 and −35 regions are marked by boxes. The coding regions of lodE and lodR2 are italicized. The inverted repeats are marked by arrows. (D) Effects of different antibiotics on the DNA-binding activity of LodR2. Each lane contained probe PR2–E. Lanes 2 to 7 contained 100 nM LodR2. (Left) Effects of lasalocid. Lanes 3 to 7 contained 0.4, 0.8, 1.6, 3.2, and 6.4 μM lasalocid, respectively. (Right) Effects of ampicillin (amp), apramycin (apr), and chloromycetin (cm). Lanes 3 to 7 contained the antibiotics at a concentration of 3.2 or 6.4 μM. (E) HPLC analysis of lasalocid A production in FXJ1.172-WT and its ΔlodE and ΔlodEC derivatives after fermentation for 240 h. ΔlodE, lodE-disruptive in-frame deletion mutant; ΔlodEC, lodE-complemented ΔlodE strain. (F) Intracellular (in) and extracellular (ex) distributions of lasalocid in FXJ1.172-WT and the ΔlodE mutant. Error bars show the standard deviations from three independent experiments. Statistical significance was determined by Student’s t test. *, P < 0.05; **, P < 0.01; ***, P < 0.001; ns, not significant.
FIG 6
FIG 6
Determination of the potential target genes of LodR3 by gusA transcriptional fusion assays. (A) Schematic diagram of gusA transcriptional fusions. Plasmid pSET152::PkasO*-lodR3 was used to overexpress lodR3, and the pIJ10500::Px-gusA plasmid contains a reporter gene, gusA, driven by the promoter (Px) of lodC, lodR3, lodG, lodH, lodQ, or lodS. Both pSET152::PkasO*-lodR3 and pIJ10500::Px-gusA plasmids were introduced into S. coelicolor M1146 to determine the target genes of LodR3. (B) Chromogenic GUS assays of S. coelicolor M1146 derivatives. Potential promoters tested and their directions of transcription initiation are indicated by vertical and horizontal arrows, respectively. MPx(−) strains contain only pIJ10500::Px-gusA plasmids, and MPx(+) strains contain both pIJ10500::Px-gusA and pSET152::PkasO*-lodR3 plasmids.
FIG 7
FIG 7
Parallel functional verification of the lodE, lodR2, and lodR3 homologs in las from S. lasalocidi ATCC 31180T and construction of high-yield lasalocid-producing strains. (A) Lasalocid A production in the S. lasalocidi ATCC 31180T wild type (31180-WT) and its derivatives. Δlas2, Δlas3, and Δlas4 denote las2, las3, and las4 disruption mutants, respectively; Δlas2C, Δlas3C, and Δlas4C denote the corresponding complemented strains of the disruption mutants; and Δlas3-152-las4OE and Δlas3-1139-las4OE denote las4 overexpressed in the Δlas3 mutant via vector pSET152::PkasO*las4 and vector pKC1139::PkasO*las4, respectively. (B) HPLC analysis of lasalocid A production in the ΔlodR3 mutant cross-complemented with las4lodR3+las4C) and the Δlas4 mutant cross-complemented with lodR3las4+lodR3C). (C) Transcriptional analysis of representative genes in las from the 31180-WT, Δlas2, Δlas3, and Δlas4 strains by RT-qPCR. Total RNAs were isolated from the strains after incubation for 120 and 144 h. The relative transcript levels of each gene were normalized against the level of the internal reference gene (16S rRNA) at the corresponding time points. Error bars show the standard deviations from three independent experiments. Data for the mutants were compared to those for 31180-WT, and statistical significance was determined by Student’s t test. *, P < 0.05; **, P < 0.01; ***, P < 0.001; ns, not significant. (D) EMSA and footprinting experiment of Las3. P2–3 represents the intergenic region of las2 and las3, and the Las3-protected sequence in P2–3 is indicated at the bottom of the graph, with the 8-bp palindromic sequence in red.
FIG 8
FIG 8
Putative regulatory model for lasalocid production in Streptomyces. The lodR1–lodC locus found exclusively in Streptomyces sp. FXJ1.172 is highlighted in a light-gray background. Black arrows, activation; black bars, repression; dashed line, the mechanism of repressing lasalocid production needs to be further clarified.

References

    1. Berdy J. 2005. Bioactive microbial metabolites—a personal view. J Antibiot 58:1–26. doi:10.1038/ja.2005.1. - DOI - PubMed
    1. Kevin DA, Meujo DAF, Hamann MT. 2009. Polyether ionophores: broad-spectrum and promising biologically active molecules for the control of drug-resistant bacteria and parasites. Expert Opin Drug Discov 4:109–146. doi:10.1517/17460440802661443. - DOI - PMC - PubMed
    1. Huczynski A. 2012. Polyether ionophores—promising bioactive molecules for cancer therapy. Bioorg Med Chem Lett 22:7002–7010. doi:10.1016/j.bmcl.2012.09.046. - DOI - PubMed
    1. Johnson SM, Herrin J, Liu S, Paul IC. 1970. Crystal and molecular structure of barium salt of an antibiotic containing a high proportion of oxygen. J Am Chem Soc 92:4428–4435. doi:10.1021/ja00717a047. - DOI - PubMed
    1. Mitrovic M, Schildknecht EG, Marusich WL. 1975. Comparative anticoccidial activity and compatibility of lasalocid in broiler chickens. Poult Sci 54:757–761. doi:10.3382/ps.0540757. - DOI

LinkOut - more resources