

Chemical conversion of human conventional PSCs to TSCs following transient naive gene activation
- PMID: 36847616
- PMCID: PMC10074076
- DOI: 10.15252/embr.202255235
Chemical conversion of human conventional PSCs to TSCs following transient naive gene activation
Abstract
In human embryos, naive pluripotent cells of the inner cell mass (ICM) generate epiblast, primitive endoderm and trophectoderm (TE) lineages, whence trophoblast cells derive. In vitro, naive pluripotent stem cells (PSCs) retain this potential and efficiently generate trophoblast stem cells (TSCs), while conventional PSCs form TSCs at low efficiency. Transient histone deacetylase and MEK inhibition combined with LIF stimulation is used to chemically reset conventional to naive PSCs. Here, we report that chemical resetting induces the expression of both naive and TSC markers and of placental imprinted genes. A modified chemical resetting protocol allows for the fast and efficient conversion of conventional PSCs into TSCs, entailing shutdown of pluripotency genes and full activation of the trophoblast master regulators, without induction of amnion markers. Chemical resetting generates a plastic intermediate state, characterised by co-expression of naive and TSC markers, after which cells steer towards one of the two fates in response to the signalling environment. The efficiency and rapidity of our system will be useful to study cell fate transitions and to generate models of placental disorders.
Keywords: chemical resetting; naive pluripotency; placenta; pluripotent stem cells; trophoblast stem cells.
© 2023 The Authors. Published under the terms of the CC BY NC ND 4.0 license.
Conflict of interest statement
The authors declare that they have no conflict of interest.
Figures
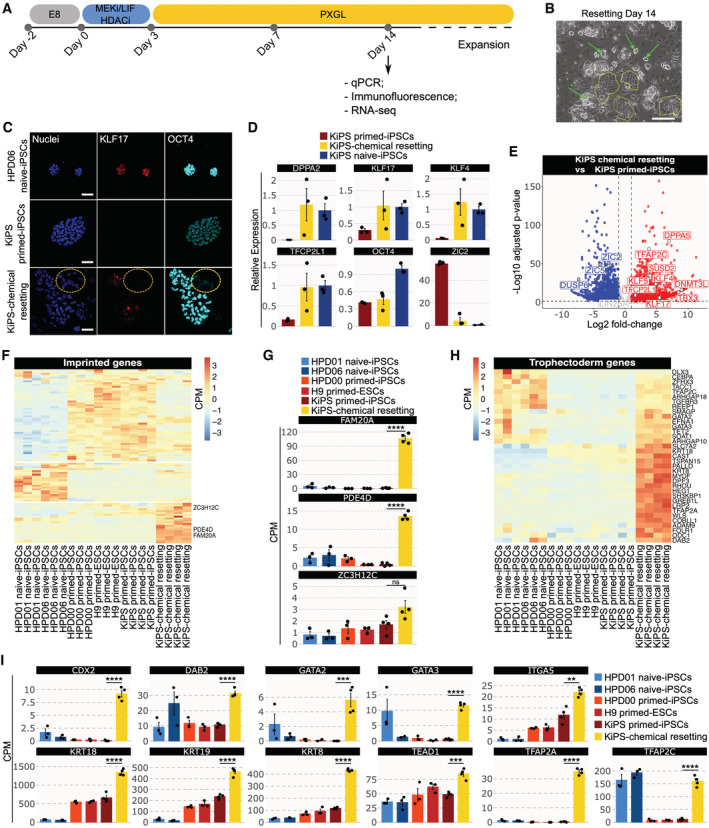
- A
Experimental strategy for chemical resetting of human primed/conventional PSCs to naive pluripotency.
- B
Morphology of KiPS‐chemical resetting after 14 days. Scale bar: 200 μm.
- C
Immunostaining for the naive pluripotency marker KLF17 and the shared pluripotency marker OCT4. Scale bar: 50 μm.
- D
Gene expression analysis by qPCR of KiPS primed‐iPSCs, KiPS‐chemical resetting at day 14 and KiPS naive‐iPSCs.
- E
Transcriptome analysis of KiPS‐chemical resetting compared with KiPS primed‐iPSCs. Known primed pluripotency and naive pluripotency markers are highlighted.
- F
Heatmap of 93 imprinted genes detected in pluripotent cells. Three placental imprinted genes are highlighted.
- G
Barplots showing the absolute expression (CPM) of three placental imprinted genes in the reported conditions highlighted in different colours.
- H
Heatmap of trophoblast‐specific genes upregulated in KiPS‐chemical resetting vs. KiPS primed‐iPSCs comparison.
- I
Barplots showing the absolute expression (CPM) of 12 trophoblast genes found to be significantly upregulated in KiPS‐chemical resetting vs KiPS primed‐iPSCs comparison.
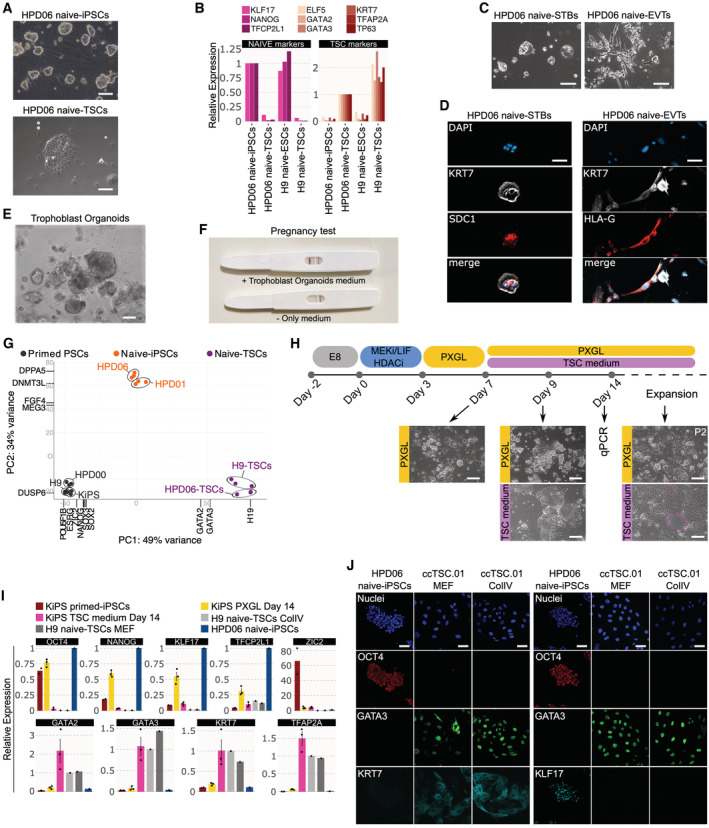
- A
Phase‐contrast images of HPD06 naive‐iPSCs and TSCs derived from HPD06 naive‐iPSCs. Scale bars: 100 μm.
- B
Gene expression analysis by RT–qPCR for naive (KLF17, TFCP2L1 and NANOG) and trophoblast (GATA3, GATA2, KRT7, ELF5, TP63 and TFAP2A) marker genes in naive‐iPSCs and TSC cells derived from two different naive‐iPSC lines (HPD06 and H9).
- C
Phase‐contrast images of syncytium trophoblast cells (STBs) derived from HPD06 naive‐TSCs (HPD06 naive‐STBs) and extravillous trophoblast cells (EVTs) derived from HPD06 naive‐TSCs (HPD06 naive‐EVTs). Scale bars: 50 μm.
- D
Left: Immunostaining for KRT7 and the syncytium trophoblast marker SDC1 of HPD06 naive‐STBs. Scale bars: 50 μm. Right: Immunostaining for KRT7 and the extravillous trophoblast marker HLA‐G of HPD06 naive‐EVTs. Scale bars: 25 μm.
- E
Phase‐contrast images of trophoblast organoids derived from HPD06 naive‐TSCs. Scale bar: 100 μm.
- F
Pregnancy test detecting human chorionic gonadotropin in trophoblast organoid medium.
- G
Principal component analysis of primed‐iPSCs (HPD00, H9 and KiPS), naive‐iPSCs (HPD06 and HPD01), and TSC cells derived from naive‐iPSCs (HPD06 naive‐TSCs and H9 naive‐TSCs) performed on the top 5,000 most variable genes identified through RNA‐seq.
- H
Experimental scheme of the conversion of conventional PSCs into naive PSCs or TSCs. Morphologies of cells at day 7, day 9 and after 2 passages are shown. Scale bars: 200 μm.
- I
Gene expression analysis by qPCR of KiPS primed‐iPSCs, KiPS in PXGL medium at day 14, KiPS in TSC medium at day 14, H9 naive‐TSCs on ColIV, H9 naive‐TSCs on MEF and HPD06 naive‐iPSCs.
- J
Immunostaining for the pluripotency markers OCT4 and KLF17, and the TSC markers GATA3 and KRT7 of HPD06 naive‐iPSC and ccTSC.01 cultured on MEF and on collagen IV (ColIV) after 3 passages. Scale bars: 30 μm.
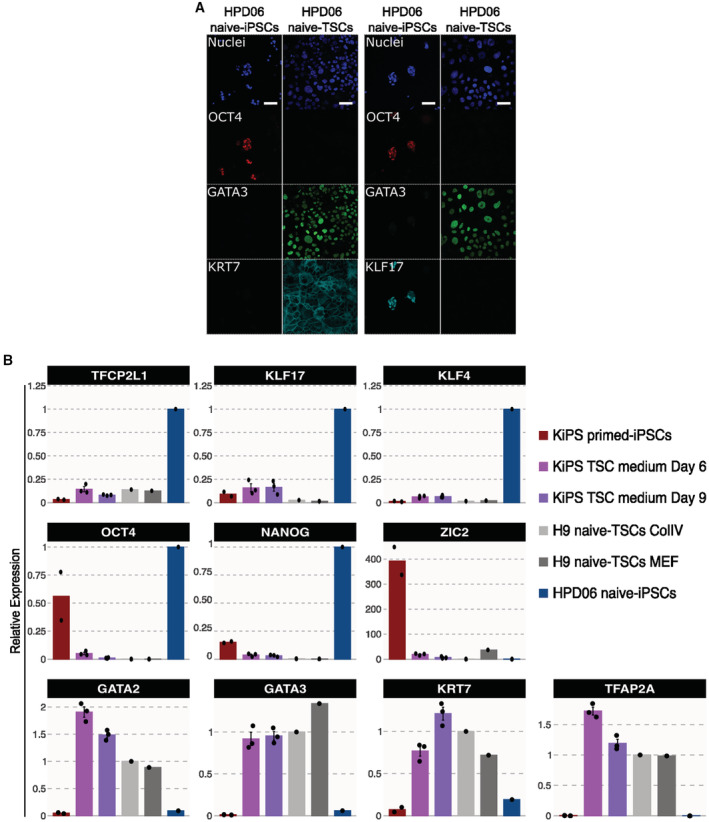
- A
Immunostaining for the pluripotency markers OCT4, KLF17 and the TSC markers GATA3 and KRT7 of HPD06 naive‐iPSC and TSC cells derived from naive‐iPSCs (HPD06 naive‐TSCs). Scale bars: 30 μm.
- B
Gene expression analysis by RT–qPCR of KiPS primed‐iPSCs, KiPS in TSC medium at day 6 and 9, H9 naive‐TSCs cultured on ColIV or MEF, and HPD06 naive iPSCs.
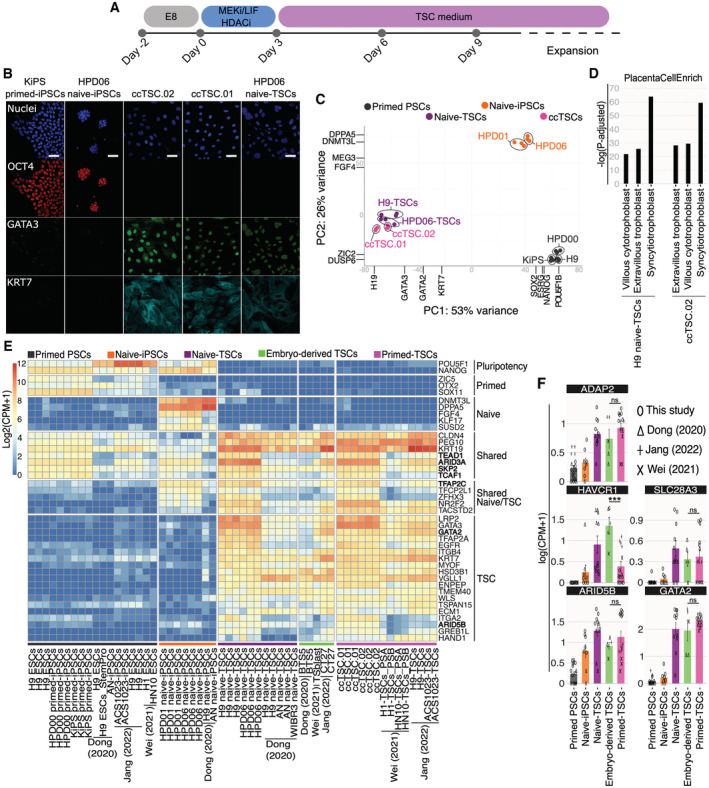
- A
Experimental scheme of the conversion of primed PSCs towards ccTSCs.
- B
Immunostaining for the pluripotency markers OCT4, and the TSC markers GATA3 and KRT7 of KiPS primed‐iPSCs, HPD06 naive‐iPSCs, ccTSC.02 at passage 4, ccTSC.01 at passage 4 and HPD06 naive‐TSCs. Scale bars: 30 μm.
- C
Principal component analysis of ccTSCs (ccTSC.01 and ccTSC.02) with primed PSCs (HPD00, H9, and KiPS), naive‐iPSCs (HPD06 and HPD01) and TSCs derived from naive‐iPSCs (HPD06 naive‐TSCs and H9 naive‐TSCs) performed on the top 5,000 most variable genes identified through RNA‐seq.
- D
Barplot showing placenta cell‐specific expression patterns in ccTSC.02 and TSCs derived from naive‐iPSCs (H9 naive‐TSCs).
- E
Heatmap of general, primed, naive, shared, shared between naive and TSCs, and trophoblast‐specific genes in primed‐PSCs, naive‐iPSCs, naive‐TSCs, embryo‐derived TSCs and TSCs derived from primed PSCs (primed‐TSCs) in our study or from published data.
- F
Barplots showing the absolute expression as log(CPM + 1) of ADAP2, HAVCR1, SLC28A3, ARID5B and GATA2 in the reported conditions.
- A
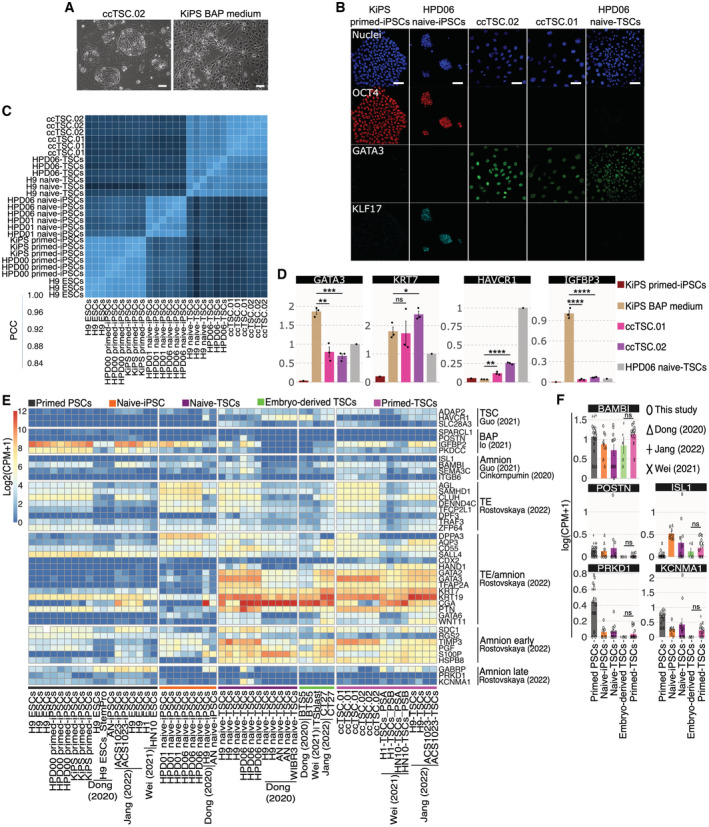
Phase‐contrast images of ccTSC.02 at passage 5 and of BAP‐treated KiPS after 3 days of treatment. Scale bar: 200 μm.
- B
Immunostaining for the pluripotency markers OCT4, KLF17 and the TSC marker GATA3 of KiPS primed‐iPSCs, HPD06 naive‐iPSCs, ccTSC.02 at passage 4, ccTSC.01 at passage 4 and HPD06 naive‐TSCs. Scale bars: 30 μm.
- C
Correlation plot of primed PSCs (H9, HPD00 and KiPS), naive‐iPSCs (HPD01 and HPD06), and TSC cells derived from naive‐iPSCs (H9 naive‐TSCs and HPD06 naive‐TSCs) and ccTSCs (ccTSC.01 and ccTSC.02).
- D
Gene expression analysis by qPCR of KiPS primed‐iPSCs, KiPS in BAP medium, KiPS ccTSC.01, KiPS ccTSC.02 and HPD06 naive‐TSCs.
- E
Heatmap of TSC, BAP, amnion, TE, TE/amnion, amnion early, amnion late specific genes in primed PSCs, naive‐iPSC, naive‐TSCs, Embryo‐derived TSCs and primed‐TSCs from our study or from published data.
- F
Barplots showing the absolute expression as log(CPM + 1) of amnion markers in the reported conditions.
- A
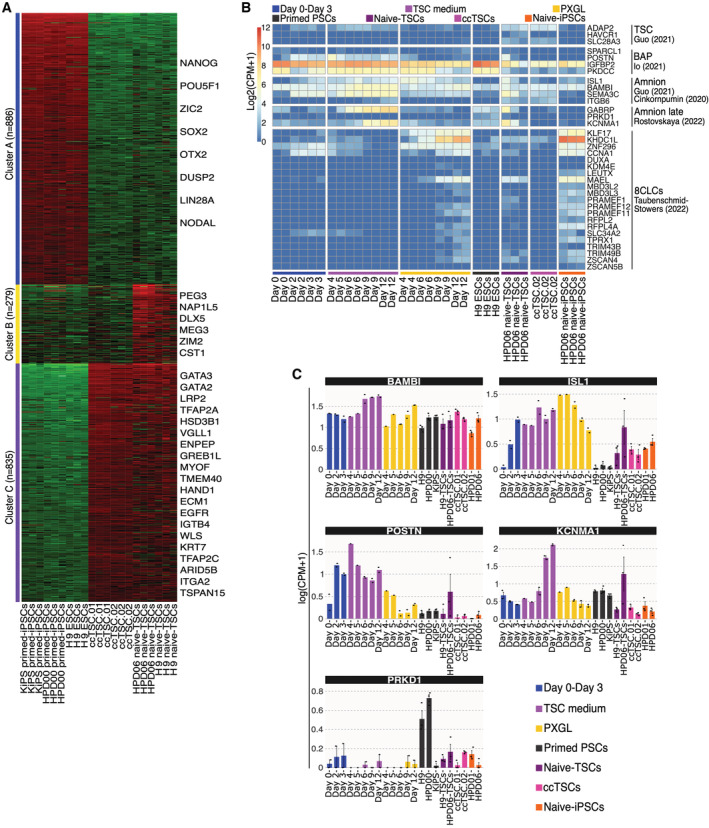
K‐means clustering of the 2000 most variable genes in primed‐iPSCs (KiPS primed‐iPSCs, HPD00 primed‐iPSCs and H9 ESCs), ccTSCs (ccTSC.01 and ccTSC.02), and naive‐TSCs (HPD06 naive‐TSC and H9 naive‐TSCs). Red and green indicate high and low expression, respectively. Representative genes of each cluster are shown.
- B
Heatmap of TSC, BAP, amnion, amnion late and 8CLCs specific genes during the conversion of conventional PSCs into TSCs or naive‐iPSCs, with primed‐ESCs (H9), TSCs derived from naive‐iPSCs (HPD06 naive‐TSCs), ccTSC.02 and naive‐iPSCs (HPD06).
- C
Barplots showing the absolute expression as log(CPM + 1) of amnion markers (BAMBI, ISL1, POSTN, KCNMAI and PRKD1) in the reported conditions highlighted in different colours.
- A
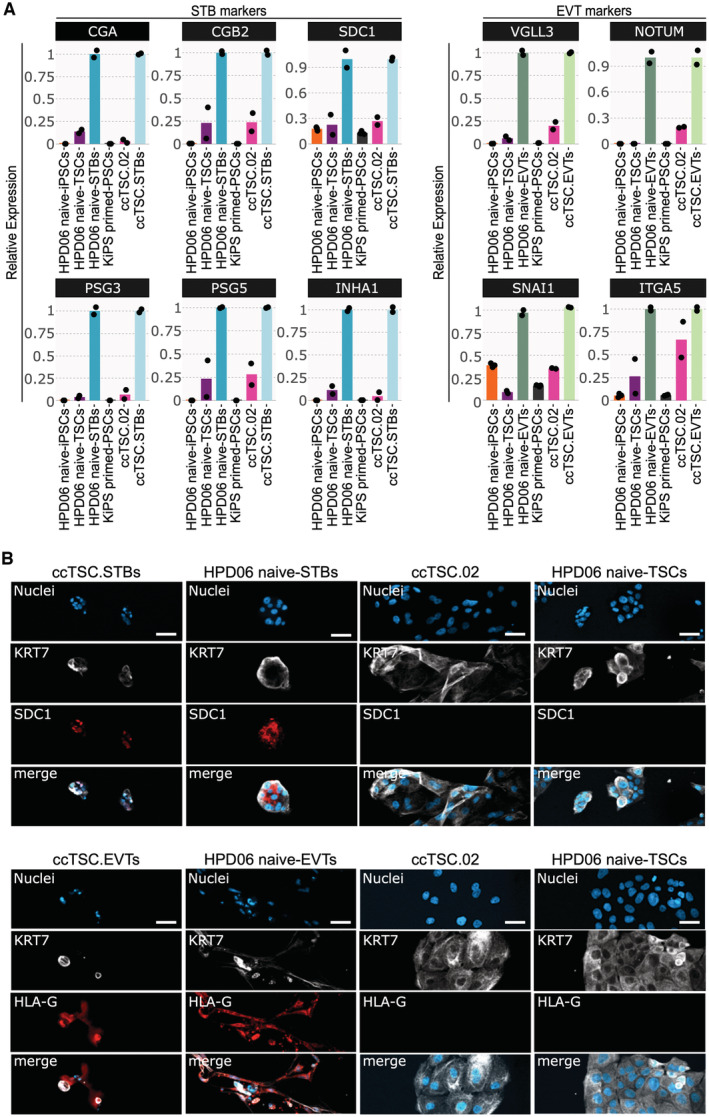
Gene expression analysis by qPCR of syncytiotrophoblast (left) and extravillous (right) markers.
- B
Top: Immunostaining for the TSC marker KRT7 and the STB marker SDC1 of ccTSC.02‐STBs, HPD06 naive‐STBs, ccTSC.02 and HPD06 naive‐TSCs. Scale bars: 50 μm. Bottom: Immunostaining for the TSC marker KRT7 and the EVT marker HLA‐G of ccTSC.02‐EVTs, HPD06 naive‐EVTs, ccTSC.02 and HPD06 naive‐TSCs. Scale bars: 25 μm.
- A
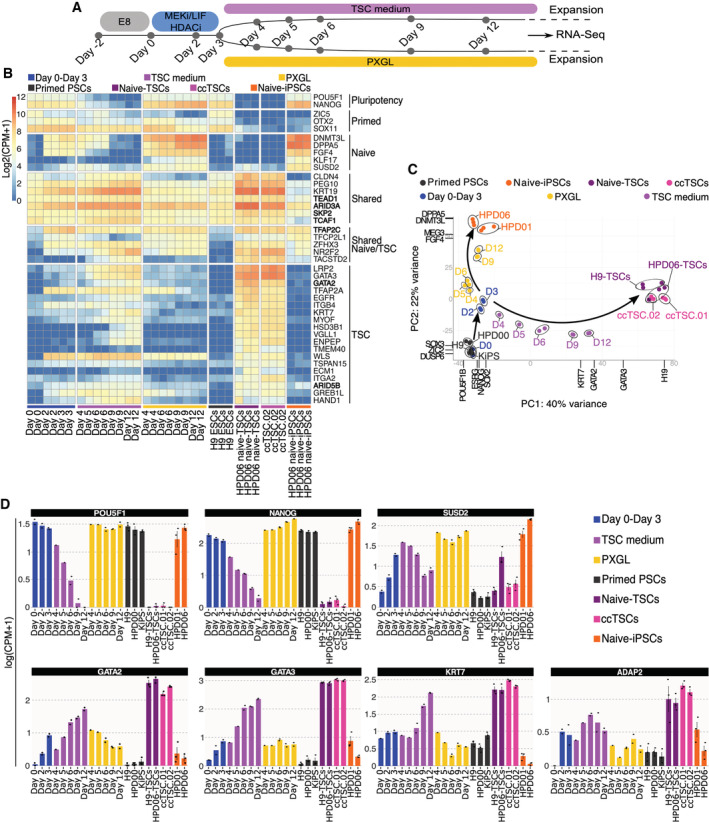
Experimental scheme of the conversion of conventional PSCs into naive‐iPSCs or TSCs.
- B
Heatmap of primed, naive and trophoblast‐specific genes during the conversion of conventional PSCs into TSCs or naive‐iPSCs, with primed‐ESCs (H9), TSCs derived from naive‐iPSCs (HPD06 naive‐TSCs), ccTSC.02 and naive‐iPSCs (HPD06).
- C
Principal component analysis of the time point conversion of conventional PSCs into naive‐iPSCs or TSCs, with primed‐PSC (HPD00, H9 and KiPS), naive‐iPSCs (HPD06 and HPD01), TSCs derived from naive‐iPSCs (HPD06 naive‐TSCs and H9 naive‐TSCs) and ccTSCs (ccTSC.01 and ccTSC.02) and performed on the top 5,000 most variable genes identified through RNA‐seq.
- D
Barplots showing the absolute expression as log(CPM + 1) of general pluripotency (OCT4 and NANOG), naive (SUSD2) and TSC‐specific genes (GATA2, GATA3, KRT7 and ADAP2) in the reported conditions highlighted in different colours.
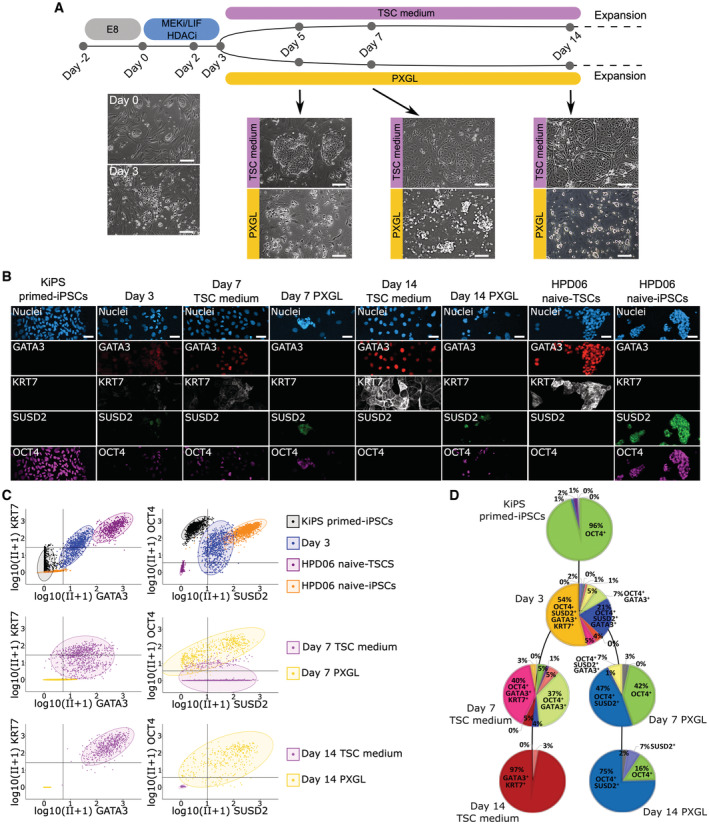
- A
Experimental scheme of the conversion of conventional PSCs into naive‐iPSCs or TSCs. Morphologies of cells at day 0, day 3, day 5, day 7 and day 14 in TSC medium or in PXGL are shown. Scale bars: 200 μm.
- B
Immunostaining for the TSC markers GATA3 and KRT7, the naive pluripotency marker SUSD2 and general pluripotency markers OCT4 of KiPS primed‐iPSCs, KiPS at day 3 of the conversion, KiPS at day 7 in TSC medium or PXGL, KiPS at day 14 in TSC medium or PXGL, HPD06 naive‐TSCs and HPD06 naive‐iPSCs. Scale bars: 25 μm.
- C
Single‐cell scatter plots showing the log(CPM + 1) integrated intensity of TSC markers GATA3 and KRT7, naive pluripotency marker SUSD2 and general pluripotency marker OCT4 of KiPS primed‐iPSCs, KiPS at day 3 of the conversion, KiPS at day 7 in TSC medium or PXGL, KiPS at day 14 in TSCs medium or PXGL, HPD06 naive‐TSCs and HPD06 naive‐iPSCs. Black lines represent the threshold used to define positivity to a given marker.
- D
Pie charts representing patterns of activation of TSC markers GATA3 and KRT7, naive pluripotency marker SUSD2 and general pluripotency marker OCT4 in KiPS primed‐iPSCs, KiPS at day 3 of the conversion, KiPS at day 7 in TSC medium or PXGL, and KiPS at day 14 in TSC medium or PXGL.
References
-
- Bernardo AS, Faial T, Gardner L, Niakan KK, Ortmann D, Senner CE, Callery EM, Trotter MW, Hemberger M, Smith JC et al (2011) BRACHYURY and CDX2 mediate BMP‐induced differentiation of human and mouse pluripotent stem cells into embryonic and extraembryonic lineages. Cell Stem Cell 9: 144–155 - PMC - PubMed
Publication types
MeSH terms
Associated data
- Actions
- Actions
- Actions
- Actions
Grants and funding
LinkOut - more resources
Full Text Sources
Molecular Biology Databases
