. 2023 Mar 19;24(2):bbad061.
doi: 10.1093/bib/bbad061.

IBRAP: integrated benchmarking single-cell RNA-sequencing analytical pipeline

Affiliations

IBRAP: integrated benchmarking single-cell RNA-sequencing analytical pipeline

Connor H Knight et al. Brief Bioinform. .

Abstract

Single-cell ribonucleic acid (RNA)-sequencing (scRNA-seq) is a powerful tool to study cellular heterogeneity. The high dimensional data generated from this technology are complex and require specialized expertise for analysis and interpretation. The core of scRNA-seq data analysis contains several key analytical steps, which include pre-processing, quality control, normalization, dimensionality reduction, integration and clustering. Each step often has many algorithms developed with varied underlying assumptions and implications. With such a diverse choice of tools available, benchmarking analyses have compared their performances and demonstrated that tools operate differentially according to the data types and complexity. Here, we present Integrated Benchmarking scRNA-seq Analytical Pipeline (IBRAP), which contains a suite of analytical components that can be interchanged throughout the pipeline alongside multiple benchmarking metrics that enable users to compare results and determine the optimal pipeline combinations for their data. We apply IBRAP to single- and multi-sample integration analysis using primary pancreatic tissue, cancer cell line and simulated data accompanied with ground truth cell labels, demonstrating the interchangeable and benchmarking functionality of IBRAP. Our results confirm that the optimal pipelines are dependent on individual samples and studies, further supporting the rationale and necessity of our tool. We then compare reference-based cell annotation with unsupervised analysis, both included in IBRAP, and demonstrate the superiority of the reference-based method in identifying robust major and minor cell types. Thus, IBRAP presents a valuable tool to integrate multiple samples and studies to create reference maps of normal and diseased tissues, facilitating novel biological discovery using the vast volume of scRNA-seq data available.

Keywords: analytical pipeline; benchmarking; cell annotation; data integration; single-cell RNA-seq.


Figures

Figure 1
Figure 1
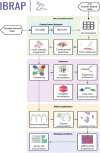
A workflow for scRNA-seq analyses in IBRAP. IBRAP accepts droplet- and non-droplet-based scRNA-seq counts. If the user has processed their cells with droplet-based infrastructure, they may use our droplet-based cleaning packages that we included (DecontX and Scrublet). Otherwise, the user may continue to data transformation encompassed with normalization, highly variable gene selection and, when required, sample integration. After this has been performed, a user then proceeds to inference, where a user will identify cell clusters, identify developmental trajectories, label their cell types using a reference-based package singleR, or a canonical marker-based cell annotation package scType, or infer cell–cell communication. The user can then use our Rshiny application to investigate their results in an easier fashion than using the terminal. Finally, if the user opts for finding cell clusters from the unsupervised clustering, they must uncover the biology driving the clusters to identify their cell types. For this, the user can produce a range of different gene expression plots, differential expression and a Gene Set Enrichment Analysis using ssGSEA.
Figure 2
Figure 2
Individual sample analysis clustering results. (A) Benchmarking metrices: ARI, NMI and ASW for pancreas samples. A higher score indicates a better cluster assignment while a lower score is less favourable. (B) A heatmap showing the highest and lowest performance scores for each possible pipeline combination (x-axis) compared against each sample (y-axis). A higher (100) score is better, while a lower (0) score is worse.
Figure 3
Figure 3
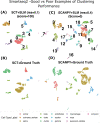
Individual sample cluster assignments. (A, B) UMAP projection for smartseq2 showing good performing cluster assignments compared against their ground truth. (C, D) UMAP projection for smartseq2 showing poor performing cluster assignments compared against their ground truth.
Figure 4
Figure 4
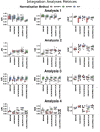
Benchmarks of multi-sample integration analyses. The analyses included Analysis 1: 8 pancreatic samples, Analysis 2: 3 samples with the same cell lines, Analysis 3: 3 samples that contain 3 of the same cell lines but one sample containing two extra and different cell lines and Analysis 4: 1 SymSim simulated sample that contains 3 simulated overt batch effects and five cell types. Benchmarking matrices, ARI, NMI and ASW, calculated based on ground truth cell labels, were shown for the combinations of normalization (Scanpy, Scran and SCTransform) and integration methods (BBKNN, Harmony, Scanorama, Seurat CCA and uncorrected), adjusting other clustering methods and parameters.
Figure 5
Figure 5
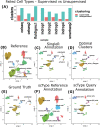
A comparison between unsupervised and supervised clustering. (A) Bar plot containing the number of cell types that were not captured well during supervised and unsupervised clustering analyses. (B) UMAP projection of the reference datasets (celseq, celseq2, fluidigmc1, indrop1, indrop2, indrop3, indrop4) integrated using BBKNN. (CE) UMAP projections of the pancreatic samples sequenced using SmartSeq2. (C) Cell labels derived from singleR supervised analysis using a reference dataset in panel B. (D) smartseq2 cells labelled with cluster assignments that generated the highest score during the unsupervised clustering. (E) Ground truth labels for comparison to the supervised and unsupervised labelling. (F) scType annotation for the optimal clustering for the reference integrated map of seven pancreas samples shown in panel B. (G) scType annotation for the optimal clustering for the smartseq2 sample shown in panels (CE).

Similar articles

Cited by

References

    1. Ziegenhain C, Vieth B, Parekh S, et al. . Comparative analysis of single-cell RNA sequencing methods. Mol Cell 2017;65:631–643.e4. - PubMed
    1. Vieth B, Parekh S, Ziegenhain C, et al. . A systematic evaluation of single cell RNA-seq analysis pipelines. Nat Commun 2019;10:1–11. - PMC - PubMed
    1. Zappia L, Theis FJ. Over 1000 tools reveal trends in the single-cell RNA-seq analysis landscape. Genome Biol 2021;22:301. - PMC - PubMed
    1. Luecken MD, Büttner M, Chaichoompu K, et al. . Benchmarking atlas-level data integration in single-cell genomics. Nat Methods 2022;19:41–50. - PMC - PubMed
    1. Su S, Tian L, Dong X, et al. . CellBench: R/Bioconductor software for comparing single-cell RNA-seq analysis methods. Bioinformatics 2020;36:2288–90. - PMC - PubMed

Publication types