

BCAA insufficiency leads to premature ovarian insufficiency via ceramide-induced elevation of ROS
- PMID: 36847712
- PMCID: PMC10086587
- DOI: 10.15252/emmm.202317450
BCAA insufficiency leads to premature ovarian insufficiency via ceramide-induced elevation of ROS
Abstract
Premature ovarian insufficiency (POI) is a disease featured by early menopause before 40 years of age, accompanied by an elevation of follicle-stimulating hormone. Though POI affects many aspects of women's health, its major causes remain unknown. Many clinical studies have shown that POI patients are generally underweight, indicating a potential correlation between POI and metabolic disorders. To understand the pathogenesis of POI, we performed metabolomics analysis on serum and identified branch-chain amino acid (BCAA) insufficiency-related metabolic disorders in two independent cohorts from two clinics. A low BCAA diet phenotypically reproduced the metabolic, endocrine, ovarian, and reproductive changes of POI in young C57BL/6J mice. A mechanism study revealed that the BCAA insufficiency-induced POI is associated with abnormal activation of the ceramide-reactive oxygen species (ROS) axis and consequent impairment of ovarian granulosa cell function. Significantly, the dietary supplement of BCAA prevented the development of ROS-induced POI in female mice. The results of this pathogenic study will lead to the development of specific therapies for POI.
Keywords: ROS; ceramide; infertility; low BCAA diet; premature ovarian insufficiency.
© 2023 The Authors. Published under the terms of the CC BY 4.0 license.
Conflict of interest statement
The authors declare that they have no conflict of interest.
Figures
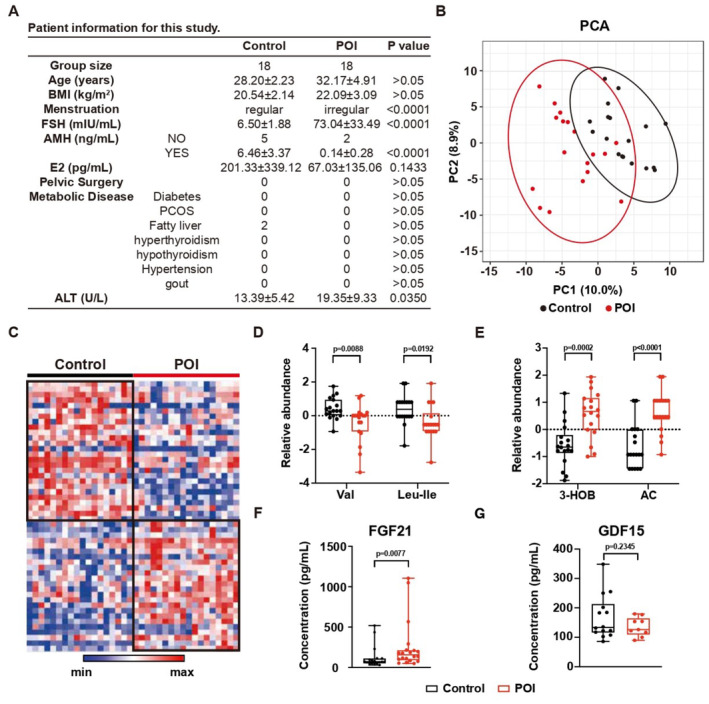
Clinical information of the cohort.
PCA of serum metabolomics. Circles indicate 95% confidence intervals. N = 18.
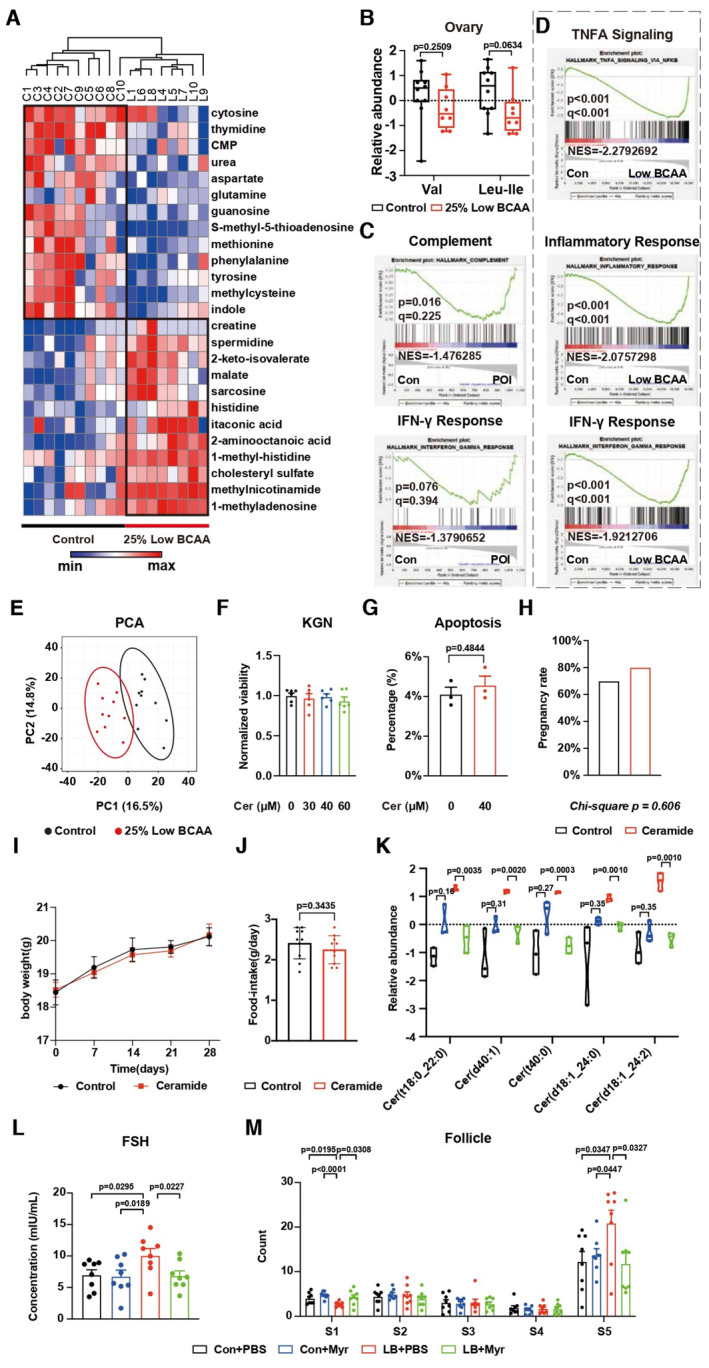
Heatmap showing the relative abundance of the top 75 differential expressed metabolites. N = 18.
The relative abundance of valine (Val) and leucine‐isoleucine (Leu‐Ile). N = 18; Boxplot, central band stands for median, boxes stand for 50% of the data, and whiskers stand for min or max of the data.
The relative abundance of 3‐hydroxybutyrate (3‐HOB) and acetylcarnitine (AC). N = 18; Boxplot, central band stands for median, boxes stand for 50% of the data, and whiskers stand for min or max of the data.
The concentration of FGF21 in serum. Control, N = 18; POI, N = 20; Boxplot, central band stands for median, boxes stand for 50% of the data, whiskers stand for min or max of the data.
The concentration of GDF15 in serum. Control, N = 14; POI, N = 9; Boxplot, central band stands for median, boxes stand for 50% of the data, and whiskers stand for min or max of the data.
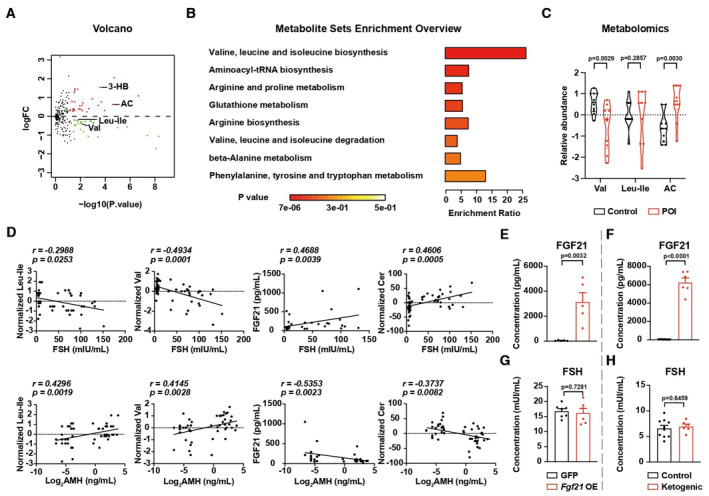
- A
Volcano plot showing the fold‐change and P‐value of metabolites. N = 18.
- B
Enrichment score and P‐value of metabolites downregulated in POI patients. N = 18.
- C
Relative abundance of valine (Val), acetyl‐carnitine (AC) but not leucine‐isoleucine (Leu‐Ile) in the serum of the Shandong Cohort. N = 10; Truncated violin plot, central band stands for median, and dotted lines stand for the upper quartile or the lower quartile of the data.
- D
The correlations between metabolites/FGF21 and clinical parameters. The P and r were calculated by the nonparametric Spearman test. N = 56.
- E, F
The concentration of FGF21 in mouse serum. (E) N = 5; (F) Control N = 10; Ketogenic diet, N = 6.
- G, H
The concentration of FSH in mouse serum. (G) Control, N = 7; Fgf21 OE, N = 6; and (H) control, N = 10; Ketogenic diet, N = 6.
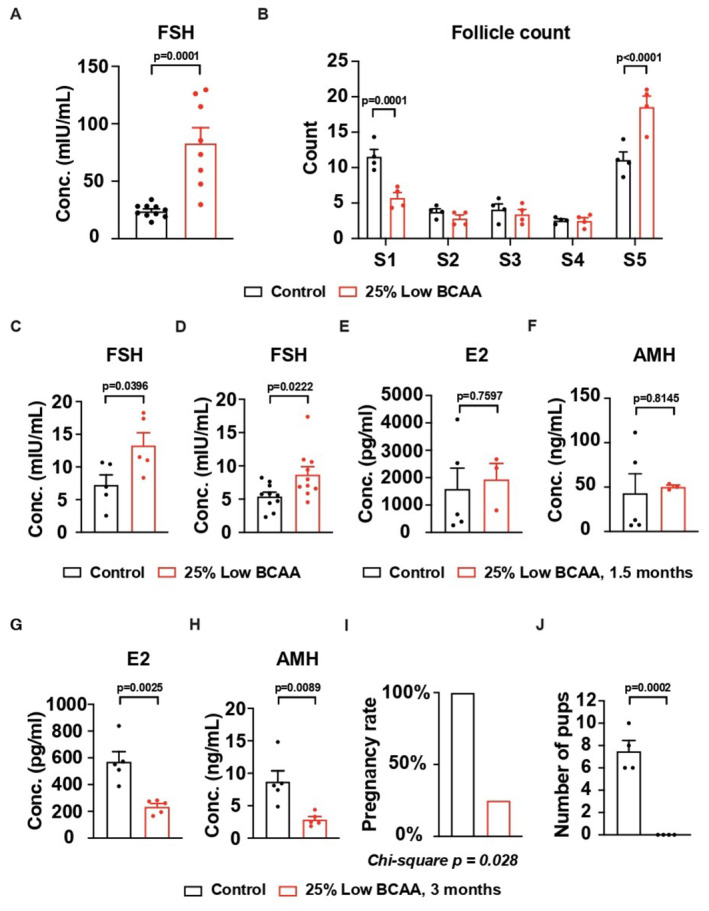
- A, B
The serum concentration of FSH and the changes of follicles in mice on a low BCAA diet for 1.5 months. (A) Control, N = 10; low BCAA, N = 8; (B) Control, N = 4; low BCAA, N = 4.
- C
The serum concentration of FSH in mice on a different batch of the low BCAA diet. N = 5.
- D
The serum concentration of FSH in mice on the low BCAA diet from Research Diet. N = 10.
- E, F
The serum concentration of AMH and E2 in mice on the low BCAA diet for 1.5 months. Control, N = 5; low BCAA, N = 3.
- G, H
The serum concentration of AMH and E2 in mice on the low BCAA diet for 3 months. N = 5.
- I, J
The pregnancy rate and number of pups per pregnancy on the low BCAA diet for 3 months. N = 4.
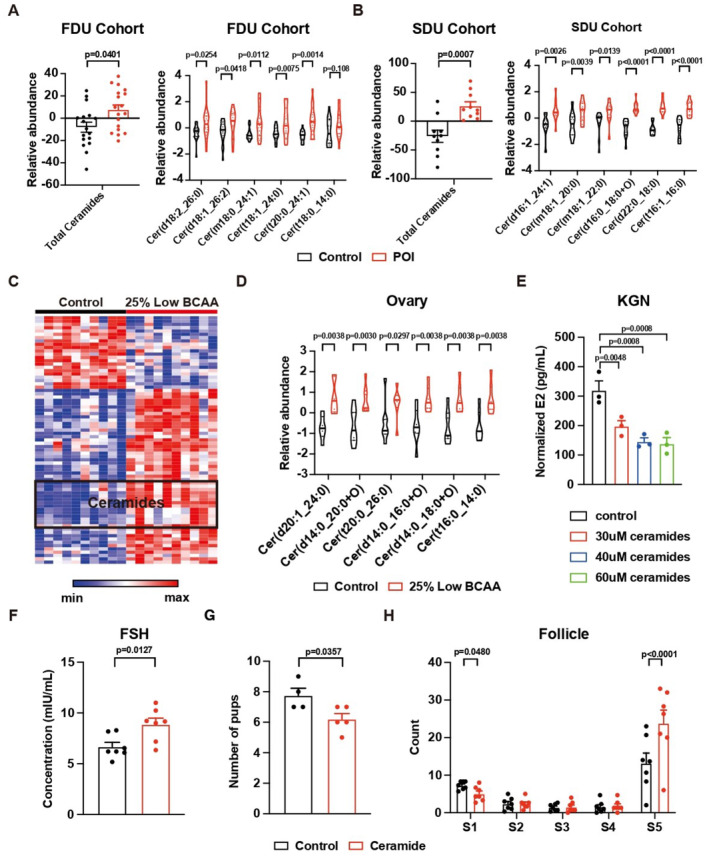
- A, B
Elevation of serum ceramide in POI patients from the Fudan Cohort or the Shandong Cohort. Left, the relative abundance of total ceramide; right, the relative abundance of ceramide with specific acyl chain. (A) N = 18; (B) N = 10; Truncated violin plot, central band stands for median, and dotted lines stand for the upper quartile or the lower quartile of the data.
- C
Heatmap showing the top 75 changed lipids in the serum of mice on a low BCAA diet. N = 10.
- D
Elevation of ceramide in the ovaries of mice on a low BCAA diet. N = 10; Truncated violin plot, central band stands for median, and dotted lines stand for the upper quartile or the lower quartile of the data.
- E
Decreases of E2 secretions from KGN cells treated with ceramide. N = 3.
- F
The serum concentration of FSH in mice with ceramide treatment. N = 7.
- G
Number of pups from mice with ceramide treatment. Control, N = 4; ceramide treatment, N = 5.
- H
The changes in follicle count from mice with ceramide treatment. N = 7.
- A
Heatmap showing the top 25 differentially abundant metabolites in the ovaries of mice on a low BCAA diet. Control, N = 10; low BCAA, N = 8.
- B
The relative abundance of BCAAs in the ovaries of mice on a low BCAA diet. Control, N = 10; low BCAA, N = 8; Boxplot, central band stands for median, boxes stand for 50% of the data, and whiskers stand for min or max of the data.
- C
GSEA of the proteomics data in the serum of the Fudan Cohort. N = 11.
- D
GSEA of RNA‐seq data from the liver in the mice on a low BCAA diet or control diet. N = 6.
- E
The PCA of serum from mice on a low BCAA diet or control diet. N = 10.
- F
The relative cell viability of KGN cells with ceramide treatment. N = 6.
- G
The percentage of Annexin V positive cells of KGN cells with ceramide treatment. N = 3.
- H–J
The pregnancy rate, body weight, and food intake from mice with ceramide treatment. N = 10.
- K
The relative abundance of ceramide in the serum of mice with myriocin treatment. N = 3; Truncated violin plot, central band stands for median, and dotted lines stand for the upper quartile or the lower quartile of the data.
- L
The serum concentration of FSH in mice with ceramide treatment. N = 8.
- M
The changes in follicle count from mice with ceramide treatment. N = 8.
- A
GSEA results of RNA‐seq data. N = 5.
- B
sNuc‐seq data of ovarian nonimmune cells. Granulosa cells (cluster 0), mesothelial cells (cluster 1), thecal cells (cluster 2), and endothelial cells (cluster 3).
- C, D
(C) Relative expression of genes related to ROS in granulosa cells and (D) the concentration of E2 secreted by KGN cells with H2O2 treatment. N = 3.
- E, F
Relative abundance of GSH and GSSG. N = 3.
- G
The concentration of E2 secreted by KGN cells with ceramide treatment w/o NAC. N = 4.
- H–J
The serum concentration of FSH, AMH, and E2. (H) Control, N = 10; BCAA, N = 5; TG = 9; TG + BCAA = 8; (I) Control, N = 5; BCAA, N = 5; TG = 6; TG + BCAA = 6; (J) N = 5.
- K
The changes in follicle count. Control, N = 5; BCAA, N = 4; TG = 5; TG + BCAA = 5.
- L
Body weight. Control, N = 5; BCAA, N = 5; TG = 5; TG + BCAA = 4.
- M
Pregnancy rate. N = 4.
- N
Number of pups from mice with TG or TG + BCAA supplement treatment. N = 4.
- A
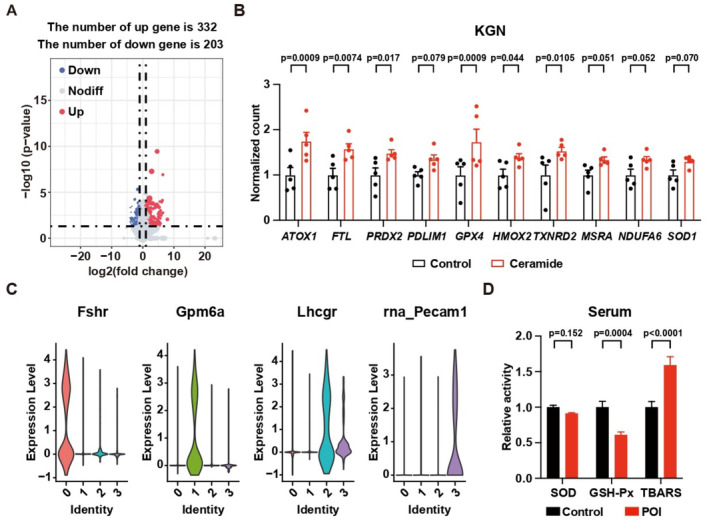
Genes with two‐fold changes and P‐value < 0.05 are highlighted in the volcano plot. N = 5.
- B
Upregulation of ROS‐related genes in KGN cells treated with ceramide. N = 5.
- C
Violin plots showing the expression of classical markers of nonimmune cells in ovaries from sNuc‐seq data.
- D
Relative activity of ROS‐related factors in patients. Control, N = 30; POI, N = 60.
- A
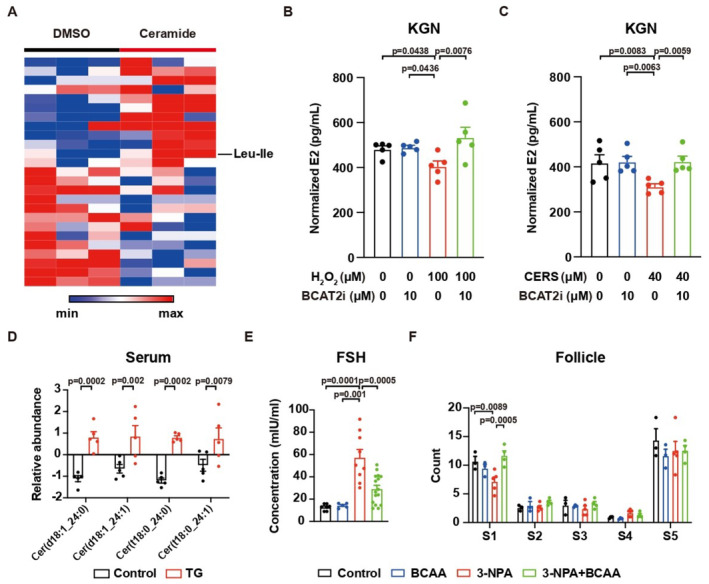
Heatmap showing the relative abundance of metabolites in KGN cells treated with ceramides. N = 3.
- B
The concentration of E2 secreted by KGN cells with H2O2 treatment w/o BCAT2 inhibitor. N = 5.
- C
The concentration of E2 secreted by KGN cells with ceramide treatment w/o BCAT2 inhibitor. N = 5.
- D
Elevation of ceramide in the serum of TG‐treated mice. N = 5.
- E
BCAA supplement prevented the elevation of FSH in mice with 3‐NPA treatment. Control, N = 7; BCAA, N = 5; 3‐NPA, N = 9; 3‐NPA + BCAA, N = 16.
- F
BCAA supplement rescued the decrease of primordial follicles in mice with 3‐NPA treatment. Control, N = 3; BCAA, N = 3; 3‐NPA, N = 5; 3‐NPA + BCAA, N = 4.
References
-
- Andrade ML, Gilio GR, Perandini LA, Peixoto AS, Moreno MF, Castro E, Oliveira TE, Vieira TS, Ortiz‐Silva M, Thomazelli CA et al (2021) PPARgamma‐induced upregulation of subcutaneous fat adiponectin secretion, glyceroneogenesis and BCAA oxidation requires mTORC1 activity. Biochim Biophys Acta Mol Cell Biol Lipids 1866: 158967 - PMC - PubMed
-
- Armeni E, Paschou SA, Goulis DG, Lambrinoudaki I (2021) Hormone therapy regimens for managing the menopause and premature ovarian insufficiency. Best Pract Res Clin Endocrinol Metab 35: 101561 - PubMed
-
- Bachelot A, Rouxel A, Massin N, Dulon J, Courtillot C, Matuchansky C, Badachi Y, Fortin A, Paniel B, Lecuru F et al (2009) Phenotyping and genetic studies of 357 consecutive patients presenting with premature ovarian failure. Eur J Endocrinol 161: 179–187 - PubMed
-
- Boulet MM, Chevrier G, Grenier‐Larouche T, Pelletier M, Nadeau M, Scarpa J, Prehn C, Marette A, Adamski J, Tchernof A (2015) Alterations of plasma metabolite profiles related to adipose tissue distribution and cardiometabolic risk. Am J Physiol Endocrinol Metab 309: E736–E746 - PubMed
Publication types
MeSH terms
Substances
Associated data
- Actions
Grants and funding
LinkOut - more resources
Full Text Sources
Other Literature Sources
Medical
Molecular Biology Databases
