. 2023 Feb 27;19(2):e1010893.
doi: 10.1371/journal.pcbi.1010893. eCollection 2023 Feb.

Using real-time data to guide decision-making during an influenza pandemic: A modelling analysis

Affiliations

Using real-time data to guide decision-making during an influenza pandemic: A modelling analysis

David J Haw et al. PLoS Comput Biol. .

Abstract

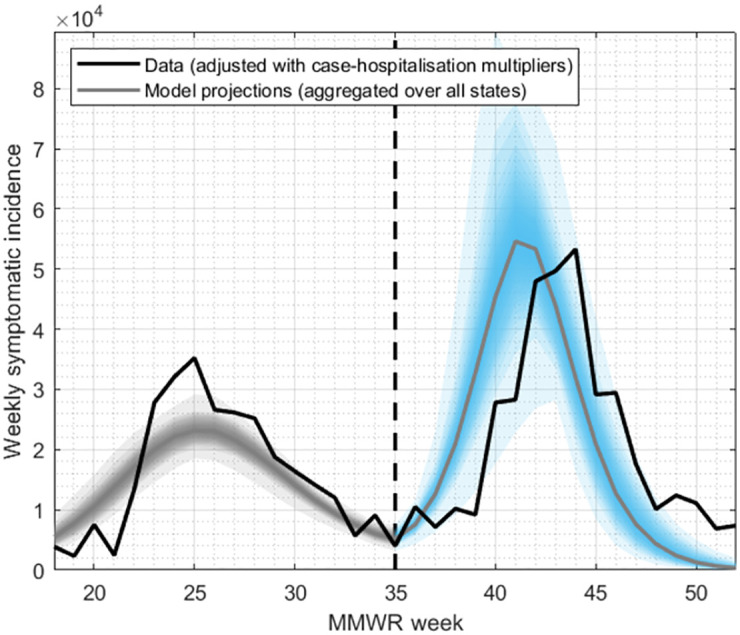
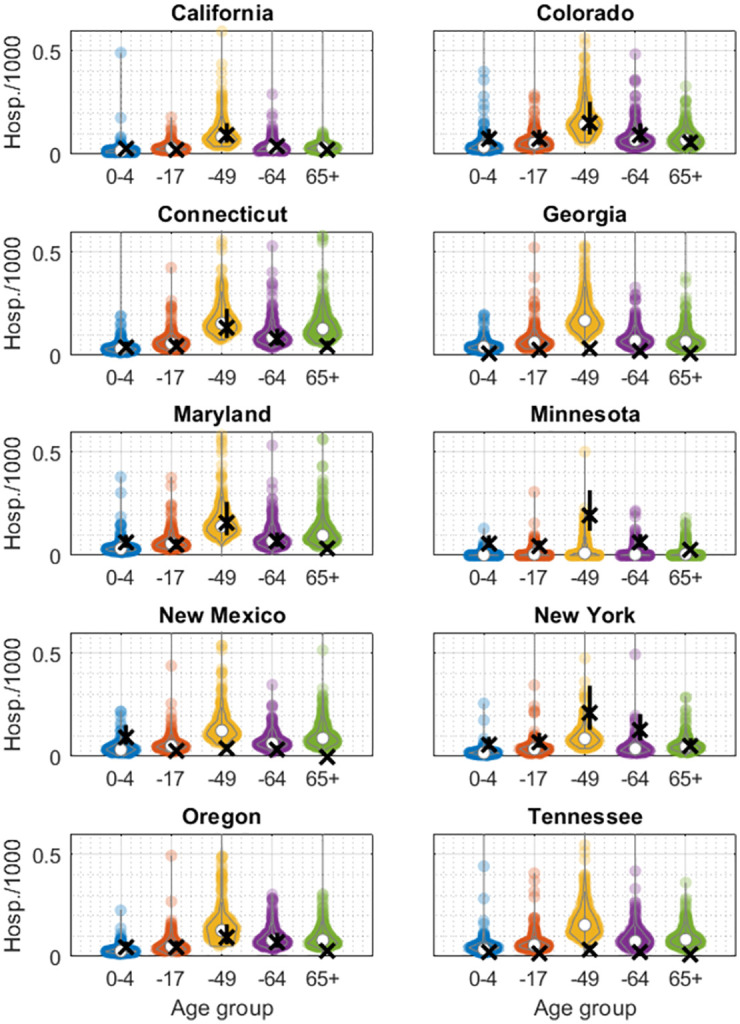
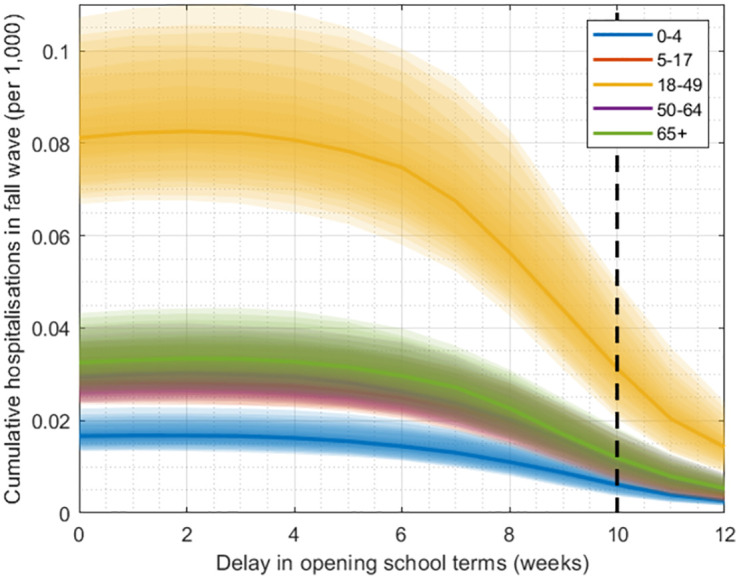
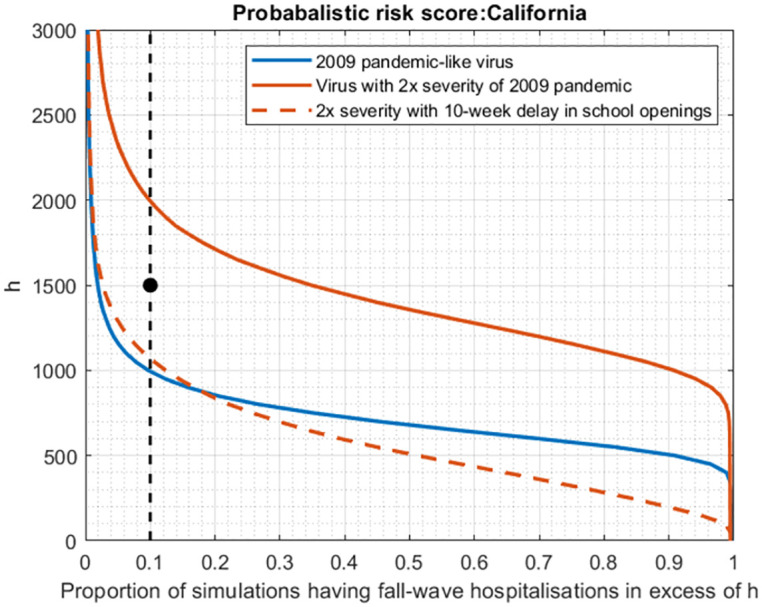
Influenza pandemics typically occur in multiple waves of infection, often associated with initial emergence of a novel virus, followed (in temperate regions) by a resurgence accompanying the onset of the annual influenza season. Here, we examined whether data collected from an initial pandemic wave could be informative, for the need to implement non-pharmaceutical measures in any resurgent wave. Drawing from the 2009 H1N1 pandemic in 10 states in the USA, we calibrated simple mathematical models of influenza transmission dynamics to data for laboratory confirmed hospitalisations during the initial 'spring' wave. We then projected pandemic outcomes (cumulative hospitalisations) during the fall wave, and compared these projections with data. Model results showed reasonable agreement for all states that reported a substantial number of cases in the spring wave. Using this model we propose a probabilistic decision framework that can be used to determine the need for preemptive measures such as postponing school openings, in advance of a fall wave. This work illustrates how model-based evidence synthesis, in real-time during an early pandemic wave, could be used to inform timely decisions for pandemic response.


Conflict of interest statement

Authours have no competing interests to declare.

Figures

Fig 1
Fig 1. FluSurv-NET data from the 2009 H1N1 pandemic in the USA.
Shown is weekly, age-specific data collected by the US Centers for Disease Control and Prevention (CDC), for hospitalisations that were laboratory confirmed as being pandemic H1N1. Each colour denotes a different age group, as indicated by the legend. Panels show data from the different states reporting FluSurv-NET data. Weeks are numbers along the x-axis according to MMWR numbering with, for example, week 35 corresponding to the week beginning on Sunday 30th August. Note that the y-axis varies between states. As described in the main text, several of these states (e.g. California) show clear signs of distinct spring and fall waves. For the purpose of the model, we used these data in combination with CDC estimates for the proportion of symptomatic cases that are hospitalised, laboratory tested, and reported through this dataset.
Fig 2
Fig 2. Illustration of the modelling approach, and of model projections, in the example of California.
For each state shown in Fig 1, we calibrated the model to the epidemic data from the spring wave (black line, to the left of the vertical dashed line, with aggregated model projections shown in grey shaded area). Using this calibrated model, we projected simulations forward into the fall, taking account of the effect of school openings and environmental forcing (blue shaded area). Although the model projection for epidemic peak timing varied in accuracy across states, our subsequent analysis concentrates on cumulative burden (area under the curve). See S2 Fig for results for other states.
Fig 3
Fig 3. Model projections for cumulative hospitalisations in the fall wave.
Each panel shows a different state. Crosses in black show data, vertical black lines show the 90% range of hospitalisation multipliers as given in [14], and coloured points show model-based projections, with each point representing the result of a single sample from the posterior density.
Fig 4
Fig 4. Projected hospitalisations (California) with delayed school openings, assuming the same efficacy and timing of vaccine rollout as occurred in 2009.
Each colour shows a different age group as indicated by the legend, while shaded areas show 25–75th percentiles, with 2009 vaccination coverage/efficacy. The vertical dashed line represents the candidate delay of 10 weeks used to illustrate our decision framework in Fig 5.
Fig 5
Fig 5. Proposed decision framework for triggering preemptive non-pharmaceutical interventions (NPIs), in advance of the fall wave.
Shown, for illustration, is the example of California, and a proposed scenario in which school opening is postponed by 10 weeks. These plots can be interpreted as cumulative probability distributions, for the total hospitalisations projected in the fall wave. As described in the main text, we define a ‘probabilistic risk score’ (PRS) as the probability that fall wave hospitalisations will increase a given threshold, h. We assume that preemptive interventions would be triggered if PRS exceeds some threshold probability P, with both H and P determined by a policymaker. The figure shows an illustrative scenario where h = 1, 500 cumulative hospitalisations, and P = 0.1 (‘reference point’, shown as a black dot). Any model-based projections can be represented as a downward-sloping curve on this plot: preemptive interventions would be triggered if the curve intersects the vertical, dashed line at any point above the reference point. As examples, the blue curve shows model projections for a 2009-pandemic-like virus in California (i.e. corresponding to Fig 3A), a scenario that would not trigger preemptive interventions. The solid red curve shows an alternative scenario, of a virus that is equally infectious, but twice as severe (i.e. having twice the risk of hospitalisation given infection). Such a virus would trigger preemptive interventions; the dashed red curve shows the reduction in hospitalisation risk that would occur, in a scenario where school opening is postponed for 10 weeks until vaccine rollout is underway (assuming the same vaccine introduction and rollout scenario as occurred in 2009–2010, in response to the pandemic).

Similar articles

Cited by

References

    1. Fineberg HV. Pandemic Preparedness and Response—Lessons from the H1N1 Influenza of 2009. New England Journal of Medicine. 2014;370(14):1335–1342. doi: 10.1056/NEJMra1208802 - DOI - PubMed
    1. Grieco L, Panovska-Griffiths J, van Leeuwen E, Grove P, Utley M. Exploring the role of mass immunisation in influenza pandemic preparedness: A modelling study for the UK context. Vaccine. 2020;38(33):5163–5170. doi: 10.1016/j.vaccine.2020.06.032 - DOI - PubMed
    1. Andreasen V, Viboud C, Simonsen L. Epidemiologic Characterization of the 1918 Influenza Pandemic Summer Wave in Copenhagen: Implications for Pandemic Control Strategies. The Journal of Infectious Diseases. 2008;197(2):270–278. doi: 10.1086/524065 - DOI - PMC - PubMed
    1. Cao Y, Hiyoshi A, Montgomery S. COVID-19 case-fatality rate and demographic and socioeconomic influencers: worldwide spatial regression analysis based on country-level data. BMJ Open. 2020;10(11). doi: 10.1136/bmjopen-2020-043560 - DOI - PMC - PubMed
    1. Kucharski A, Mills H, Pinsent A, Fraser C, Van Kerkhove M, Donnelly C, et al.. Distinguishing Between Reservoir Exposure and Human-to-Human Transmission for Emerging Pathogens Using Case Onset Data. PLOS Currents Outbreaks. 2014. doi: 10.1371/currents.outbreaks.e1473d9bfc99d080ca242139a06c455f - DOI - PMC - PubMed

Publication types