. 2023 Mar 7;120(10):e2204892120.
doi: 10.1073/pnas.2204892120. Epub 2023 Feb 27.

The global biomass of wild mammals

Affiliations

The global biomass of wild mammals

Lior Greenspoon et al. Proc Natl Acad Sci U S A. .

Abstract

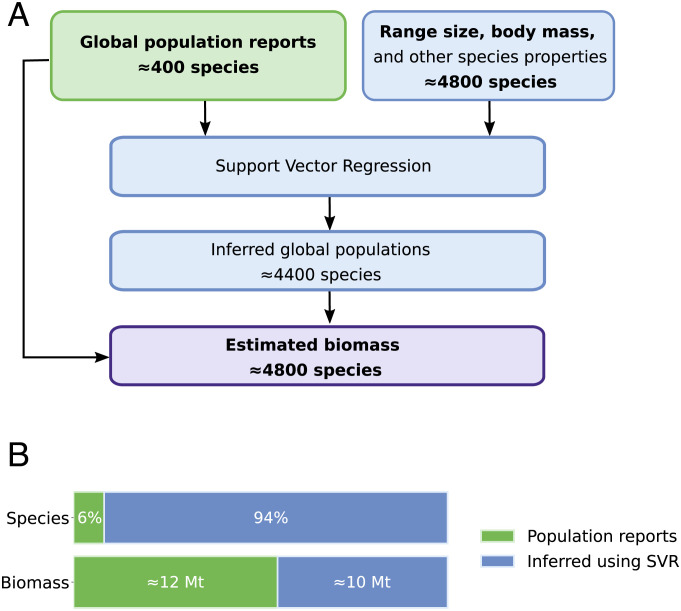
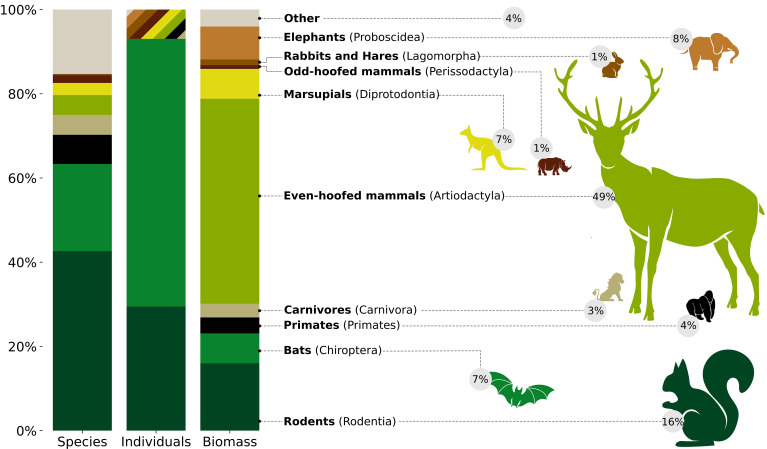
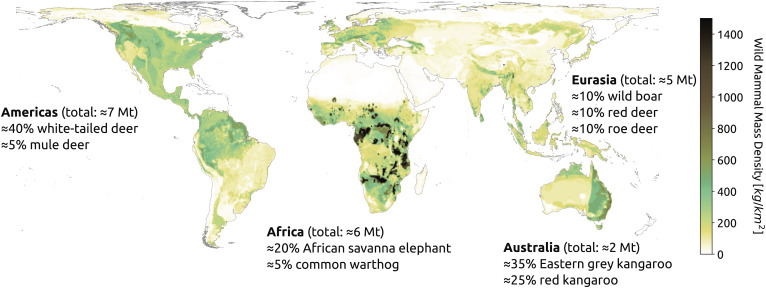
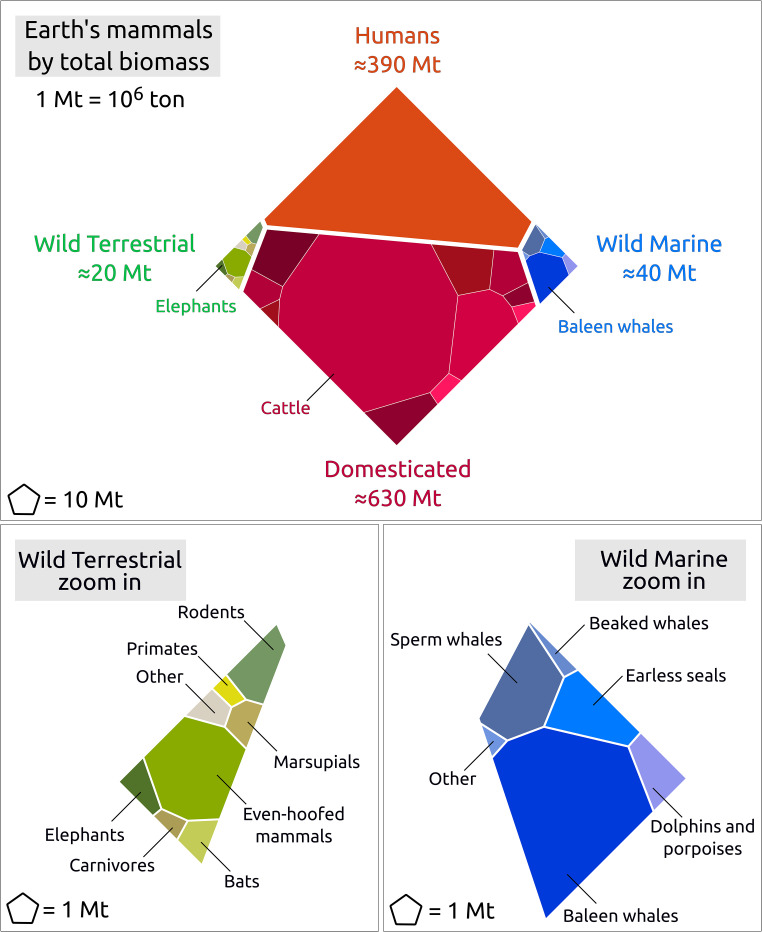
Wild mammals are icons of conservation efforts, yet there is no rigorous estimate available for their overall global biomass. Biomass as a metric allows us to compare species with very different body sizes, and can serve as an indicator of wild mammal presence, trends, and impacts, on a global scale. Here, we compiled estimates of the total abundance (i.e., the number of individuals) of several hundred mammal species from the available data, and used these to build a model that infers the total biomass of terrestrial mammal species for which the global abundance is unknown. We present a detailed assessment, arriving at a total wet biomass of ≈20 million tonnes (Mt) for all terrestrial wild mammals (95% CI 13-38 Mt), i.e., ≈3 kg per person on earth. The primary contributors to the biomass of wild land mammals are large herbivores such as the white-tailed deer, wild boar, and African elephant. We find that even-hoofed mammals (artiodactyls, such as deer and boars) represent about half of the combined mass of terrestrial wild mammals. In addition, we estimated the total biomass of wild marine mammals at ≈40 Mt (95% CI 20-80 Mt), with baleen whales comprising more than half of this mass. In order to put wild mammal biomass into perspective, we additionally estimate the biomass of the remaining members of the class Mammalia. The total mammal biomass is overwhelmingly dominated by livestock (≈630 Mt) and humans (≈390 Mt). This work is a provisional census of wild mammal biomass on Earth and can serve as a benchmark for human impacts.

Keywords: biomass; biosphere; ecology; quantitative biology.


Conflict of interest statement

The authors declare no competing interest.

Figures

Fig. 1.
Fig. 1.
(A) Outline of the process of quantifying the total biomass of all wild land mammals (SI Appendix, Fig. S3). (B) The number of species and total biomass of all wild land mammals by estimation method. For 392 species, global population reports are available (green). The total mass of each of the remaining 4,413 species (blue) was estimated using our model. The 392 species were not selected randomly, but selected based on data availability. This dataset therefore tends to contain more large-bodied species at greater risk of extinction, or species with a small range compared to the species where no global abundance data are available (Materials and Methods). Our estimate excludes ≈1,500 known wild land species for which there is a lack of range data due to scarcity and lack of research. We estimate their global biomass to be negligible, since their abundance is typically low.
Fig. 2.
Fig. 2.
The relative number of species, number of individuals, and total biomass of each taxonomic order of wild land mammals. Due to the uncertainty associated with the number of individuals, we combine together the contribution of all but the two most individual-rich orders. The relative biomass contribution of each order is also indicated by the animal silhouette sizes and corresponding percentages.
Fig. 3.
Fig. 3.
A simplistic depiction of the global distribution of wild land mammal biomass density, based on overlaying the biomass and ranges of all species and assuming that each species is evenly spread throughout its range. Although this assumption can create unrealistically uniform patches across large areas, it provides a holistic overview and displays the dominance of the species with the largest overall biomass. The estimated total biomass is noted for each continent, together with the name of the top mass contributor and its relative biomass contribution to the said continent. This analysis excludes the feral pig (Sus scrofa) biomass in North America and Australia due to lack of range data.
Fig. 4.
Fig. 4.
Top: the global biomass distribution of the mammalian class, represented by a Voronoi diagram. The area of each cell is proportional to the biomass contribution of each group. The global mammalian biomass distribution is dominated by humans and domesticated mammals, including livestock and pets (illustrated at the species level in SI Appendix). Bottom: enlarged view of the biomass of wild terrestrial (Left, grouped by order) and marine mammals (Right, grouped by family, or few families).

References

    1. Ceballos G., et al. , Accelerated modern human-induced species losses: Entering the sixth mass extinction. Sci. Adv. 1, e1400253 (2015). - PMC - PubMed
    1. Barnosky A. D., et al. , Has the Earth’s sixth mass extinction already arrived? Nature 471, 51–57 (2011). - PubMed
    1. Ceballos G., Ehrlich P. R., Dirzo R., Biological annihilation via the ongoing sixth mass extinction signaled by vertebrate population losses and declines. Proc. Natl. Acad. Sci. U.S.A. 114, E6089–E6096 (2017). - PMC - PubMed
    1. Dirzo R., et al. , Defaunation in the Anthropocene. Science 345, 401–406 (2014). - PubMed
    1. Shandra J. M., Leckband C., McKinney L. A., London B., Ecologically unequal exchange, world polity, and biodiversity loss: A cross-national analysis of threatened mammals. Int. J. Comp. Sociol. 50, 285–310 (2009).

Publication types

Supplementary concepts

LinkOut - more resources