. 2023 Jul 11;7(13):2957-2971.
doi: 10.1182/bloodadvances.2022009179.

Classification and genetics of pediatric B-other acute lymphoblastic leukemia by targeted RNA sequencing

Affiliations

Classification and genetics of pediatric B-other acute lymphoblastic leukemia by targeted RNA sequencing

Natacha Azussa Migita et al. Blood Adv. .

Abstract

Acute lymphoblastic leukemia (ALL) can be classified into different subgroups based on recurrent genetic alterations. Here, targeted RNA sequencing was used to identify the novel subgroups of ALL in 144 B-other and 40 "classical" ALL samples. The classical TCF3-PBX1, ETV6-RUNX1, KMT2A-rearranged, and BCR-ABL1, and novel P2RY8-CRLF2, ABL-, JAK2-, ZNF384-, MEF2D-, and NUTM1-fusions were easily identified by fusion transcript analysis. IGH-CRLF2 and IGH-EPOR were found by abnormally high levels of expression of CRLF2 or EPOR. DUX4-rearranged was identified by the unusual expression of DUX4 genes and an alternative exon of ERG, or by clustering analysis of gene expression. PAX5-driven ALL, including fusions, intragenic amplifications, and mutations were identified by single-nucleotide variant analysis and manual inspection using the IGV software. Exon junction analysis allowed detection of some intragenic ERG and IKZF1 deletions. CRLF2-high associated with initial white blood cell (WBC) counts of ≥50 × 103/μL and GATA3 risk alleles (rs3781093 and rs3824662), whereas ABL/JAK2/EPOR-fusions associated with high WBC counts, National Cancer Institute's high-risk classification, and IKZF1del. ZNF384-fusions associated with CALLA-negativity and NUTM1-fusions in infants. In conclusion, targeted RNA sequencing further classified 66.7% (96 of 144) B-other ALL cases. All BCP-ALL subgroups, except for iAMP21, hyperdiploid and hypodiploid cases, were identified. Curiously, we observed higher frequencies of females within B-rest ALLs and males in PAX5-driven cases.


Conflict of interest statement

Conflict-of-interest disclosure: The authors declare no competing financial interests.

Figures

None
Graphical abstract
Figure 1.
Figure 1.
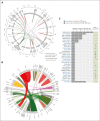
Overview of gene fusions discovered by targeted RNA sequencing. (A) Circos plot showing the gene fusions schematically organized into chromosome position, both for classical and B-other ALL cases. Genes are arranged based on their genomic position in the chromosome (clockwise from chromosome 1 to 22, followed by X and Y). The line links the 2 partner genes in a fusion, and the colored legend shows the rearrangement type. All classical gene fusions are shown as light blue ribbons. (B) Zoomed-in view of fusion genes to show in more detail the rearrangements found specifically in the 144 B-other–classified cases. Ribbon widths are proportional to the frequency of a specific gene in a fusion event. (C) Number of in-frame fusion genes found in 47 of 144 B-other ALL cases. The bars indicate the number of patients in which a given fusion gene was observed. Rare and novel fusion genes discovered in this study are highlighted. §PAX5-ZCCHC7 was found in a patient that also has a functional ETV6-RUNX1 fusion. ∗IGH-CRLF2 were detected by high CRLF2 expression and confirmed by FISH. CTX, interchromosome; DEL, deletion; INS, insertion; ITX, intrachromsome.
Figure 2.
Figure 2.
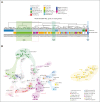
Identification of representative IKZF1 deleted cases by splice junction track analysis. (A) Schematic representation of Sashimi plot for 1 IKZF1 nondeleted case displaying all expected arcs connecting IKZF1 exons. The vertical peaks represent coverage depth on IKZF1 exons. Arcs represent splice junctions that connect exons, and the numbers on curved lines show the junction read depth that split across the junction. (B) Schematic view and Sashimi plots obtained in the IGV software for a representative IKZF1 Δ4-7 case (red) displaying abnormal splice junction arcs connecting exon 3-8, which it is not seem in the IKZF1 nondeleted case (black). The upper panel displays all exon-exon junctions. The lower panel display selected exon junctions, which distinguish a particular IKZF1 deletion. This is accomplished in IGV by clicking on the specific exon, as indicated by the red arrowhead. (C) Schematic view and Sashimi plots for a representative IKZF1 Δ4-8 case (red) displaying the abnormal splice junctions connecting exon 3 to downstream genes FIGNL1 and DDC. Note that the abnormal splice junction arcs are only seen in IKZF1 deleted cases. Results for the whole group of patients are summarized in supplemental Figure 6 and supplemental Table 6. Genomic coordinates plotted on the last track of each panel correspond to RefSeq, Hg19.
Figure 3.
Figure 3.
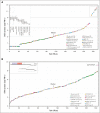
Overexpression of CRLF2 and EPOR. (A) Normalized expression (Log2 TPM+1) of CRLF2 in ascending order. Data from 184 BCP-ALLs (144 B-other and 40 classical subtypes of ALL) are shown. Symbols represent different genetic alterations. The dashed box highlights samples with CRLF2 expression three-fold higher than the median, which correspond to samples with CRLF2-rearrangements (P2RY8-CRLF2, IGH-CRLF2) or CRLF2 p.F232C. (B) Normalized rank-ordered expression (Log2 TPM+1) of EPOR. The “outlier” case corresponds to the single IGH-EPOR found by fusion transcript analysis. AJ2E, group of ABL-, JAK2-, and EPOR-fusion cases.
Figure 4.
Figure 4.
Identification of DUX4-rearranged ALL by the differential expression profile of the DUX4 gene clusters and ERG exons. The plot shows read depth coverage on 3 different chromosomal regions, that is, DUX4 multifamily gene array in the telomeric regions of chromosomes 4 and 10, and ERG gene on chromosome 21 aligned on the human Hg19 genome. DUX4 gene is exclusively expressed in the DUX4-rearranged group, and is associated, in most cases (27 of 35), with expression of an alternative exon 6 of ERG (ERGalt). The location of the ERGalt exon is shown in red. Screenshot of the IGV browser. ∗Here, 2 cases grouped within the PAX5-driven group and 1 in the iAMP21 group has an outlier expression of CRLF2. AJ2E, group of ABL-, JAK2-, and EPOR-fusion cases.
Figure 5.
Figure 5.
Unsupervised clustering analyses segregate specific subgroups of patients with shared gene-expression patterns. (A) HCA of the 144 B-other and 40 classical BCP-ALL samples based on the expression of 124 genes subtracted from a list of 864 genes selected by Liu et al (2016) for ALL classification. Resulting groups/column dendrograms are shown (Euclidean and ward D). The list of genes is presented in supplemental Table 2. Genetic annotations are split into 3 lanes: the first lane shows the initial classification into the classical subtypes; the second lane shows the subgroup classification among B-other ALLs, as provided by the present study; and the third lane shows patients’ identification. (B) Two-dimensional t-distributed stochastic neighbor embedding (t-SNE) plot of the 144 B-other and 40 classical BCP-ALL samples based on the 731 most variably expressed genes. Each dot represents a sample colored by subgroup. The 731 genes were selected and processed by the t-SNE algorithm with a perplexity score of 10. Of note, the 2 in-frame ETV6-fusion cases did not cluster together in gene-expression profiling analyses and thus were not classified in a separate subgroup of B-other ALL. AJ2E, group of ABL-, JAK2-, and EPOR-fusion cases.
Figure 6.
Figure 6.
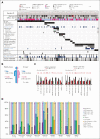
Frequencies and associations of the molecular subgroups of B-other ALL. (A) Graphical overview of the molecular subgroups, demography, and clinical characteristics of the 144 B-other ALL cases. Subgroups were clustered based on the recurrent genetic abnormalities defined by fusion transcripts, gene-expression profile, and point mutations, as identified by using the TruSight Pan-Cancer targeted RNA sequencing. Each column represents a single patient. A single PAX5-JAK2 was grouped with JAK2-rearranged cases. Three CRLF2-high cases also grouped with the PAX5-driven (2 cases) or iAMP21 (1 case) groups. GATA3 analysis was performed in only 142 cases and MLPA in 136 of 144 B-other cases. (B) Gender biases observed in B-rest and the PAX5-driven subgroups of B-other ALL. (C and D) Associations between the molecular subgroups of B-other ALL and the different prognostic factors at diagnosis; (C) the GATA3 risk alleles are C for rs3781093 and A for rs3824662. GATA3 allele frequencies were compared with the frequencies of 1171 admixed individuals from São Paulo (Brazil) by the Fisher test (risk allele frequency for rs3781093 was 0.221; and for rs3824662 was 0.218), ∗P < .05; ∗∗P < .005; ∗∗∗∗P < .0001; (D) stacked bar chart showing the frequency of each patient’s demographic information by subgroup. Comparisons were made by the Fisher test followed by Monte Carlo correction, ∗P < .05 (supplemental Table 7). Numbers inside bars represent absolute numbers of cases. WBC, white blood cell; AJ2E, group of ABL-, JAK2-, and EPOR-fusion cases.
Figure 7.
Figure 7.
Frequency and distribution of BCP-ALL subtypes among all 516 patients with non-DS BCP-ALL registered in the GBTLI LLA-1999 and LLA-2009 in the Boldrini Children’s Center. The pie chart depicts the percentages of the classical subtypes. Patients with incomplete genetic tests (n = 45) could not be classified. Of these, 177 (34%) cases were classified as B-other ALL, because they lacked t(12;21)(ETV6-RUNX1), t(1;19)(TCF3-PBX1), t(9:22)(BCR-ABL1), and KMT2A-rearrangements, and had ≥44 and <51 chromosomes (or a DNA index of <1.16). Not all B-other cases had samples available for the analyses (n = 33). RNA targeted sequencing was performed on 144 B-other and 40 classical ALL samples. The number of cases belonging to the novel molecular subgroups of B-other ALL are shown in the right bar graph. A comprehensive table with the genetic and demographic information on all the 184 cases is provided in the supplemental material (supplemental Table 8). AJ2E, group of ABL-, JAK2-, and EPOR-fusion cases.

References

    1. Ward E, DeSantis C, Robbins A, Kohler B, Jemal A. Childhood and adolescent cancer statistics, 2014. CA Cancer J Clin. 2014;64(2):83–103. - PubMed
    1. Schrappe M, Reiter A, Ludwig WD, et al. Improved outcome in childhood acute lymphoblastic leukemia despite reduced use of anthracyclines and cranial radiotherapy: results of trial ALL-BFM 90. German-Austrian-Swiss ALL-BFM Study Group. Blood. 2000;95(11):3310–3322. - PubMed
    1. Moorman AV, Ensor HM, Richards SM, et al. Prognostic effect of chromosomal abnormalities in childhood B-cell precursor acute lymphoblastic leukaemia: results from the UK medical research council ALL97/99 randomised trial [published correction appears in Lancet Oncol. 2010 Jun;11(6):516] Lancet Oncol. 2010;11(5):429–438. - PubMed
    1. Hunger SP, Lu X, Devidas M, et al. Improved survival for children and adolescents with acute lymphoblastic leukemia between 1990 and 2005: a report from the children's oncology group. J Clin Oncol. 2012;30(14):1663–1669. - PMC - PubMed
    1. Roberts KG, Morin RD, Zhang J, et al. Genetic alterations activating kinase and cytokine receptor signaling in high-risk acute lymphoblastic leukemia. Cancer Cell. 2012;22(2):153–166. - PMC - PubMed

Publication types