. 2023 Mar 8;10(3):ENEURO.0296-22.2023.
doi: 10.1523/ENEURO.0296-22.2023. Print 2023 Mar.

Executive Control of Sequence Behavior in Pigeons Involves Two Distinct Brain Regions

Affiliations

Executive Control of Sequence Behavior in Pigeons Involves Two Distinct Brain Regions

Lukas Alexander Hahn et al. eNeuro. .

Abstract

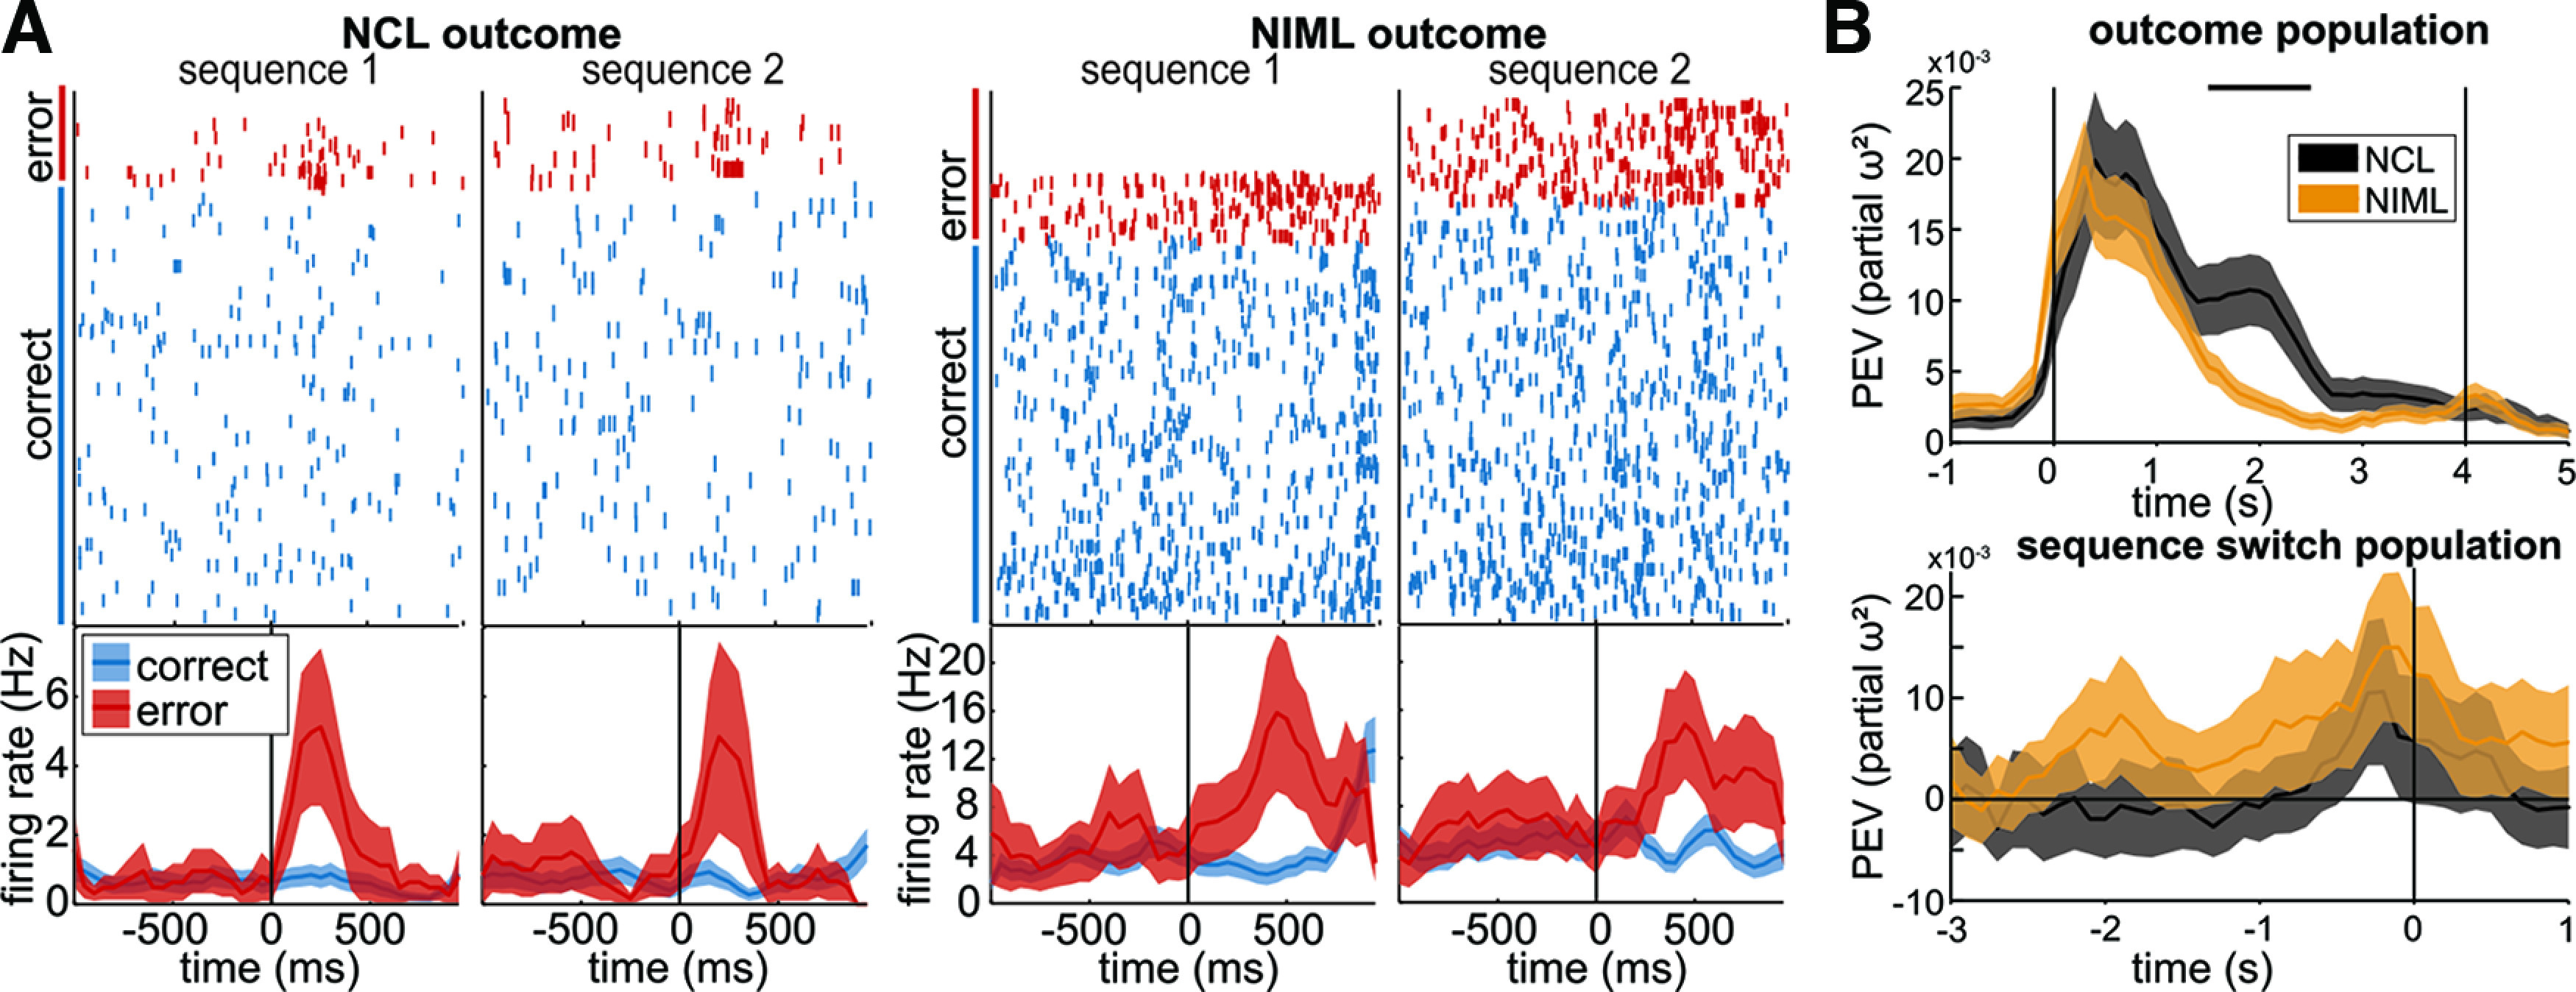
Executive functions arise from multiple regions of the brain acting in concert. To facilitate such cross-regional computations, the brain is organized into distinct executive networks, like the frontoparietal network. Despite similar cognitive abilities across many domains, little is known about such executive networks in birds. Recent advances in avian fMRI have shown a possible subset of regions, including the nidopallium caudolaterale (NCL) and the lateral part of medial intermediate nidopallium (NIML), that may contribute to complex cognition, forming an action control system of pigeons. We investigated the neuronal activity of NCL and NIML. Single-cell recordings were obtained during the execution of a complex sequential motor task that required executive control to stop executing one behavior and continue with a different one. We compared the neuronal activity of NIML to NCL and found that both regions fully processed the ongoing sequential execution of the task. Differences arose from how behavioral outcome was processed. Our results indicate that NCL takes on a role in evaluating outcome, while NIML is more tightly associated with ongoing sequential steps. Importantly, both regions seem to contribute to overall behavioral output as parts of a possible avian executive network, crucial for behavioral flexibility and decision-making.

Keywords: behavioral switch; cognition; electrophysiology; executive control; network; pigeon.


Conflict of interest statement

The authors declare no competing financial interests.

Figures

Figure 1.
Figure 1.
Experimental procedure. A, Behavioral task. Birds performed two different behavioral sequences. Each sequence consisted of four choice elements (at four distinct locations, top, bottom, left, and right). A sequence was repeated until the animal reached a behavioral criterion (plus a pseudorandom number of trials). Sequence transition was not cued and had to be discovered by trial and error. Extended Data Figure 1-1 gives an overview of block lengths. B, Behavioral performance. Both pigeons performed the behavioral task at very high levels, with the lowest performance on the first element of each sequence. Colored bars indicate the mean performance on each element of the behavioral task, for both sequences. Dashed black lines indicate chance level on each element; error bars indicate the standard error of the mean. C, Single-cell activity was recorded in parallel from NCL, and NIML using silicon probes attached to chronically implanted manual microdrives.
Figure 2.
Figure 2.
Neurons represent the interaction of sequence and element. Raster plots (each dot represents one action potential) and histograms (average firing rate and standard error of the mean) of example neurons recorded in NCL and NIML. Only correct trials are depicted. Both neurons responded stronger to particular elements in only one of the two sequences. For example, the NCL neuron responds with a substantial increase of firing rate to element II (red), but only for sequence 1. This neuronal activity is best explained by the interaction of element and sequence. Alternative explanations like the target location do not fit the observed differences. Consider the red curve of sequence 1 and the blue curve of sequence 2; despite the same location (left) being the target, the firing rates differ substantially. Colors indicate neural response to the start stimulus (yellow), and elements I (black), II (red), III (green), and IV (blue). Data are aligned to the response to each element (time 0/black vertical line). In the raster plot, each trial is depicted four times (once for each element).
Figure 3.
Figure 3.
NCL and NIML have similar response profiles but differ in timing. A, Population response in NCL (top) and NIML (bottom). Sequential information expressed as PEV by sequence (red), element (blue), and seqele interaction (green). The vertical black line indicates the time of response. Both regions represented elements and interactions, while sequence was represented mostly in NIML. Importantly, information about seqele interaction emerges earlier in NIML than in NCL. Lines indicate the mean; shaded area indicates the standard error of the mean; PEV is across all recorded neurons. B, The interaction emerges in NIML (orange) significantly earlier (indicated by horizontal black line) than in NCL (black). Violin plots of latencies of the two regions measured as the first bin crossing the information threshold (3 standard deviations above the mean information of a neuron; only neurons crossing the +3 standard deviations level were taken into account; based on 100 ms bins advanced with a step size of 10 ms). Extended Data Figure 3-1 gives an overview of significant neuron counts in both regions for the different test groups.
Figure 4.
Figure 4.
Choice outcome and sequence switch in NCL and NIML. A, Raster plots and histograms of example neurons in NCL (left panel) and NIML (right panel). Correct and error trials for element I are depicted. Both neurons responded strongly to erroneous responses. Colors indicate the neural response to element I (correct, blue; incorrect, red). Data were aligned to the response (time 0/black vertical line). In the raster plot, correct and incorrect trials are grouped. B (top) Population response to the outcome (element IV correct vs element I incorrect) in NCL (black) and NIML (orange). Both regions differentiate between correct and error trials, but NCL does so slightly stronger and for a longer period. Lines indicate the mean and shaded areas indicate the standard error of the mean of PEV across all recorded neurons. Vertical black lines indicate the time of response (0 s) and the end of the feedback phase (4 s), and horizontal black lines indicate a significant difference between the regions. See Extended Data Figure 4-1 for the number of error trials per element and statistical values, and Extended Data Figure 4-2 for statistical values and results concerning the factor outcome. B (bottom) Subpopulation PEV sequence change (switch vs no-switch) in NCL (black) and NIML (orange). Only correct sequence switches, when the animals successfully transitioned from one sequence to the other, and all other correct trials, where the animals perform the same sequence from trial to trial, are depicted. Both regions differentiated switch from no-switch trials before the onset of the next sequence. Vertical black lines indicate the response to the initiation stimulus (0 s). Lines indicate the mean, and shaded areas the standard error of the mean of PEV across all selected neurons. Horizontal black lines indicate significant differences between the regions. See Extended Data Figures 4-3, 4-4, 4-5, 4-6 for statistical values and results concerning the factors sequence, switch, and seqswitch interaction.

Similar articles

Cited by

References

    1. Anderson C, Parra RS, Chapman H, Steinemer A, Porter B, Colombo M (2020) Pigeon nidopallium caudolaterale, entopallium, and mesopallium ventrolaterale neural responses during categorisation of Monet and Picasso paintings. Sci Rep 10:15971. 10.1038/s41598-020-72650-y - DOI - PMC - PubMed
    1. Atoji Y, Wild JM (2012) Afferent and efferent projections of the mesopallium in the pigeon (Columba livia). J Comp Neurol 520:717–741. 10.1002/cne.22763 - DOI - PubMed
    1. Behroozi M, Helluy X, Ströckens F, Gao M, Pusch R, Tabrik S, Tegenthoff M, Otto T, Axmacher N, Kumsta R, Moser D, Genc E, Güntürkün O (2020) Event-related functional MRI of awake behaving pigeons at 7T. Nat Commun 11:4715. 10.1038/s41467-020-18437-1 - DOI - PMC - PubMed
    1. Brainard DH (1997) The psychophysics toolbox. Spat Vis 10:433–436. 10.1163/156856897X00357 - DOI - PubMed
    1. Browning R, Overmier JB, Colombo M (2011) Delay activity in avian prefrontal cortex—sample code or reward code? Eur J Neurosci 33:726–735. 10.1111/j.1460-9568.2010.07540.x - DOI - PubMed

Publication types

LinkOut - more resources