. 2023 Apr 5;43(14):2440-2459.
doi: 10.1523/JNEUROSCI.1002-22.2023. Epub 2023 Feb 27.

Ribosomes in RNA Granules Are Stalled on mRNA Sequences That Are Consensus Sites for FMRP Association

Affiliations

Ribosomes in RNA Granules Are Stalled on mRNA Sequences That Are Consensus Sites for FMRP Association

Mina N Anadolu et al. J Neurosci. .

Abstract

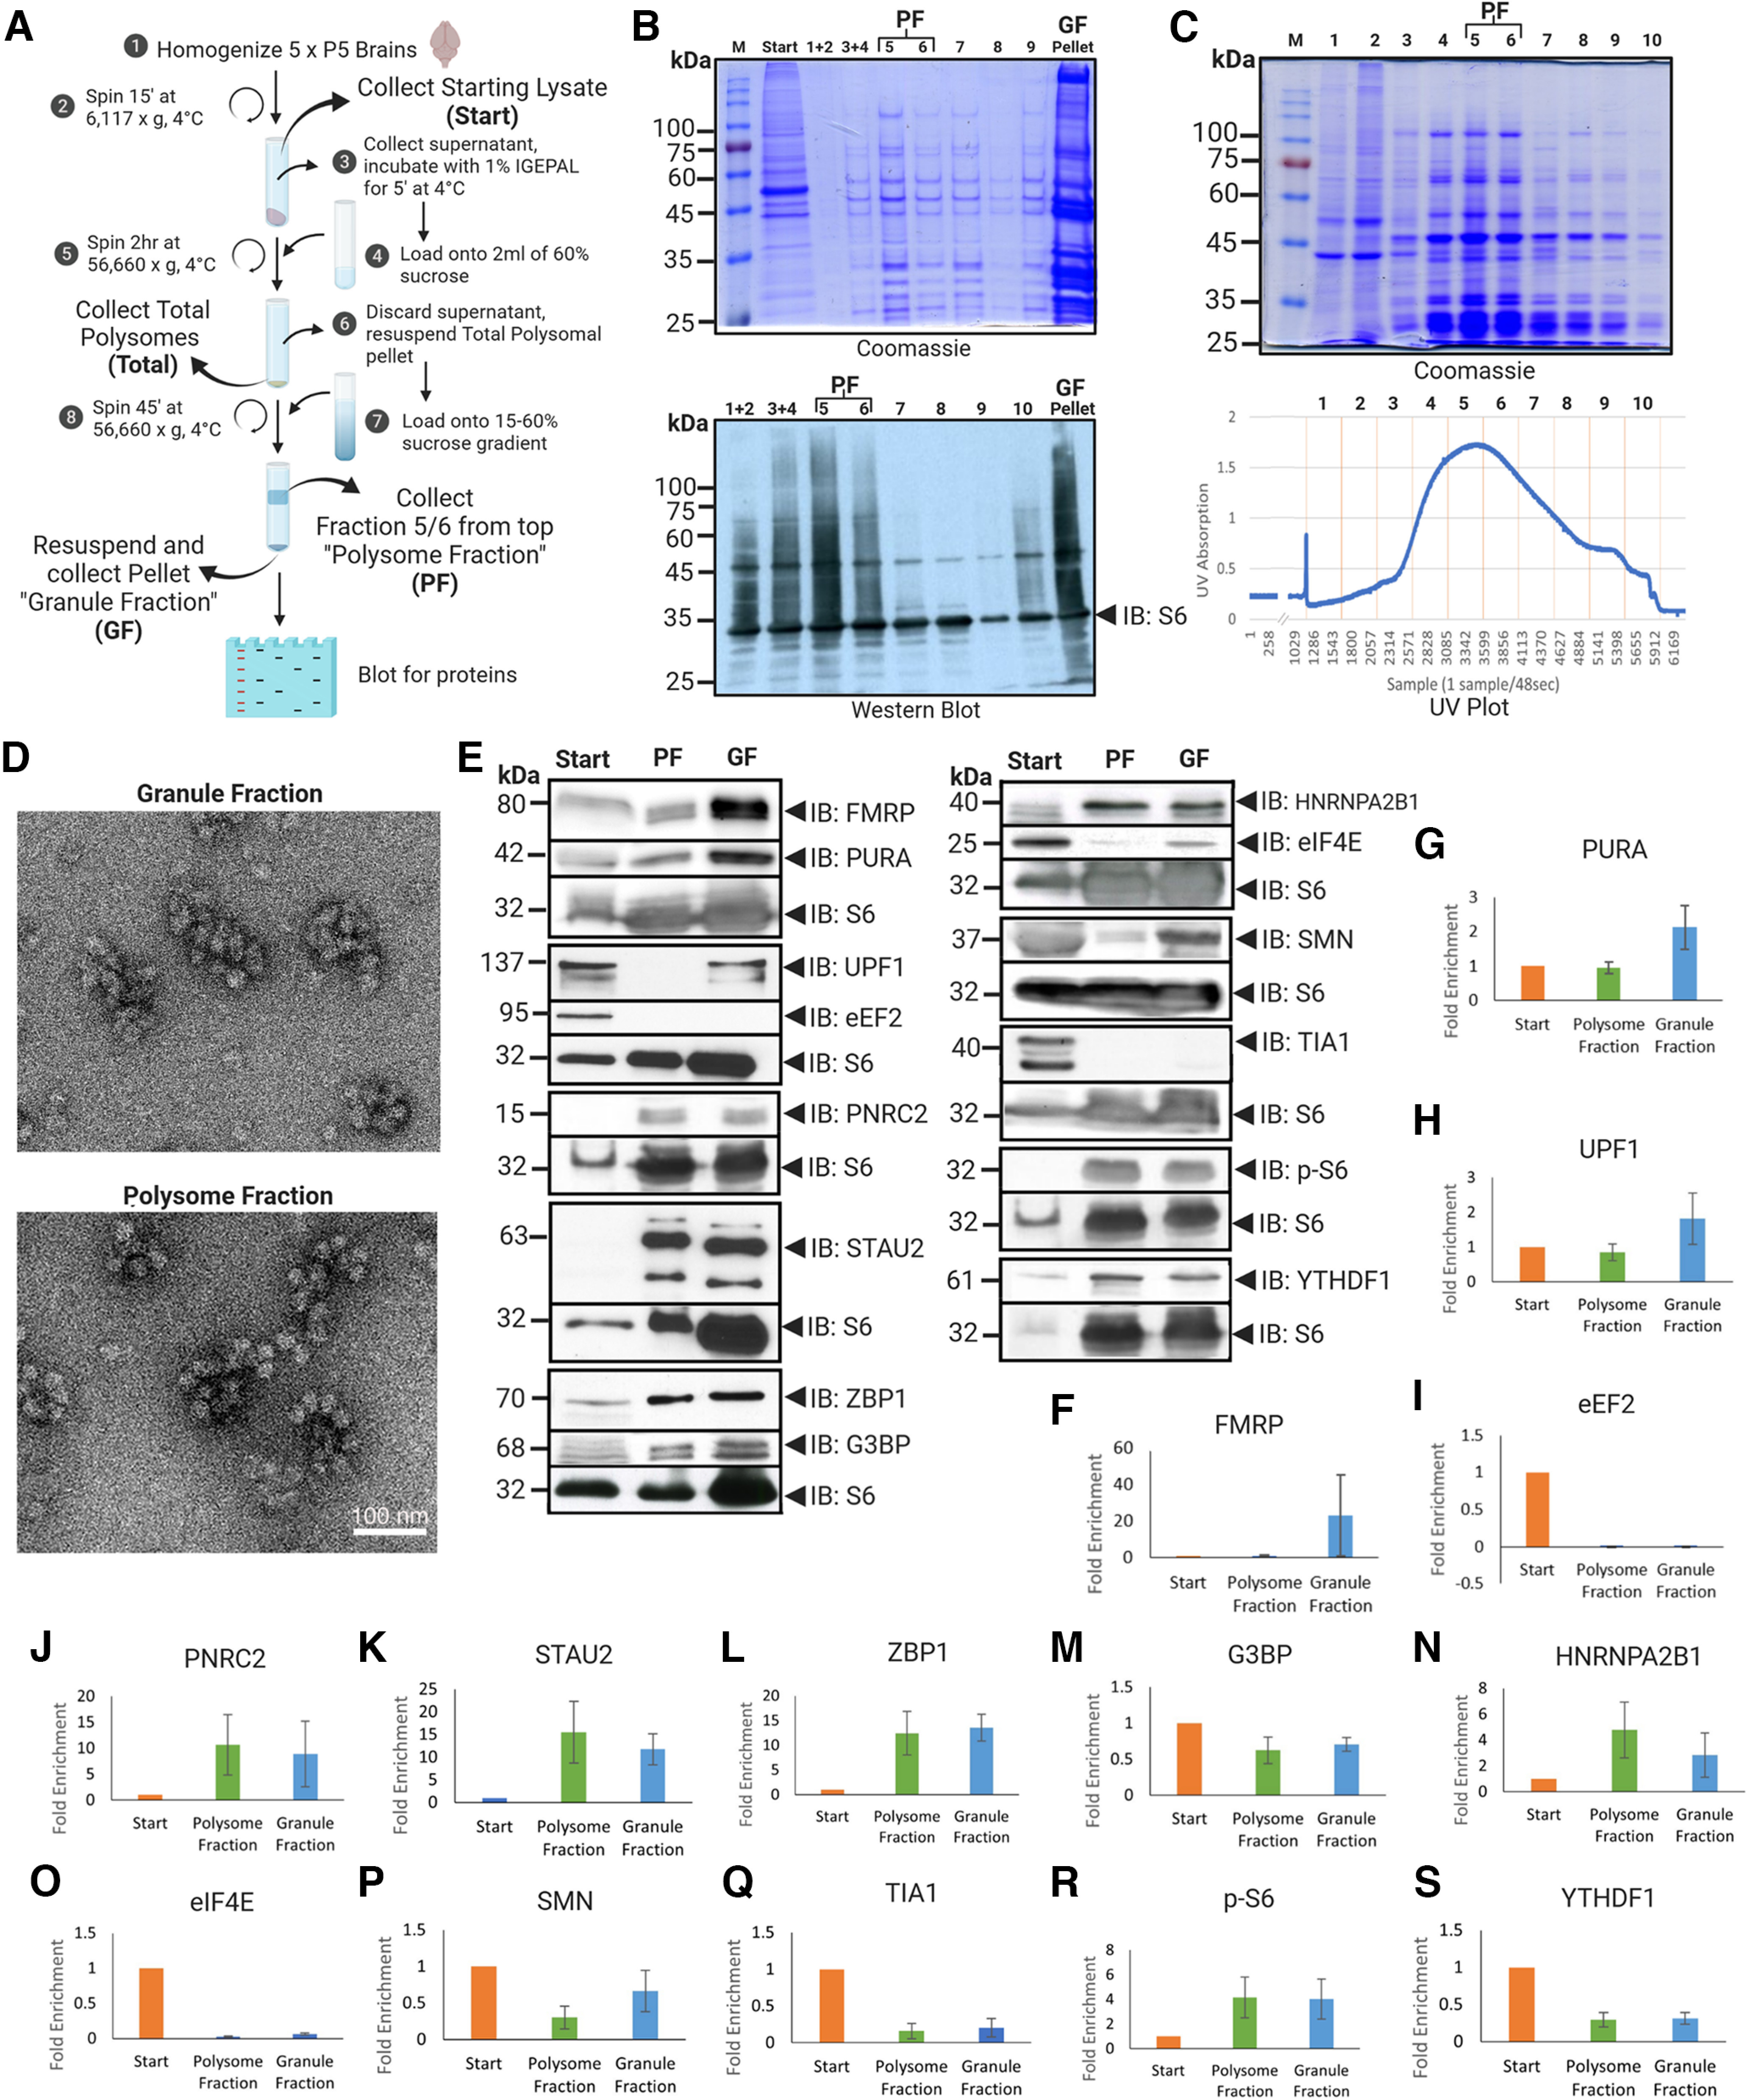
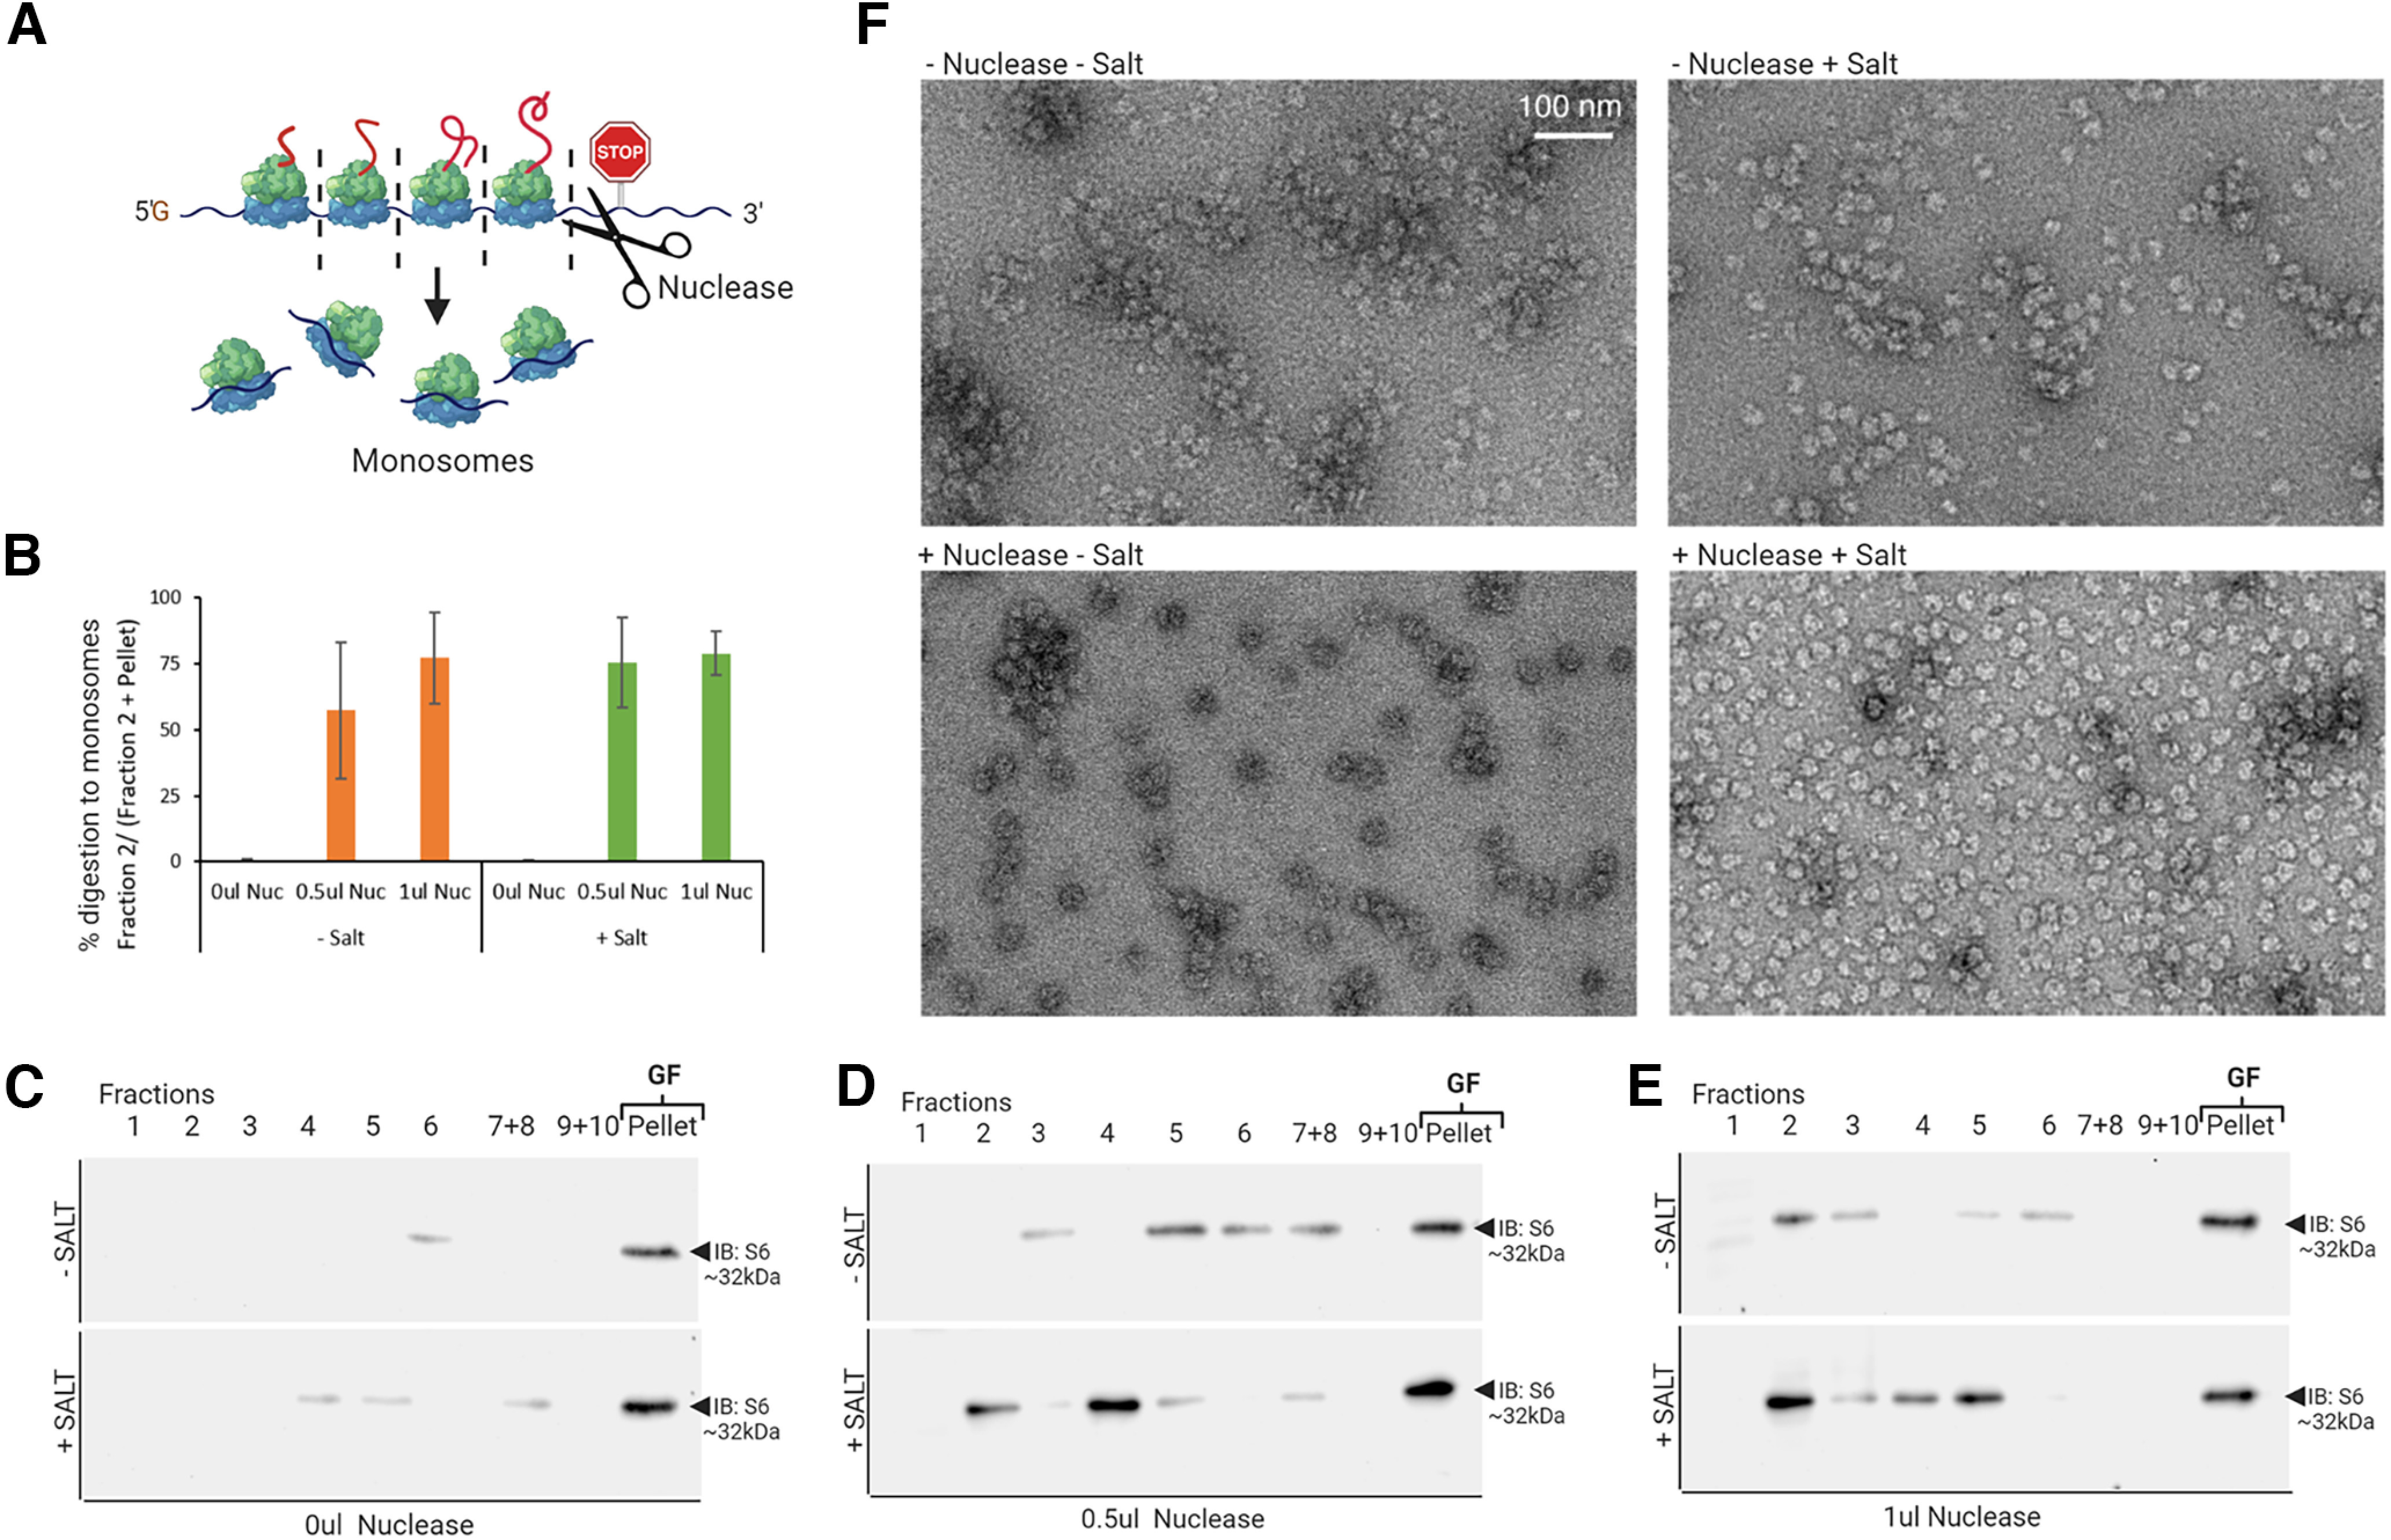
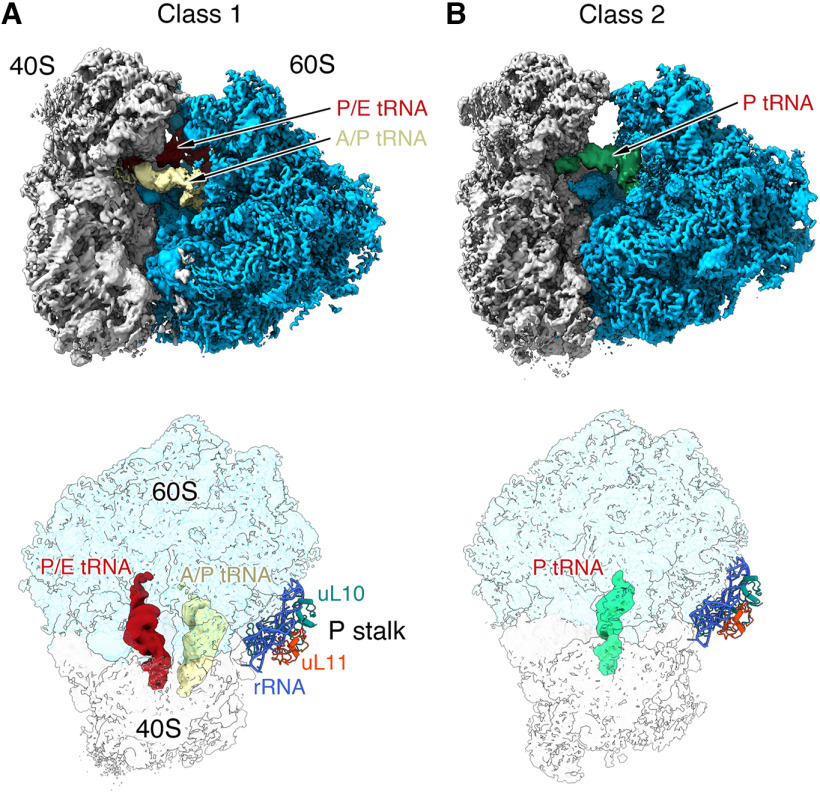
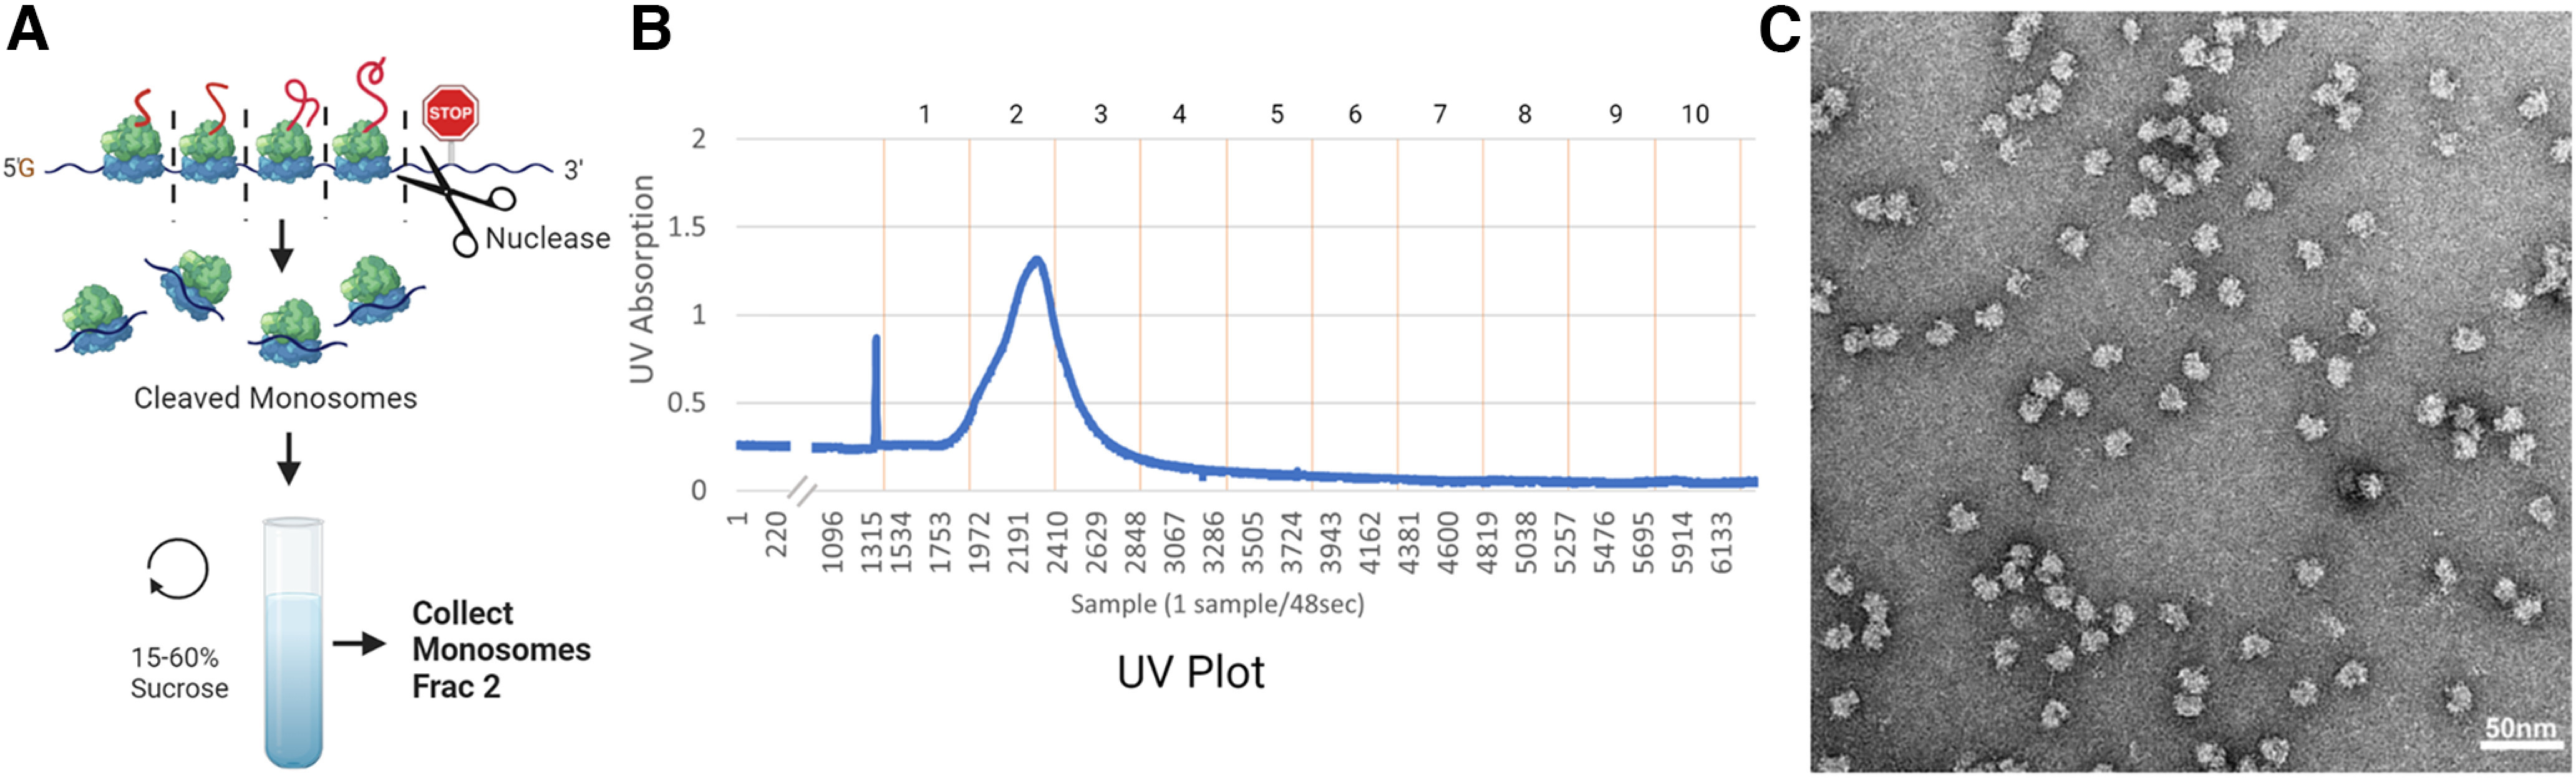
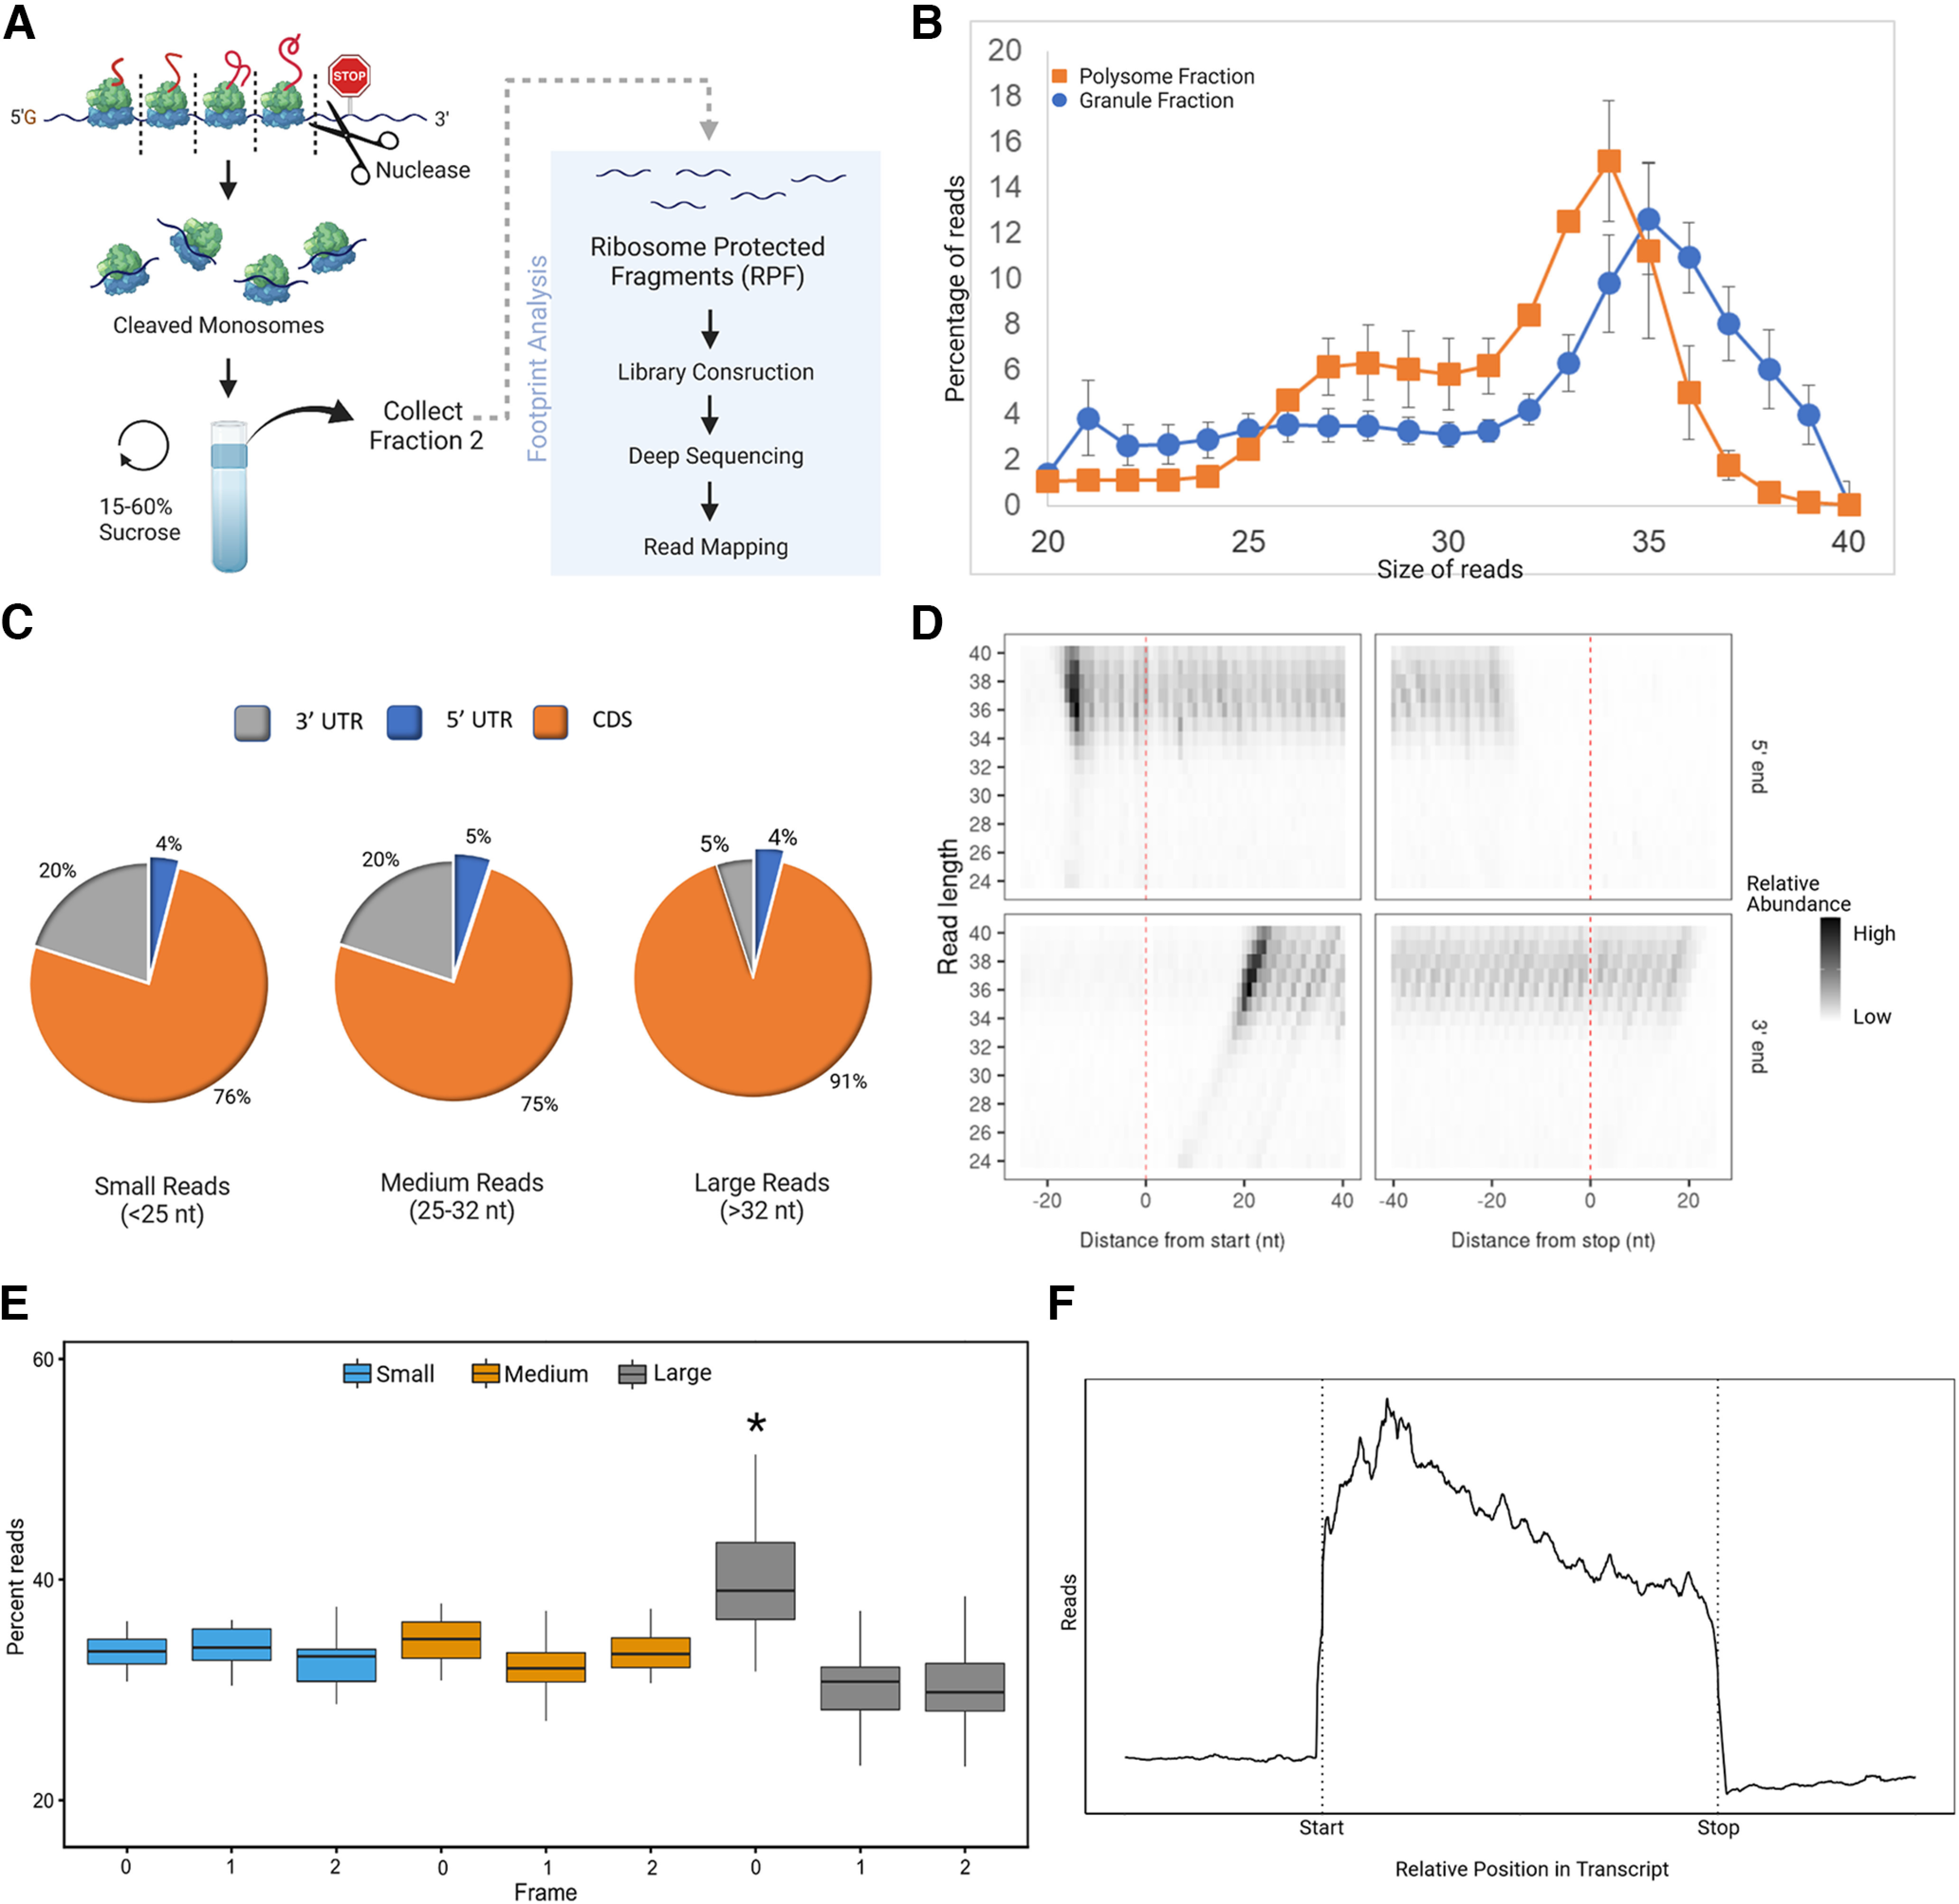
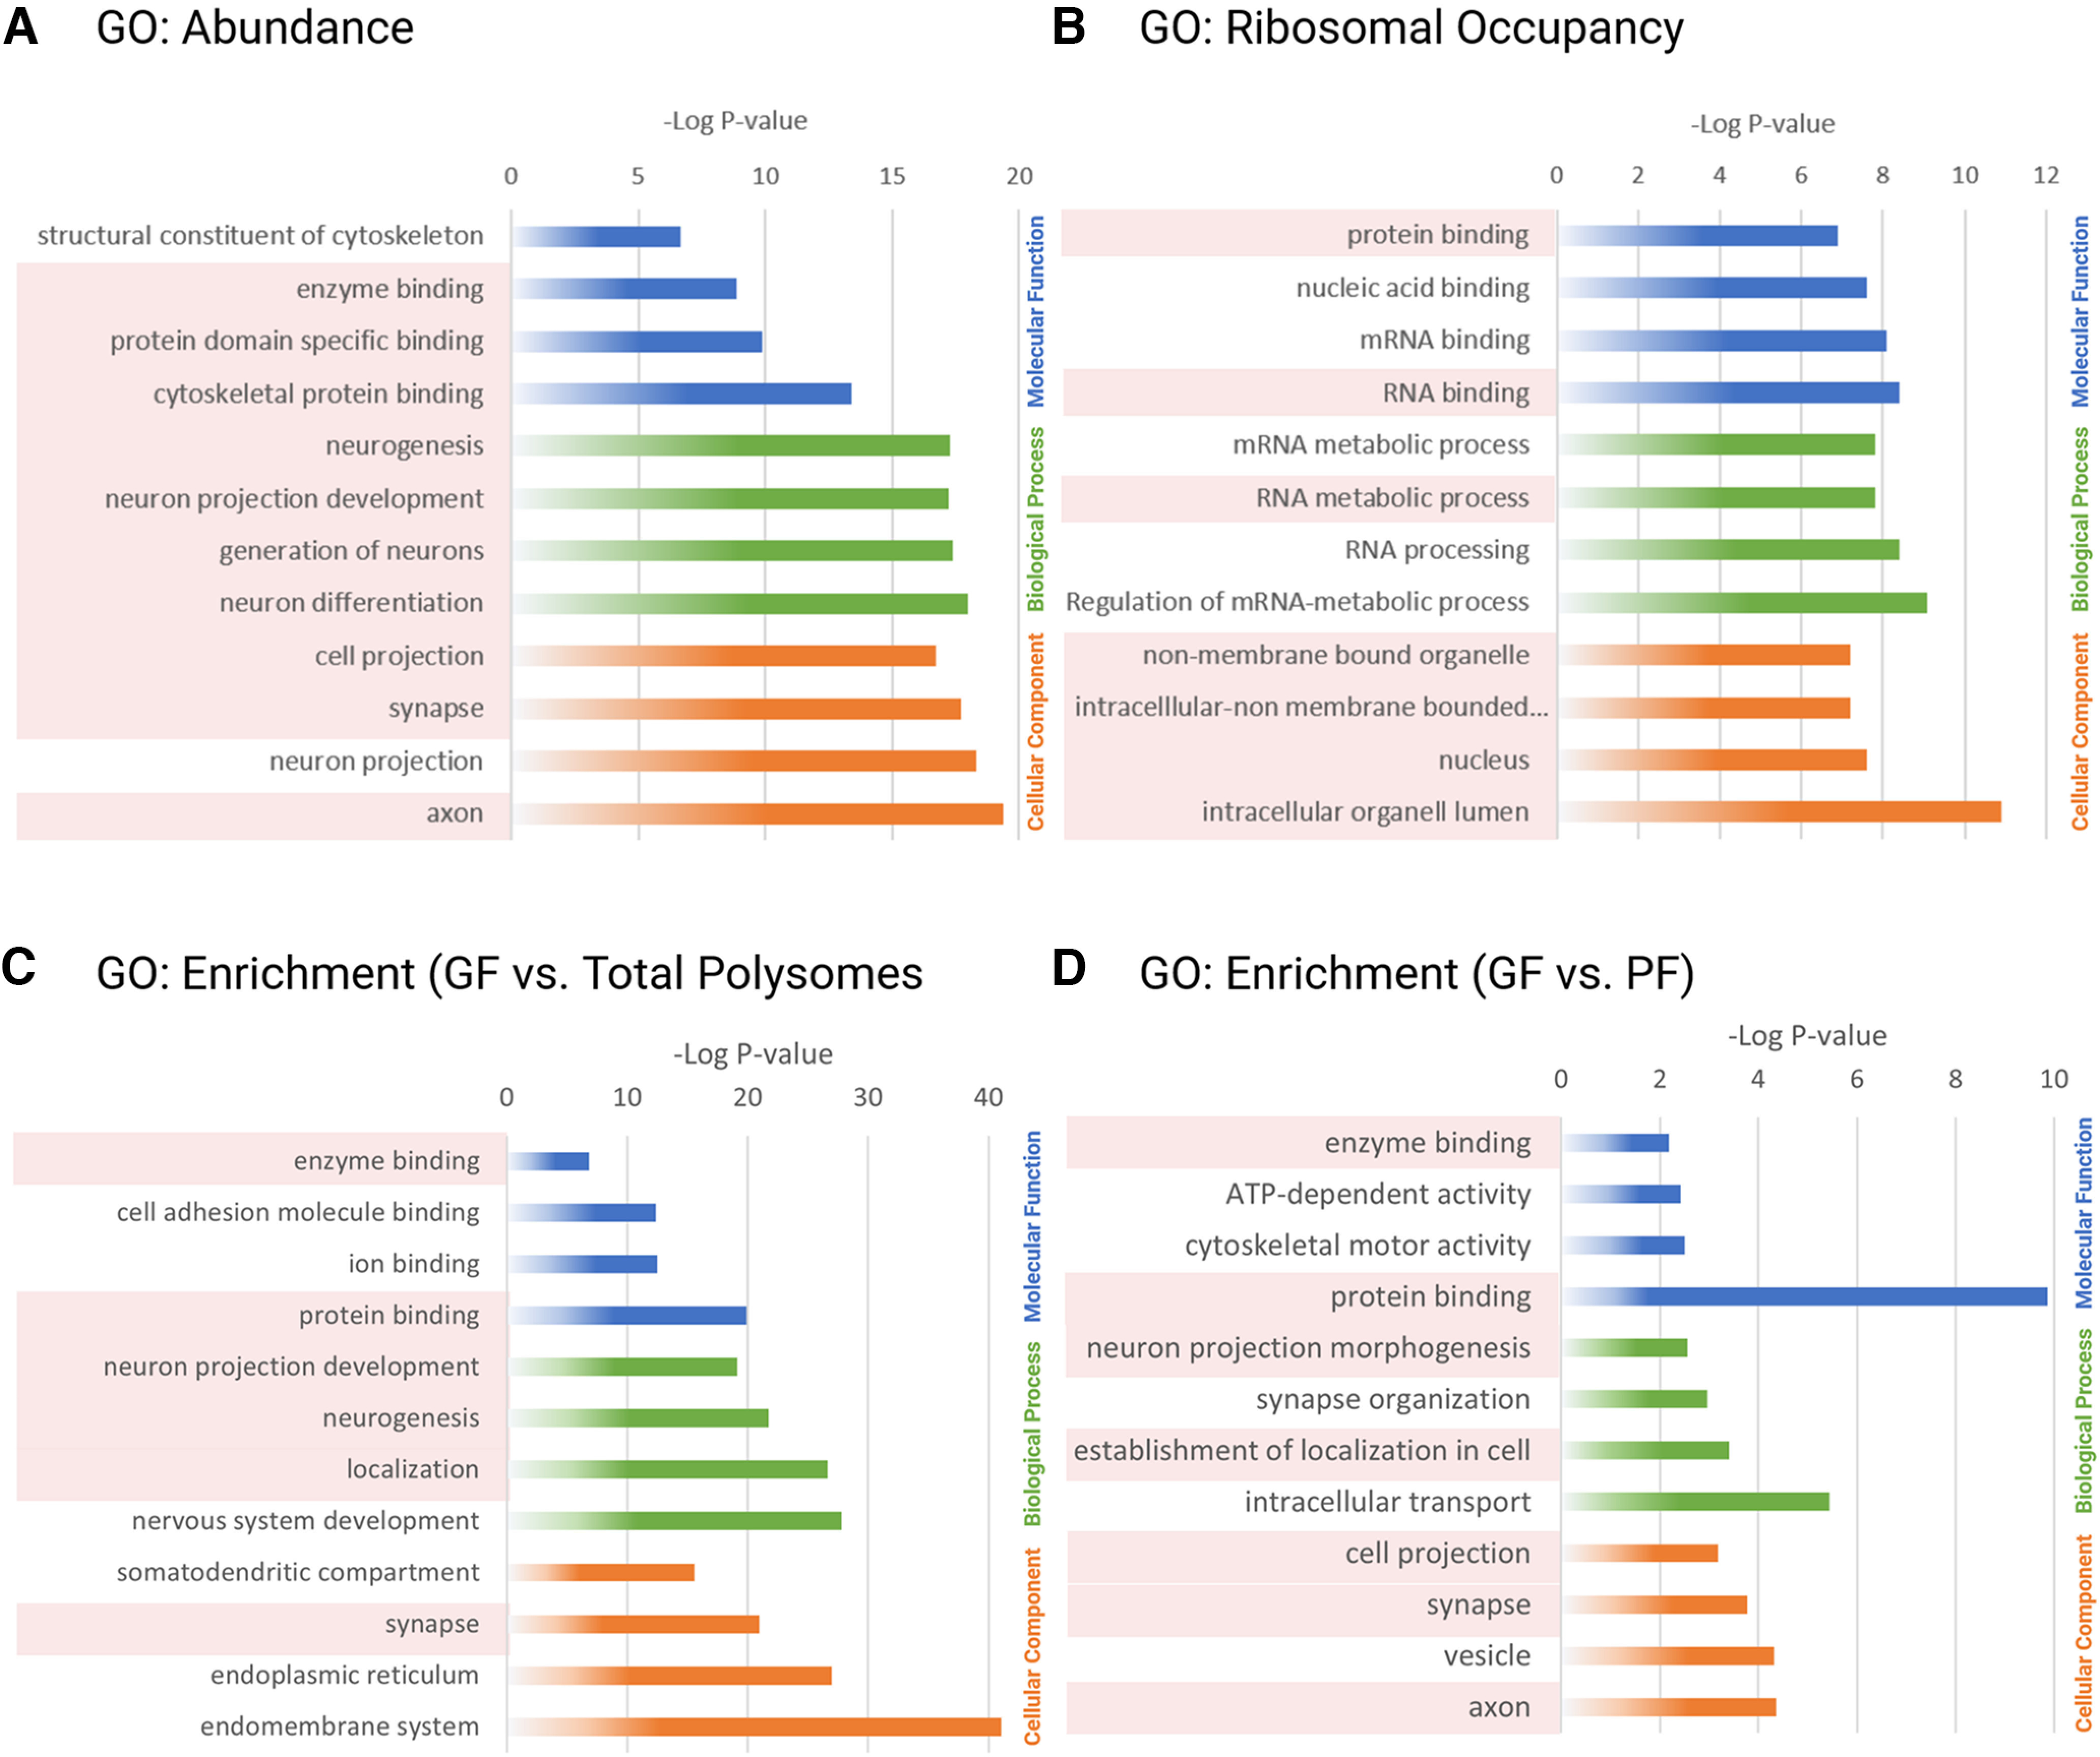
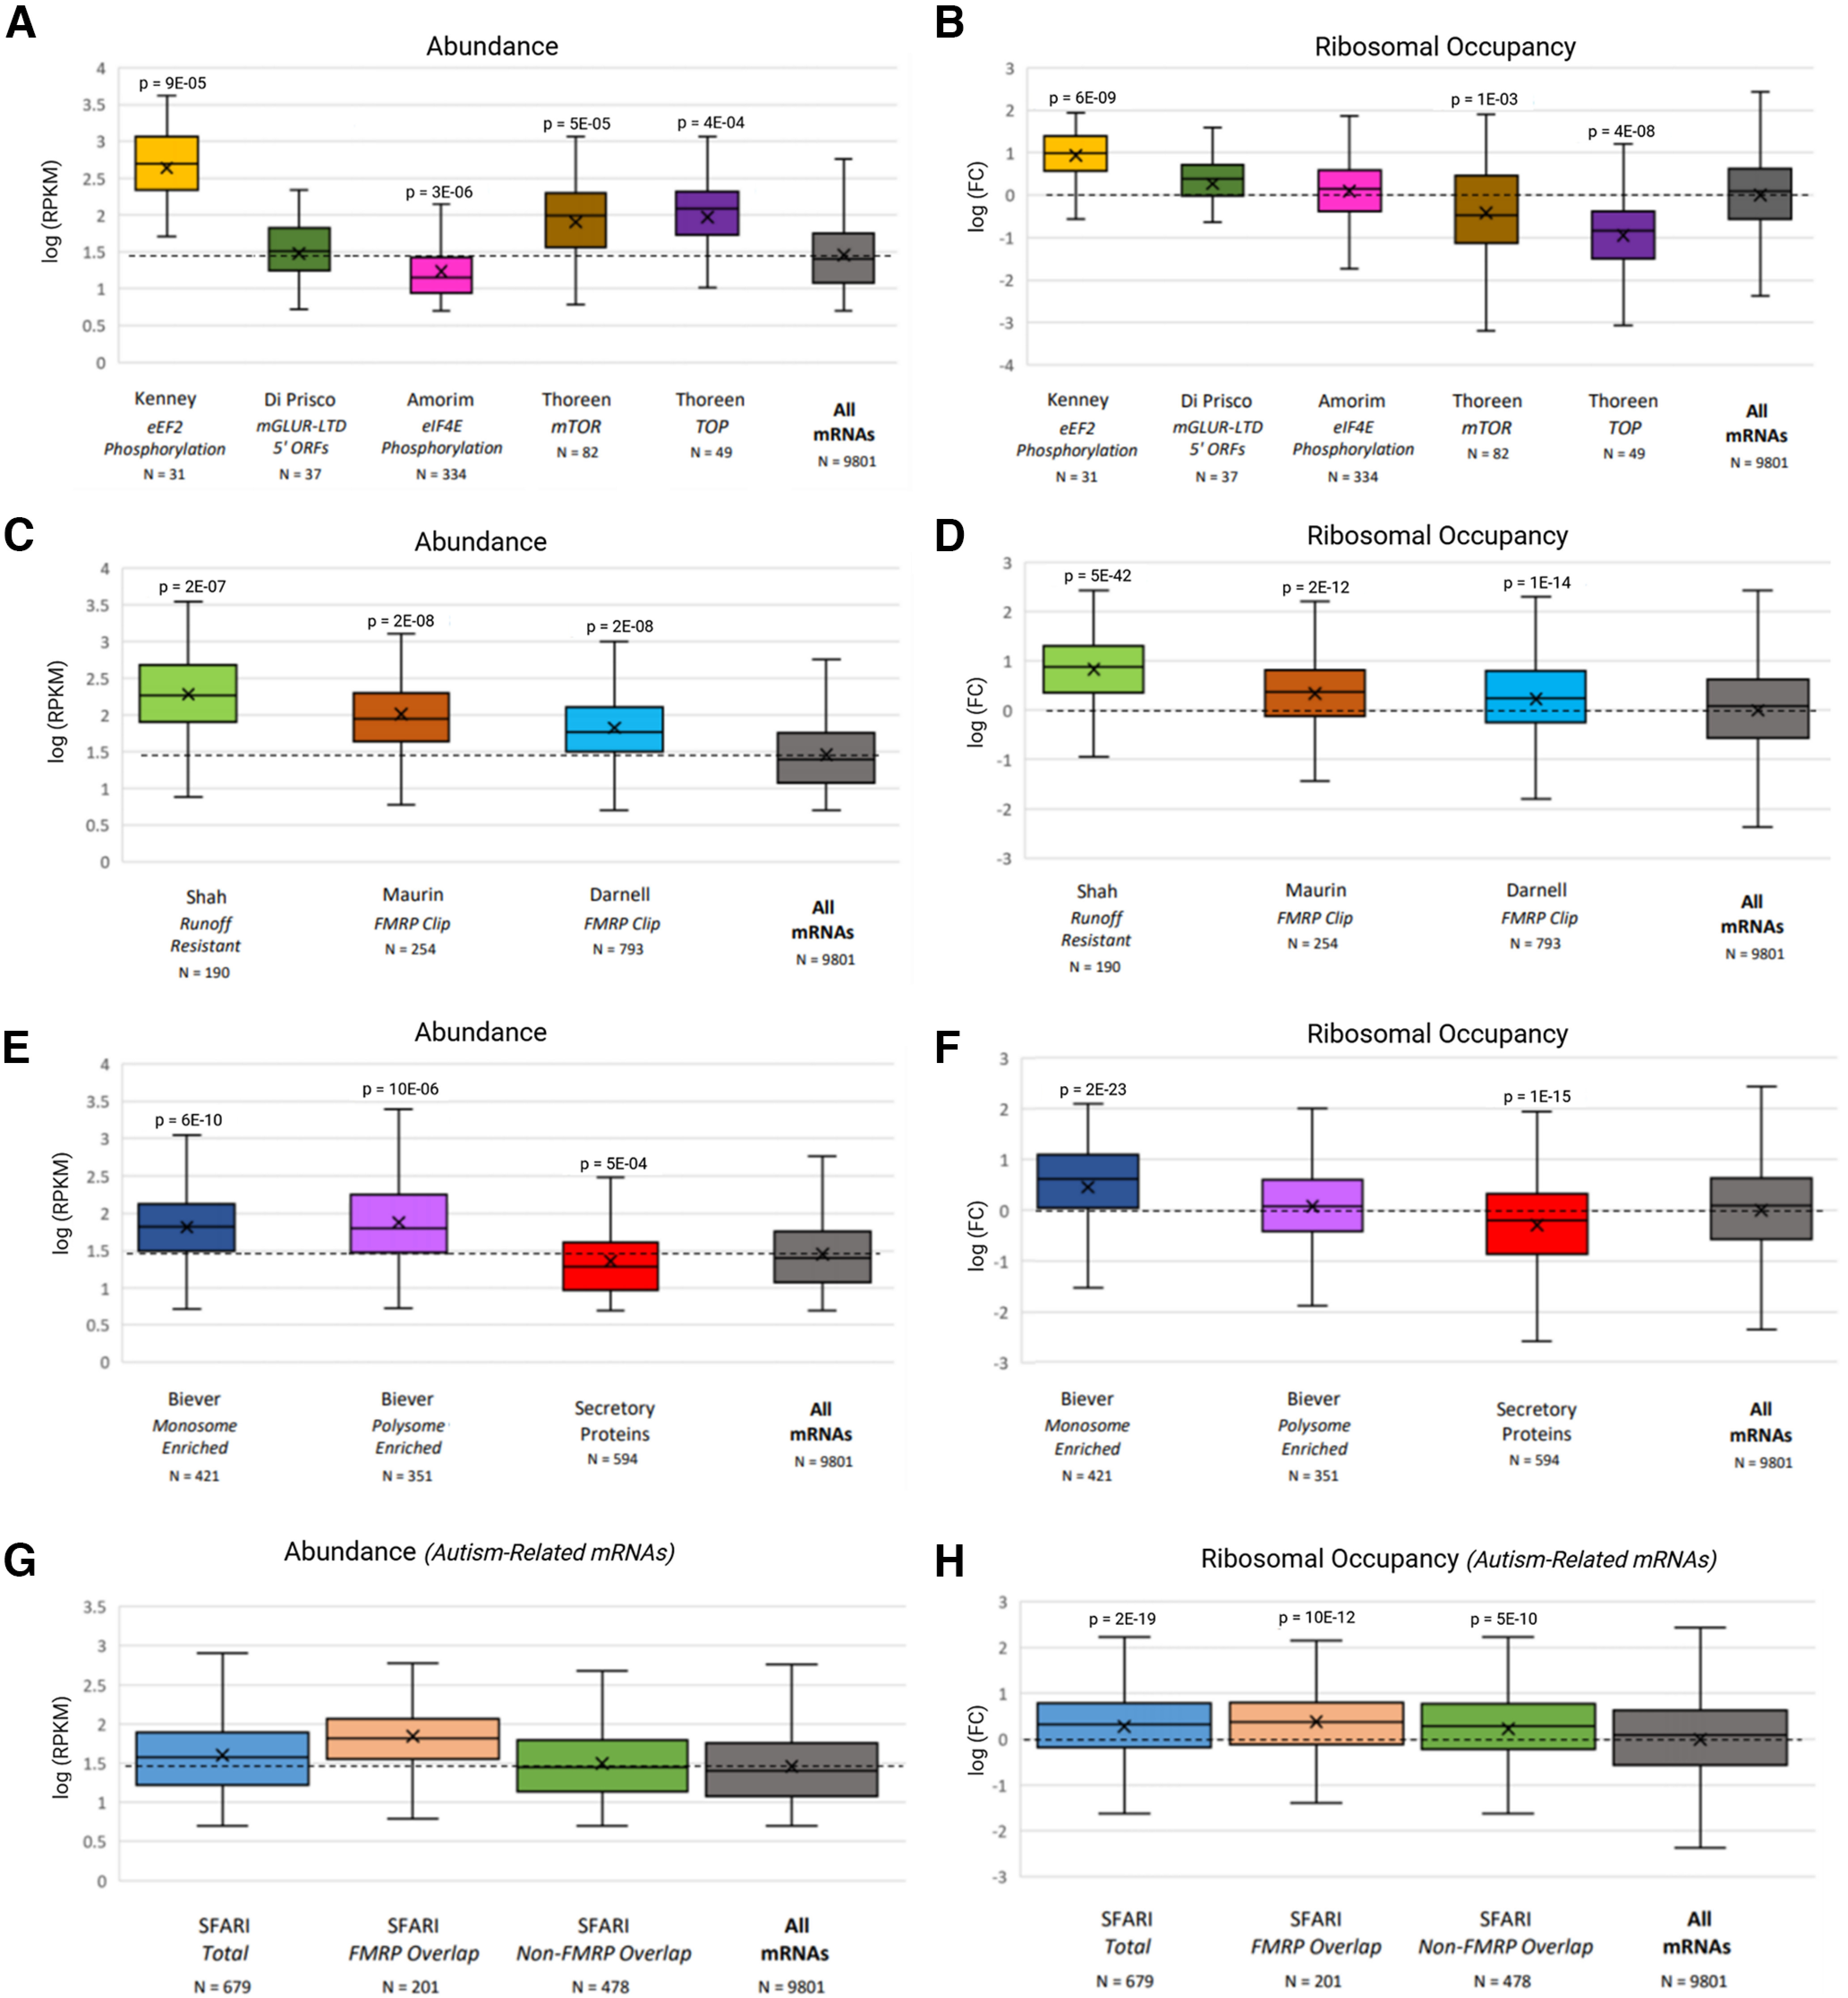
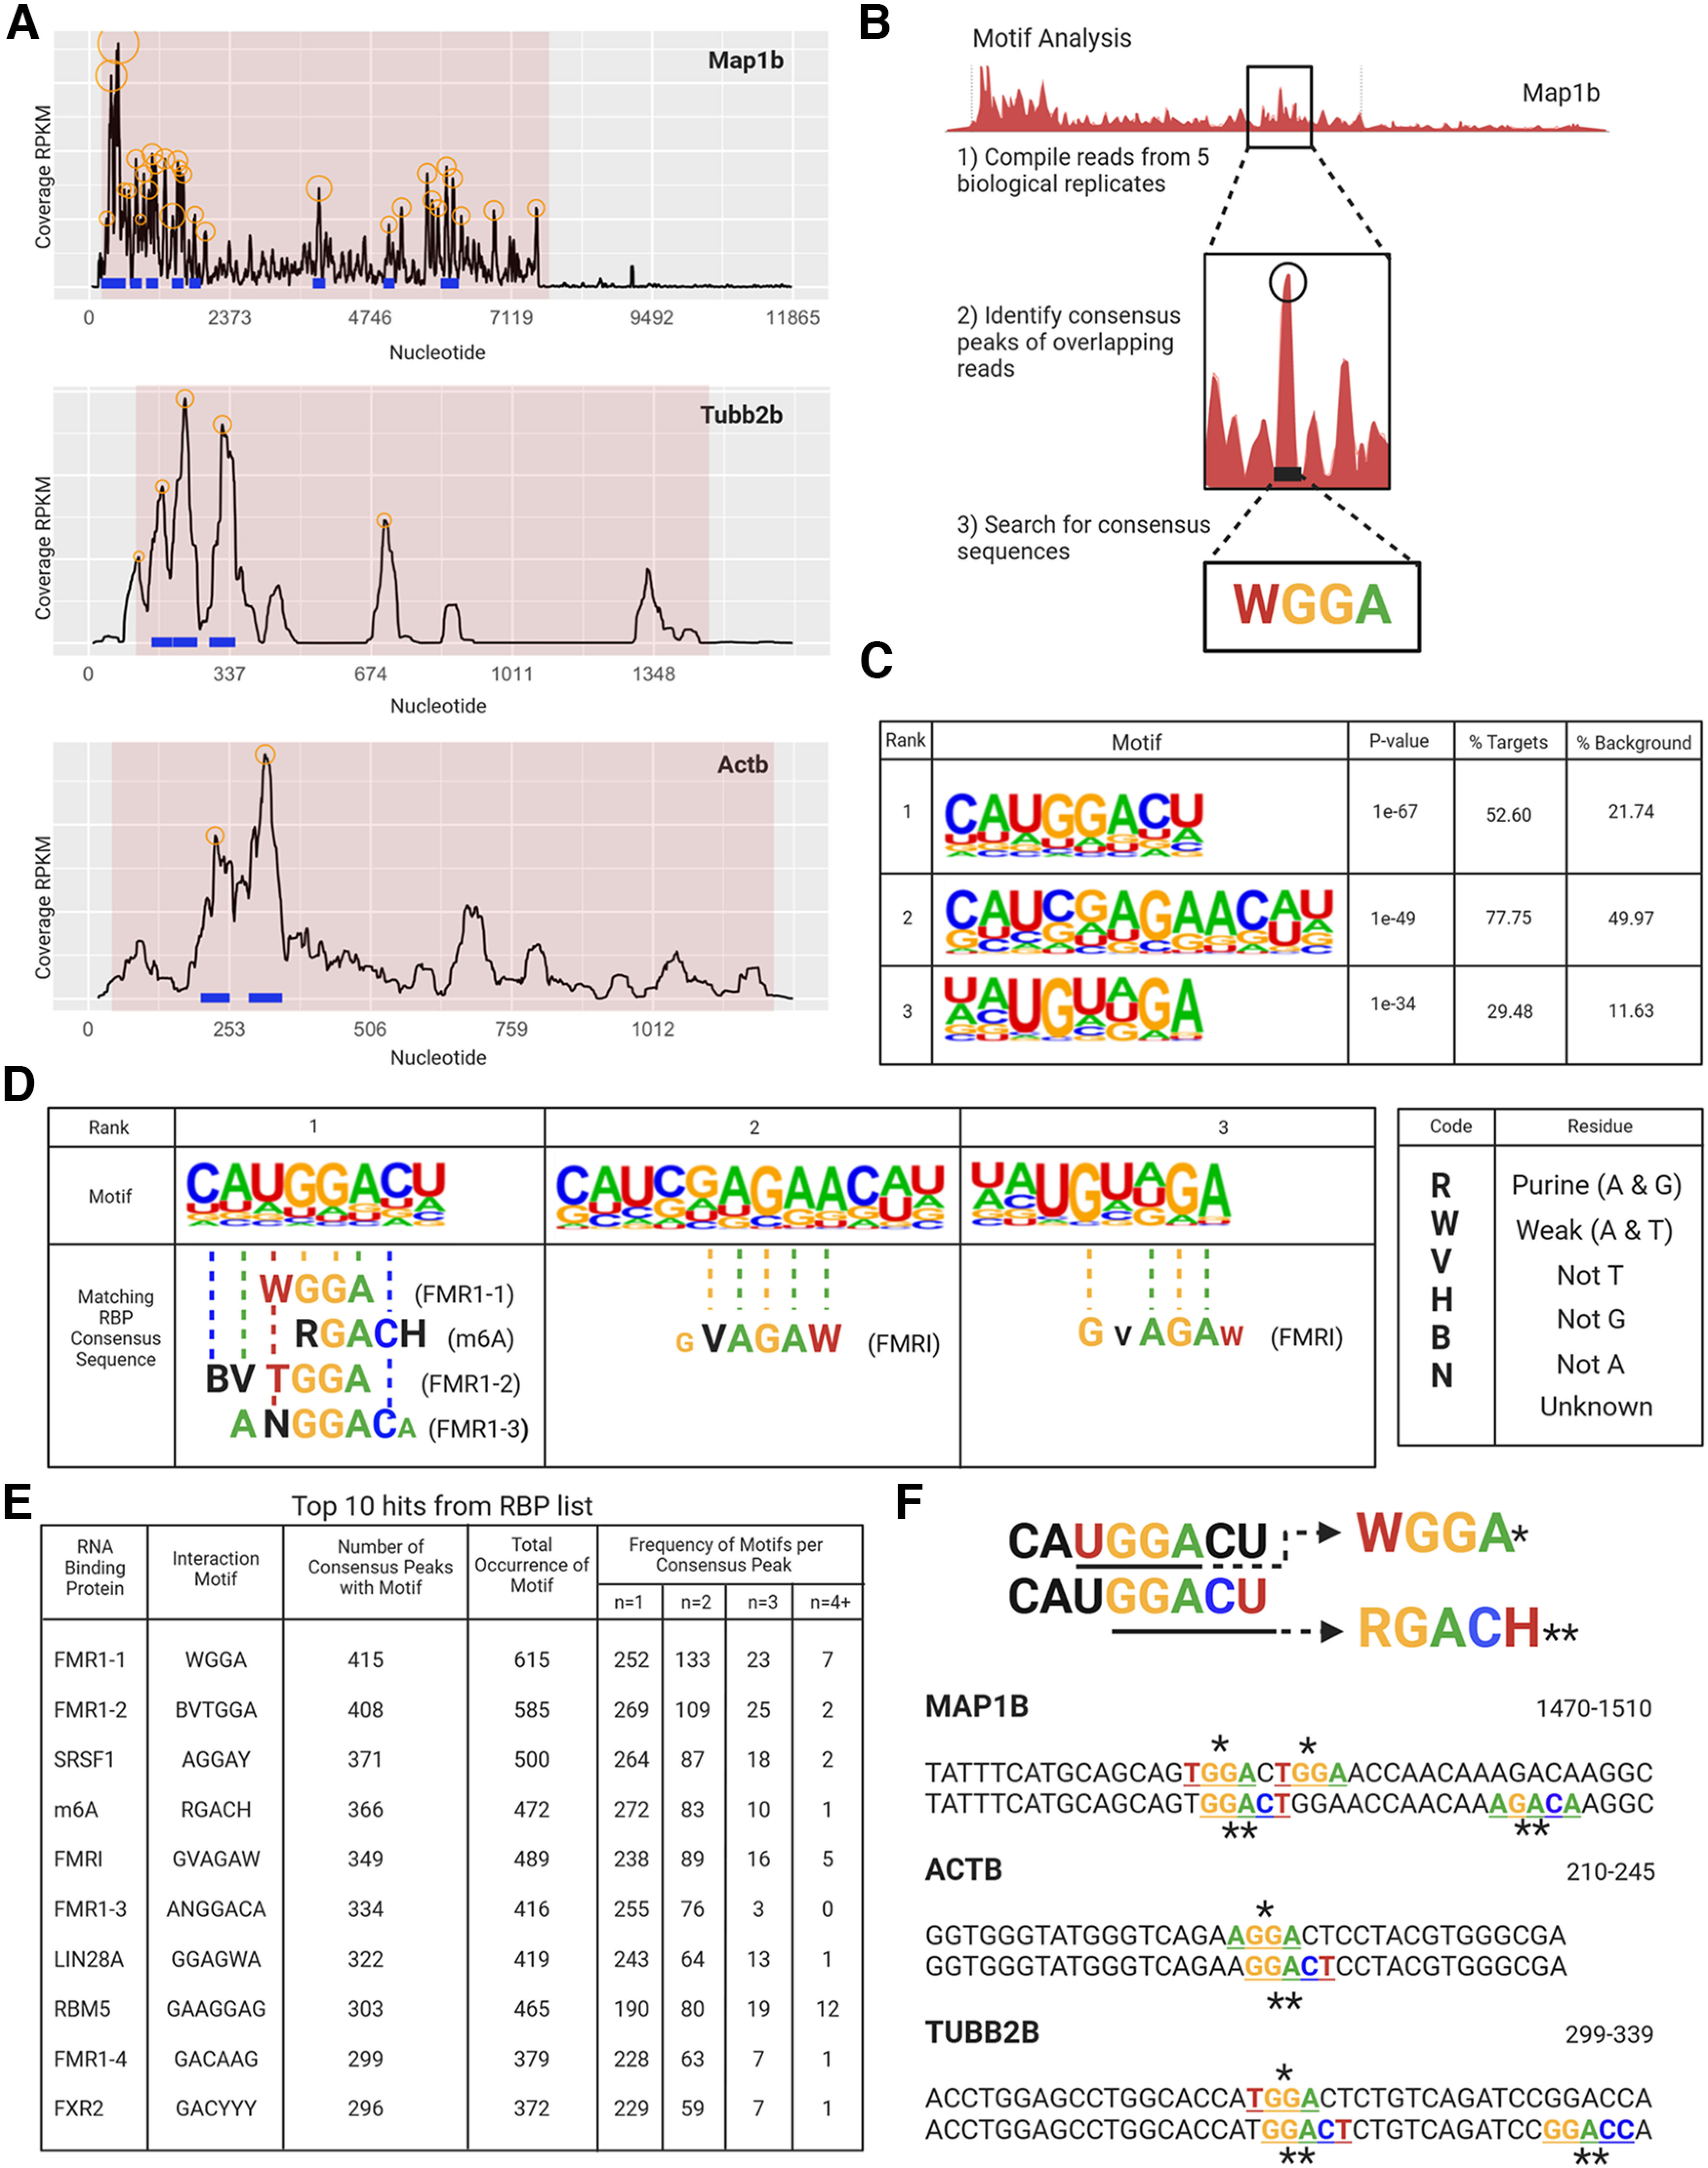
Local translation in neurons is partly mediated by the reactivation of stalled polysomes. Stalled polysomes may be enriched within the granule fraction, defined as the pellet of sucrose gradients used to separate polysomes from monosomes. The mechanism of how elongating ribosomes are reversibly stalled and unstalled on mRNAs is still unclear. In the present study, we characterize the ribosomes in the granule fraction using immunoblotting, cryogenic electron microscopy (cryo-EM), and ribosome profiling. We find that this fraction, isolated from 5-d-old rat brains of both sexes, is enriched in proteins implicated in stalled polysome function, such as the fragile X mental retardation protein (FMRP) and Up-frameshift mutation 1 homologue. Cryo-EM analysis of ribosomes in this fraction indicates they are stalled, mainly in the hybrid state. Ribosome profiling of this fraction reveals (1) an enrichment for footprint reads of mRNAs that interact with FMRPs and are associated with stalled polysomes, (2) an abundance of footprint reads derived from mRNAs of cytoskeletal proteins implicated in neuronal development, and (3) increased ribosome occupancy on mRNAs encoding RNA binding proteins. Compared with those usually found in ribosome profiling studies, the footprint reads were longer and were mapped to reproducible peaks in the mRNAs. These peaks were enriched in motifs previously associated with mRNAs cross-linked to FMRP in vivo, independently linking the ribosomes in the granule fraction to the ribosomes associated with FMRP in the cell. The data supports a model in which specific sequences in mRNAs act to stall ribosomes during translation elongation in neurons.SIGNIFICANCE STATEMENT Neurons send mRNAs to synapses in RNA granules, where they are not translated until an appropriate stimulus is given. Here, we characterize a granule fraction obtained from sucrose gradients and show that polysomes in this fraction are stalled on consensus sequences in a specific state of translational arrest with extended ribosome-protected fragments. This finding greatly increases our understanding of how neurons use specialized mechanisms to regulate translation and suggests that many studies on neuronal translation may need to be re-evaluated to include the large fraction of neuronal polysomes found in the pellet of sucrose gradients used to isolate polysomes.

Keywords: cryo-EM; elongation; neuroscience; protein synthesis; ribosome profiling; stalled ribosome.


Figures

Figure 1.
Figure 1.
Characterization of the granule fraction. A, Summary of protocol for isolating the GF from P5 rat whole-brain homogenate using sucrose gradient fractionation. B, Top, SDS-PAGE stained with Coomassie Brilliant Blue showing enrichment of the characteristic distribution of ribosomal proteins in Fractions 5–6 (PF) and Pellet (GF). Bottom, Immunoblot analysis (from a separate purification) of S6 ribosomal protein showing peaks in Fractions 5–6 (PF) and Pellet (GF). Top, Lanes are described (M, Molecular weight marker). C, Top, SDS-PAGE stained with Coomassie Brilliant Blue showing the distribution of proteins from Fraction 1 to Fraction 10, excluding the pellet. Bottom, UV absorption plot (A254) of the same experiment collected fractions 1–10 showing enrichment of polysomes in the PF. D, Negative stained electron micrograph of the GF and PF shows clusters of ribosomes of approximately the same size. E, Immunoblot analysis of starting material (PF; Fraction 5/6) and GF (Pellet) stained for RBPs implicated in RNA granules and stalled polysomes and other factors, FMRP, PURA, UPF1, eEF2, PNRC2, STAU2, ZBP1, G3BP, HNRNPA2B1, eIF4E, SMN, TIA1, p-S6, YTHDF1. One representative blot for each RBP is shown, each blot is normalized to the S6 staining from that blot, and the S6 blot is shown below each separate blot. F–P, Quantification of Western blots. The fold enrichment compared with starting material normalized to levels of S6 (see above, Materials and Methods) is shown for each RBP, FMRP (N = 3), PURA (N = 3), UPF1 (N = 6), eEF2 (N = 3), PNRC2 (N = 4), STAU2 (N = 4), ZBP1 (N = 4), G3BP (N = 3), hnRNPA2B1 (N = 3), eIF4E (N = 4), SMN (N = 3), TIA1 (N = 4), p-S6 (N = 4), and YTHDF1 (N = 4). Error bars indicate SEM.
Figure 2.
Figure 2.
Cleavage of compacted stalled polysomes into monosomes. A, Schematic of nuclease digestion of polysomes from GF into monosomes. B, Electron micrographs of negatively stained GF following treatment with and without RNase I, and with and without pretreatment with Salt (–Nuclease –Salt, top left; –Nuclease +Salt, top right; +Nuclease –Salt, bottom left; +Nuclease +Salt, bottom right). Scale bar, 100 nm. Note that EM images represent the GF treated with nuclease and salt before the second sucrose gradient and not the purified monosomes in Fraction 2 obtained from the second sucrose gradient. C–E, Western blot analysis for S6 ribosomal protein in sucrose gradient fractions. The GF was resuspended, treated with 0 μl (c), 0.5 μl (D) and 1 μl (E) RNase I, with or without pretreatment of 400 mm NaCl (–Salt, top; +Salt, bottom), followed by a 15–60% sucrose gradient run for 45 min, after which fractions were collected and run on Western blot (see above, Materials and Methods). F, Quantification of digestion measured as the ratio of mean S6 intensity of digested monosomes compared with pellet [Fraction 2/(Fraction 2 + Pellet)] represented as percentage of digestion to monosomes; N = 4 biological replicates. Error bars indicate SEM. Images where nuclease caused complete cleavage in the absence of salt as shown in Extended Data Figure 2-1.
Figure 3.
Figure 3.
Cryo-EM analysis of the digested ribosomes in the GF. A, B, Side view of the cryo-EM maps of class 1 (A) and class 2 (B) 80S ribosomes (top) found in the GF after nuclease digestion. The workflow used in defining the classes is shown in Extended Data Figure 3-1. The tRNA molecules observed in each of the maps are indicated. Bottom, A top view of the same cryo-EM maps. The resolution of these maps is shown in Extended Data Figure 3-2. The 40S and 60S subunits are shown as transparent densities for easier viewing of the position of the tRNA molecules in each class. The atomic model of the rRNA and r-protein components (uL10 and uL11) of the P stalk are indicated to show the lack of density existing for this structural motif. The atomic model of the P stalk components was obtained from Zhou et al. (2020; Protein Data Bank (PDB) ID 6XIQ) and shown in the same position and orientation that the P stalk would have adopted should this motif show density in these maps.
Figure 4.
Figure 4.
Purification of monosomes for ribosome footprinting. A, Schematic of the procedure, where the GF is treated with nucleases, and then sucrose gradient fractionation is used to isolate 80S monosomes. B, UV A254 absorbance of the sedimentation shows major peak in fraction 2. This is also the major fraction where S6 is found (Fig. 2E). C, Negative stained electron micrograph of Fraction 2 shows the presence of 80S monosomes in this fraction.
Figure 5.
Figure 5.
Ribosome footprinting of the GF. A, Diagram summarizing the footprinting procedure. B, Size distribution of footprint reads from GF (blue circles; N = 8 biological replicates) compared with polysome fraction (PF; orange squares; N = 3 biological replicates). Error bars indicate SEM. C, Read coverage of different size footprints from GF (small 32 nt) to 3′UTR, 5′UTR, and CDS. D, The number of read extremities (shading) for each read length (y-axis) based on distance from start (left, 0 on x-axis is A in ATG) and stop (right, 0 on x-axis is last nucleotide of stop codon) with the beginning of the read (5′) on top and the end of the read (3′) on bottom for GF. Data are shown for one biological replicate, but results are similar for all replicates. Similarity between replicates based on heat maps and principal component analysis are shown in Extended Data Figure 5-1. Replicates of the read extremities are shown in Extended Data Figure 5-2. E, Periodicity statistics for GF indicate that long reads (33–40) in frame 0 have significantly more periodicity than frame 1 and frame 2 for long reads, or any frame for short (21–24) and medium reads (25–32; ANOVA, F(261,8) = 13.9, p < 0.001; post hoc Tukey's HSD test, long reads in 0 frame; *p < 0.001 against long reads in frame 1 and frame 2 and other reads in frame 0); Error bars indicate SD, n = 39 long, 40 medium, 11 short (N is based on each read length in each biological replicate; not all read lengths are present in all biological replicates). Error bars indicate SD. F, Distribution of large reads for GF with the CDS of all transcripts normalized to the same length shows that reads are biased to the first half of the transcripts. The x-axis is the relative position in the transcript, and the y-axis is the average number of reads for that relative position. Data are shown for one biological replicate, but results are similar for all replicates.
Figure 6.
Figure 6.
GO Analysis of footprint mRNAs. A–D, GO terms of selected comparisons for most abundant (A), most ribosomally occupied (B), most enriched in GF compared with Total Polysomes (C) and most enriched in GF compared with the PF. Terms highlighted in red represent terms involved in cytoskeleton (A), RNA binding (B), and terms also found in A and B (C and D). The abundance, level of ribosome occupancy, and enrichment to PF or total polysomes for all mRNAs are shown in Extended Data Table 6-1. GO analysis using different numbers of the top-ranked mRNAs is shown in Extended Data Table 6-2.
Figure 7.
Figure 7.
Correlation analysis of most abundant and ribosomally occupied mRNAs in ribosome footprints. A, B, Comparison of footprint reads of most abundant (A) and most ribosomally occupied (B) mRNAs (Extended Data Fig. 7-1), enrichment to the total polysomes and GF), to mRNAs regulated by translation elongation (58), upregulated by mGluR with upstream open reading frames (61), eIF4E phosphorylation (59), mTOR (60), and TOP mRNAs (60). C, D, Comparison of most abundant (C) and most ribosomally occupied (D) mRNAs to run-off-resistant mRNAs (19) and mRNAs that are CLIPped by FMRP (17, 62). E–F, Comparison of most abundant (E) and most ribosomally occupied (F) mRNAs to mRNAs translated preferentially by monosomal and polysomal ribosomes in the neuropil (36) and secretory mRNAs (secretory proteins with reviewed annotation from UNIPROT), compared with all mRNAs. G, H, Comparison of most abundant (G) and most ribosomally occupied (H) mRNAs to autism-related mRNAs from the SFARI database (syndromic and levels 1–3). The total SFARI group was also divided into ones that are also in the FMRP CLIP group (17, 62) and ones that are not. For all groups there was a cutoff of 5 RPKM to avoid mRNAs not expressed in the nervous system; p values from comparison to all mRNAs (Students t test with Bonferroni correction for multiple tests; n = 14 for all comparisons in figure). Only significant p values (p < 0.01 after correction) are shown; log(FCl), Log (base 10) fold change. The dotted line shows y = 0 value. Bottom, N for each comparison group is shown. Comparison of abundance and ribosome occupancy between mRNAs in neuronal dendrites and other mRNAs is shown in Extended Data Figure 7-2. Similar correlation analysis seen in this figure using only mRNAs found in neuronal dendrites is shown in Extended Data Figure 7-3. Correlation of footprint read abundance with length of mRNAs is shown in Extended Data Figure 7-4.
Figure 8.
Figure 8.
Sequences underlying ribosome-protected fragments are enriched in sequences matching FMRP CliPs. A, mRNA profiles of Map1b, β-actin, and Tubulin 2b showing reproducible consensus peaks in the CDS; circles represent consensus peaks of footprint reads mapping to the same sequence, blue lines represent reproducible consensus peaks across biological replicates, red shading represents CDS. All replicates are shown in Extended Data Figure 8-1. The list of all peaks and their positions in the mRNAs can be found in Extended Data Table 8-1. Analysis of the codon frequency of the codons in the peaks is shown in Extended Data Figure 8-2. Codon analysis of the peaks can be found in Extended Data Table 8-2. B, Diagram summarizing how motif analysis is done. C, Results from the HOMER program show the only three consensus sequences above the cutoff provided by HOMER. D, HOMER identified motifs overlapped with matching interaction motifs for RBPs listed in brackets. Residues that do not match are given in smaller font. Right, Code key for residue annotation. E, Table of top 10 RBPs with RNA interaction motifs present in consensus peaks. The number of peaks with multiple hits is also shown as Frequency of Motifs per Consensus Peak; n = x represents the number of motifs per consensus peak. All RBPs motifs examined are shown in Extended Data Table 8-3. F, Top-ranked consensus sequence from HOMER showing overlapping sites for interaction motifs WGGA (*) and RGACH (**), and their corresponding residues on a single peak from Map1b, β-actin, and Tubulin 2b. Both sequences given for each protein are identical, but they have been annotated to show clusters of motifs that map to the same consensus sequence. Right, Numbers indicate the location of the sequence in each mRNA that correspond to a consensus peak (blue) on the mRNA profiles shown in A.

Similar articles

Cited by

References

    1. Amorim IS, Kedia S, Kouloulia S, Simbriger K, Gantois I, Jafarnejad SM, Li Y, Kampaite A, Pooters T, Romanò N, Gkogkas CG (2018) Loss of eIF4E phosphorylation engenders depression-like behaviors via selective mRNA translation. J Neurosci 38:2118–2133. 10.1523/JNEUROSCI.2673-17.2018 - DOI - PMC - PubMed
    1. Anadolu MN, Sossin WS (2021) Focusing on mRNA granules and stalled polysomes amidst diverse mechanisms underlying mRNA transport, mRNA storage and local translation. In: Oxford handbook of neuronal protein synthesis. (Sossin W, ed), pp. 239–268. NewYork: Oxford UP.
    1. Anderson BR, Chopra P, Suhl JA, Warren ST, Bassell GJ (2016) Identification of consensus binding sites clarifies FMRP binding determinants. Nucleic Acids Res 44:6649–6659. 10.1093/nar/gkw593 - DOI - PMC - PubMed
    1. Ascano M Jr, Mukherjee N, Bandaru P, Miller JB, Nusbaum JD, Corcoran DL, Langlois C, Munschauer M, Dewell S, Hafner M, Williams Z, Ohler U, Tuschl T (2012) FMRP targets distinct mRNA sequence elements to regulate protein expression. Nature 492:382–386. 10.1038/nature11737 - DOI - PMC - PubMed
    1. Aschrafi A, Cunningham BA, Edelman GM, Vanderklish PW (2005) The fragile X mental retardation protein and group I metabotropic glutamate receptors regulate levels of mRNA granules in brain. Proc Natl Acad Sci U S A 102:2180–2185. 10.1073/pnas.0409803102 - DOI - PMC - PubMed

Publication types

Substances

Associated data

Grants and funding