. 2023 Feb 27;14(1):1115.
doi: 10.1038/s41467-023-36772-x.

Phenotypic characterization of single CD4+ T cells harboring genetically intact and inducible HIV genomes

Affiliations

Phenotypic characterization of single CD4+ T cells harboring genetically intact and inducible HIV genomes

Caroline Dufour et al. Nat Commun. .

Abstract

The phenotype of the rare HIV-infected cells persisting during antiretroviral therapies (ART) remains elusive. We developed a single-cell approach that combines the phenotypic analysis of HIV-infected cells with near full-length sequencing of their associated proviruses to characterize the viral reservoir in 6 male individuals on suppressive ART. We show that individual cells carrying clonally expanded identical proviruses display very diverse phenotypes, indicating that cellular proliferation contributes to the phenotypic diversification of the HIV reservoir. Unlike most viral genomes persisting on ART, inducible and translation-competent proviruses rarely present large deletions but are enriched in defects in the Ψ locus. Interestingly, the few cells harboring genetically intact and inducible viral genomes express higher levels of the integrin VLA-4 compared to uninfected cells or cells with defective proviruses. Viral outgrowth assay confirmed that memory CD4+ T cells expressing high levels of VLA-4 are highly enriched in replication-competent HIV (27-fold enrichment). We conclude that although clonal expansions diversify the phenotype of HIV reservoir cells, CD4+ T cells harboring replication-competent HIV retain VLA-4 expression.


Conflict of interest statement

The authors declare no competing interests.

Figures
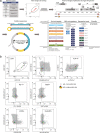
Fig. 1
Fig. 1. Near full-length genome sequencing in single p24-expressing cells.
a Isolated CD4+ T cells were stimulated with PMA/ionomycin for 24 h in the presence of BFA prior to extracellular and intracellular staining using antibodies specific to the cellular and viral proteins listed in the HIV-Flow panel table. Single p24+ cells were index-cell sorted in individual wells. NFL HIV amplification by nested PCR was performed on each single sorted p24+ cells, followed by PacBio next-generation sequencing. Proviruses were analyzed individually for their genetic integrity. Levels of expression of cellular markers on each individual cell was retrieved and analyzed according to the genetic integrity and clonality of the provirus from this cell. b Representative dot plots of an HIV-Flow staining from participant ART5. Each colored dot represents a single infected cell (p24+) that was index-sorted. p24+ cells are overlaid onto p24− cells in grey.
Fig. 2
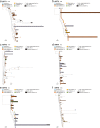
Fig. 2. Phylogenetic analysis of HIV genomes in p24+ and p24− populations from 6 ART-treated participants.
Maximum-likelihood phylogenetic trees of proviral genomes retrieved from p24+ cells (dot) and p24− cells (triangle) from the 6 participants: a ART1, b ART2, c ART3, d ART4, e ART5 and f ART6. Each genetic integrity/defect category is color-coded. Clonal expansions of identical proviruses are framed in black rectangles. The total number of proviruses sequenced for each participant are indicated at the top of each tree next to each category. The HXB2 sequence (black dot) was included as a reference in each tree.
Fig. 3
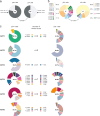
Fig. 3. Clonality of the inducible and non-induced reservoirs.
a Pie charts representing the proportions of unique (light grey) and clonally expanded (i.e., ≥2 copies, dark grey) proviruses in the p24+ and p24− populations from the 6 participants. Two-sided Fisher’s exact test (p < 0.0001) of the contribution of clonally expanded proviral sequences to the total number of HIV genomes was performed between the two populations. The numbers of HIV genomes are indicated in each pie chart. b Distributions of clonal expansions from the 6 participants. Proportions of clones according to their size are represented for each cell population, with the total number of clonal expansions indicated in the pie charts. Difference in the contribution of clones with ≥5 copies (exploded from the piecharts) between p24+ and p24− cells was tested with two-sided Fisher’s exact test (p = 0.0073). c Clonally expanded proviruses in the p24+ and p24− populations of the 6 participants. Each expansion is depicted by a different color. Shared clones between the p24+ and p24− populations are exploded from the charts and are depicted in solid colors. Contributions of clonal expansions to each population are indicated in the pie charts. The number of shared clones and their copy numbers are indicated in the middle column.
Fig. 4
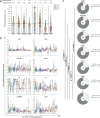
Fig. 4. Phenotype of clonally expanded cells harboring inducible and translation-competent proviruses.
Levels of expression of PD-1, TIGIT, HLA-DR, ICOS, α4, β1, CD45RA and CCR7 is represented by the ratio between the fluorescence intensity of a cellular marker on each p24+ single sorted-cell and the mean fluorescence intensity of this marker on all CD4+ T cells from the same participant. A normalized expression level above or below 1 (dotted line) reflects a higher or lower expression of this marker on a given p24+ cell compared to all CD4+ T cells, respectively. Each dot represents a single-sorted cell and is color-coded by the participant. a Normalized expression levels of each marker for all clonally expanded p24+ cells (n = 239 independent clonally expanded proviruses). Mean fold differences in levels of expression and standard deviations are indicated at the top of the graph. Grey bars indicate the mean normalized expression level for each marker. b Normalized expression levels of individual p24-expressing cells belonging to each individual clone. Single-sorted cells belonging to the same clone are grouped in each column and color-coded by the participant. c Pie charts representing the proportions of unique (light grey) and clonally expanded (dark grey) proviral sequences expressing each marker. The numbers of proviral sequences retrieved from p24+ cells expressing each marker are indicated in the center of the pie chart. Differences in the frequency of clonal proviruses between each subset were assessed by a two-sided Chi-square t-test (*p < 0.05; **p < 0.01; ***p < 0.001).
Fig. 5
Fig. 5. Near full-length proviral sequencing and integrity analysis of HIV genomes retrieved from p24+ and p24− cells.
HIV genomes obtained from p24+ cells (a) and p24− cells (b) from the 6 participants were aligned to the annotated HXB2 reference sequence. Each sequence is color-coded according to its integrity category (see legend in 5d). Clonally expanded proviruses are only displayed once. c Lengths of individual HIV genomes retrieved from p24+ and p24− cells are plotted: Each dot corresponds to a proviral sequence and is color-coded by participant (see legend in 5e). The median of each violin plot is represented by a red horizontal line, and the mean and median values are indicated at the bottom of the graph. Difference in the length of HIV genomes between p24+ and p24− populations was assessed by the Kolmogorov-Smirnov test (****p < 0.0001). d Proportions of proviruses displaying different types of genetic defects in p24+ and p24− cells. Numbers of proviral sequences analyzed are indicated in the pie charts. Differences in the proportion of proviruses displaying different types of defects between p24+ and p24− cells were assessed by the two-sided Fisher’s exact test (**p = 0.0038; ****p < 0.0001). e The proportions of viral genomes with intact Ψ, gag, pol, vif, vpr, tat, rev, vpu, nef env and RRE (rev responsive element) were compared between p24+ and p24− cells. Each participant is color-coded, and total number of sequences analyzed are indicated next to the legend. Means and standard deviations (STD) are indicated at the bottom of the graph. Differences in the percentage of intact Ψ between p24+ and p24− populations were assessed by the non-parametric two-tailed Wilcoxon paired t-test (*p = 0.0312).
Fig. 6
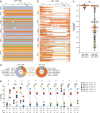
Fig. 6. Phenotype of cells harboring inducible, translation- and replication-competent proviruses.
a Normalized expression levels of PD-1, ICOS, CD45RA, TIGIT, HLA-DR, CCR7, α4, and β1 on cells harboring HIV genomes with different types of genetic defects. Each dot corresponds to a single cell, and cells are grouped according to the genetic defects found in the viral genomes they carry. In each panel, the violin plot on the right includes all defective proviruses grouped together. Two-tailed Mann-Whitney unpaired nonparametric t-tests were performed to assess differences in the expression level of each marker between intact proviruses and all other categories (*p < 0.05; **p < 0.01; ***p < 0.001). In all panels, the threshold ratio of 1 is indicated by a dotted line and the medians of the violin plots are represented by red lines. b Phenotypic analysis of the p24+ cells harboring intact HIV genomes. Grey square denotes the expression of a given marker. Frequencies of p24+ cells with intact provirus expressing each marker are indicated at the top of the table. c Integrated HIV DNA (copies per million CD4+ T cells) was measured in sorted memory CD4+ T cells expressing or not VLA-4 from 9 ART-treated participants. Differences were assessed by the non-parametric two-tailed Wilcoxon paired t-test (*p = 0.0273). d Frequency of memory CD4+ T cells with replication-competent HIV was measured by QVOA in sorted cells from 6 participants expressing or not VLA-4. Differences in infectious units per million cells (IUPM) between memory CD4+ T cells expressing VLA-4 or not were assessed by the non-parametric two-tailed Wilcoxon paired t-test (*p = 0.0312). Samples with undetectable IUPM values were plotted at the limit of detection of the assay (open circles).

Similar articles

Cited by

References

    1. Finzi D, et al. Identification of a reservoir for HIV-1 in patients on highly active antiretroviral therapy. Science. 1997;278:1295–1300. doi: 10.1126/science.278.5341.1295. - DOI - PubMed
    1. Wong JK, et al. Recovery of replication-competent HIV despite prolonged suppression of plasma viremia. Science. 1997;278:1291–1295. doi: 10.1126/science.278.5341.1291. - DOI - PubMed
    1. Chun TW, et al. In vivo fate of HIV-1-infected T cells: quantitative analysis of the transition to stable latency. Nat. Med. 1995;1:1284–1290. doi: 10.1038/nm1295-1284. - DOI - PubMed
    1. Chun TW, et al. Presence of an inducible HIV-1 latent reservoir during highly active antiretroviral therapy. Proc. Natl Acad. Sci. USA. 1997;94:13193–13197. doi: 10.1073/pnas.94.24.13193. - DOI - PMC - PubMed
    1. Han Y, et al. Resting CD4+ T cells from human immunodeficiency virus type 1 (HIV-1)-infected individuals carry integrated HIV-1 genomes within actively transcribed host genes. J. Virol. 2004;78:6122–6133. doi: 10.1128/JVI.78.12.6122-6133.2004. - DOI - PMC - PubMed

Publication types

Substances