. 2023 Jul;18(7):808-817.
doi: 10.1038/s41565-023-01321-6. Epub 2023 Feb 27.

Structure, folding and flexibility of co-transcriptional RNA origami

Affiliations

Structure, folding and flexibility of co-transcriptional RNA origami

Ewan K S McRae et al. Nat Nanotechnol. 2023 Jul.

Abstract

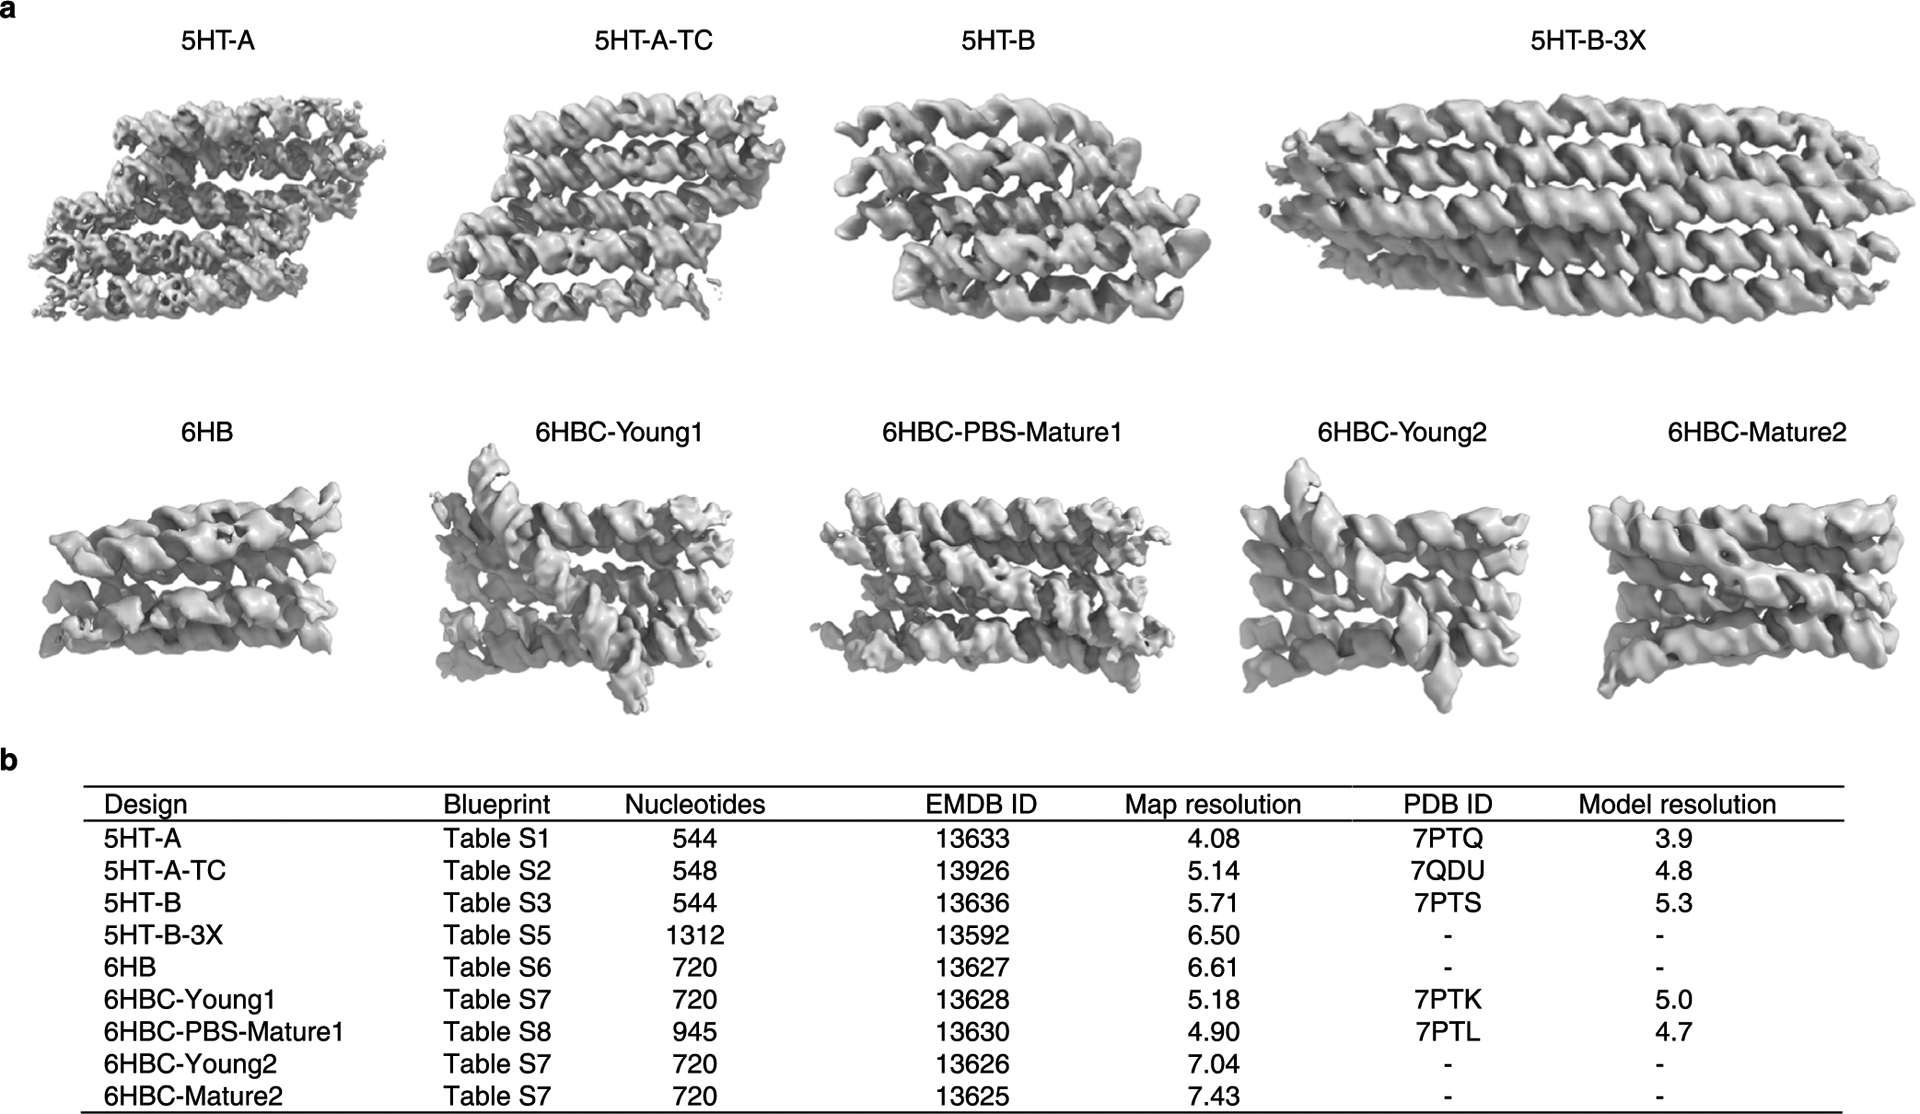
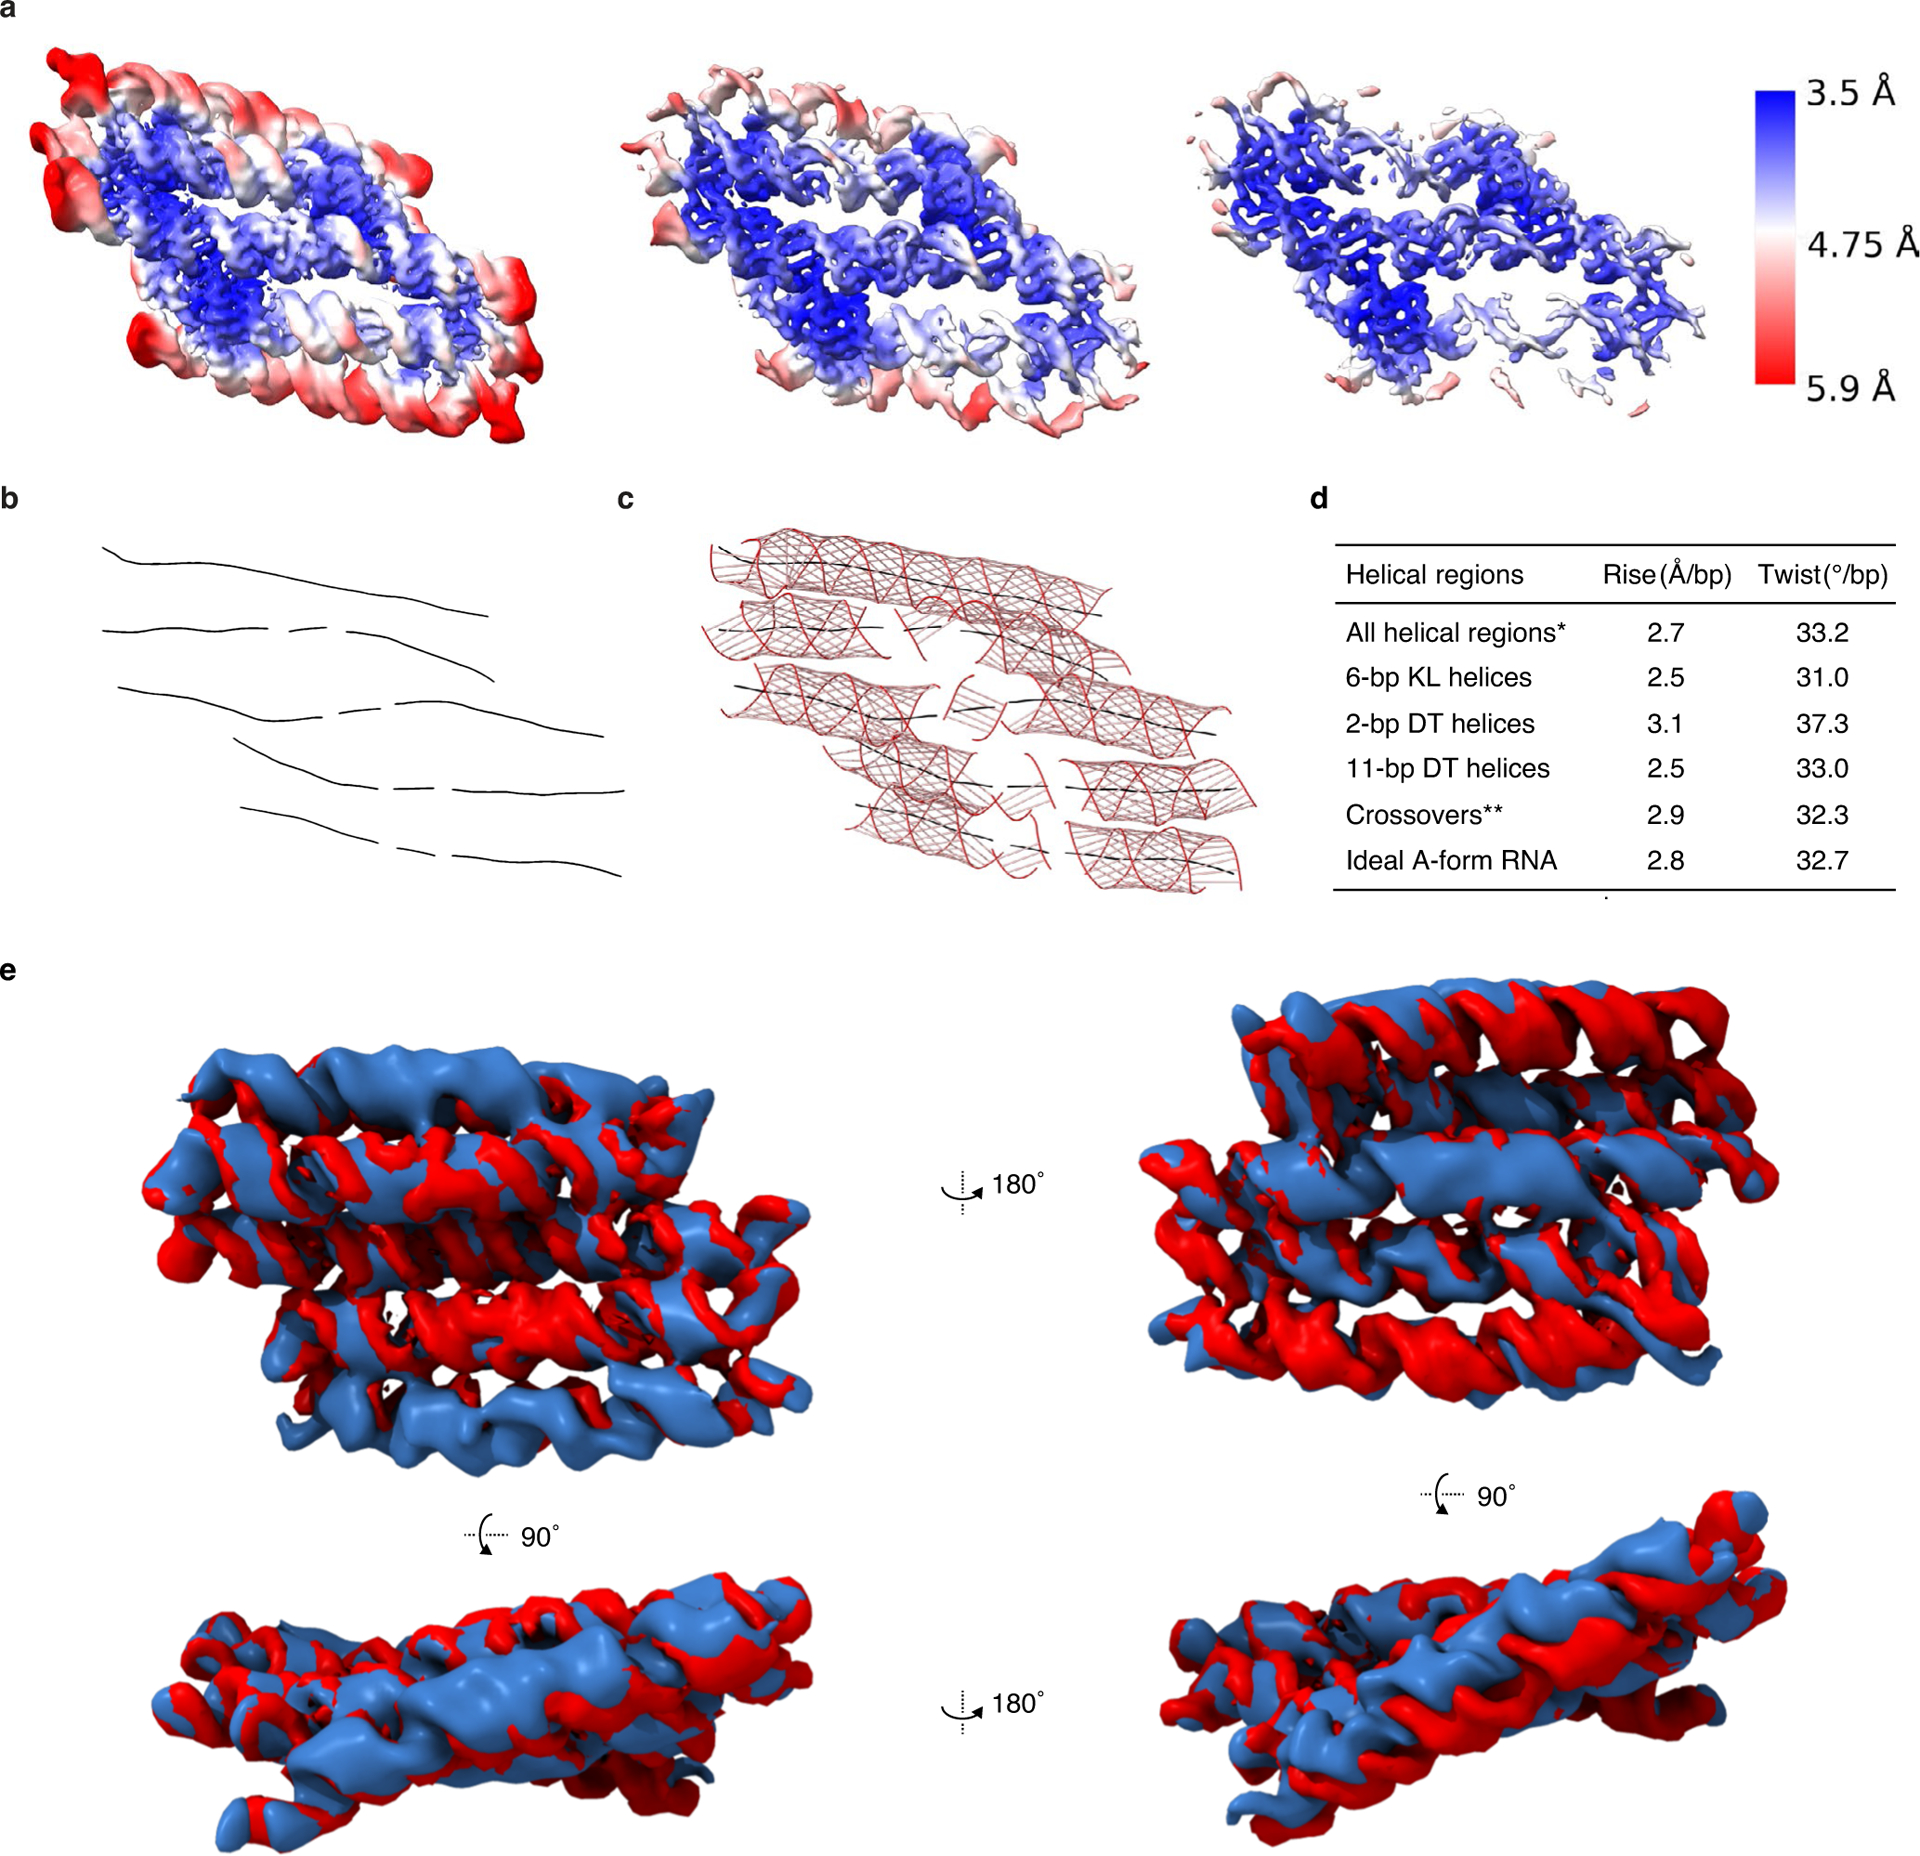
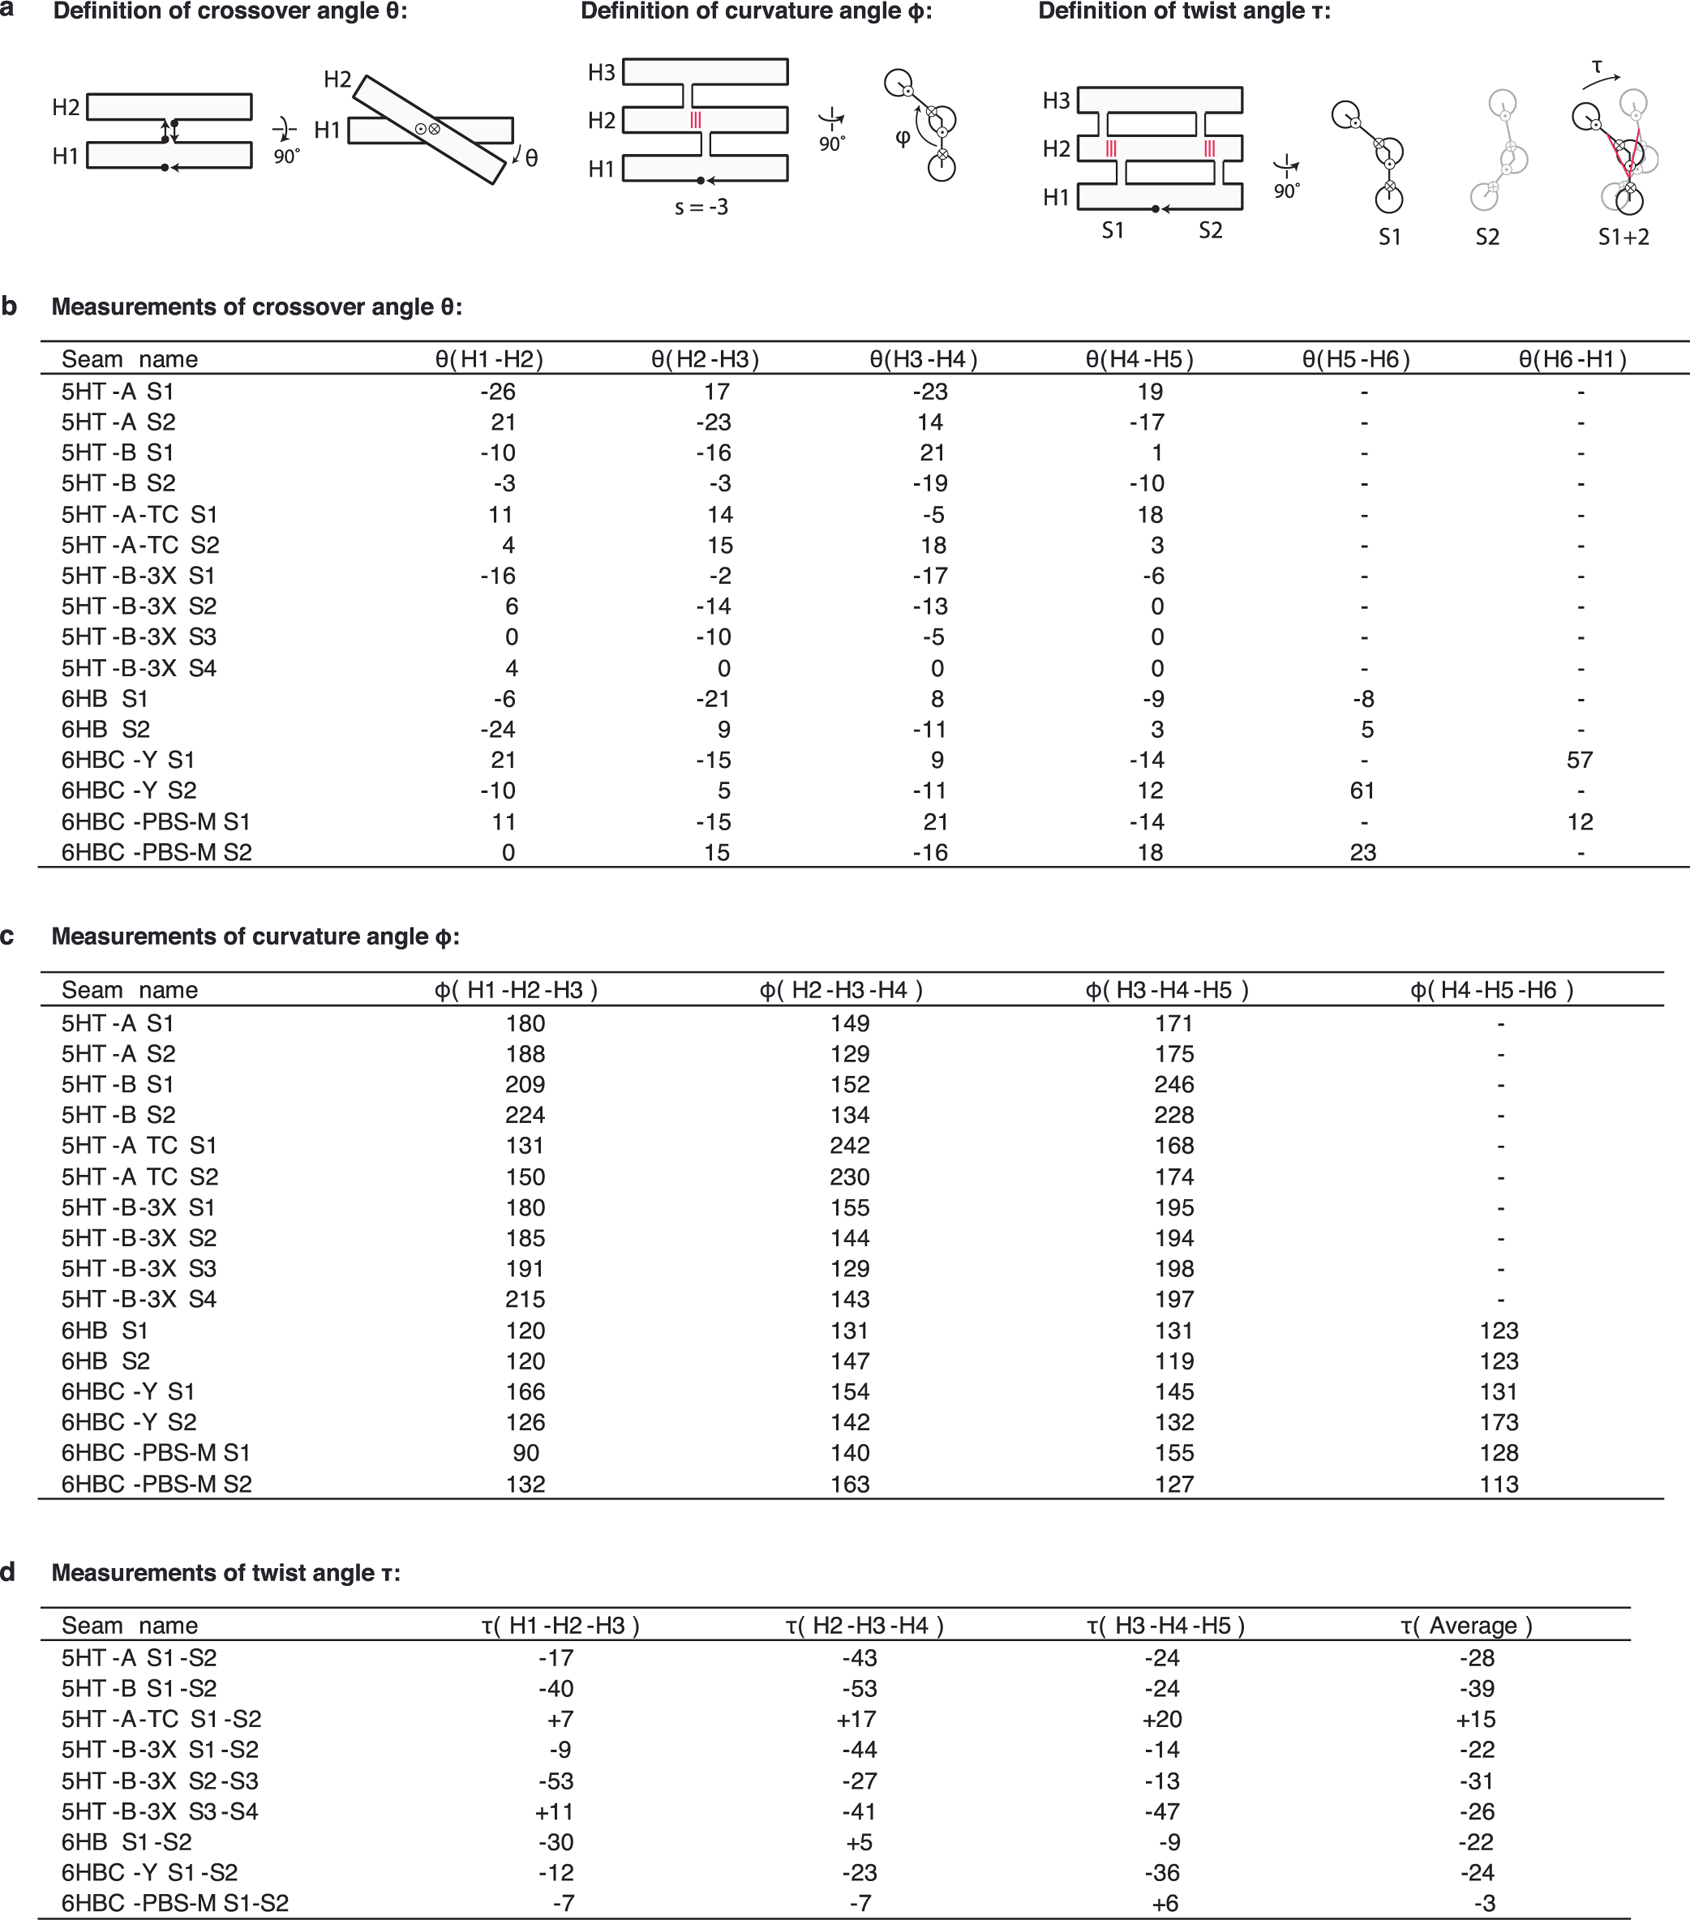
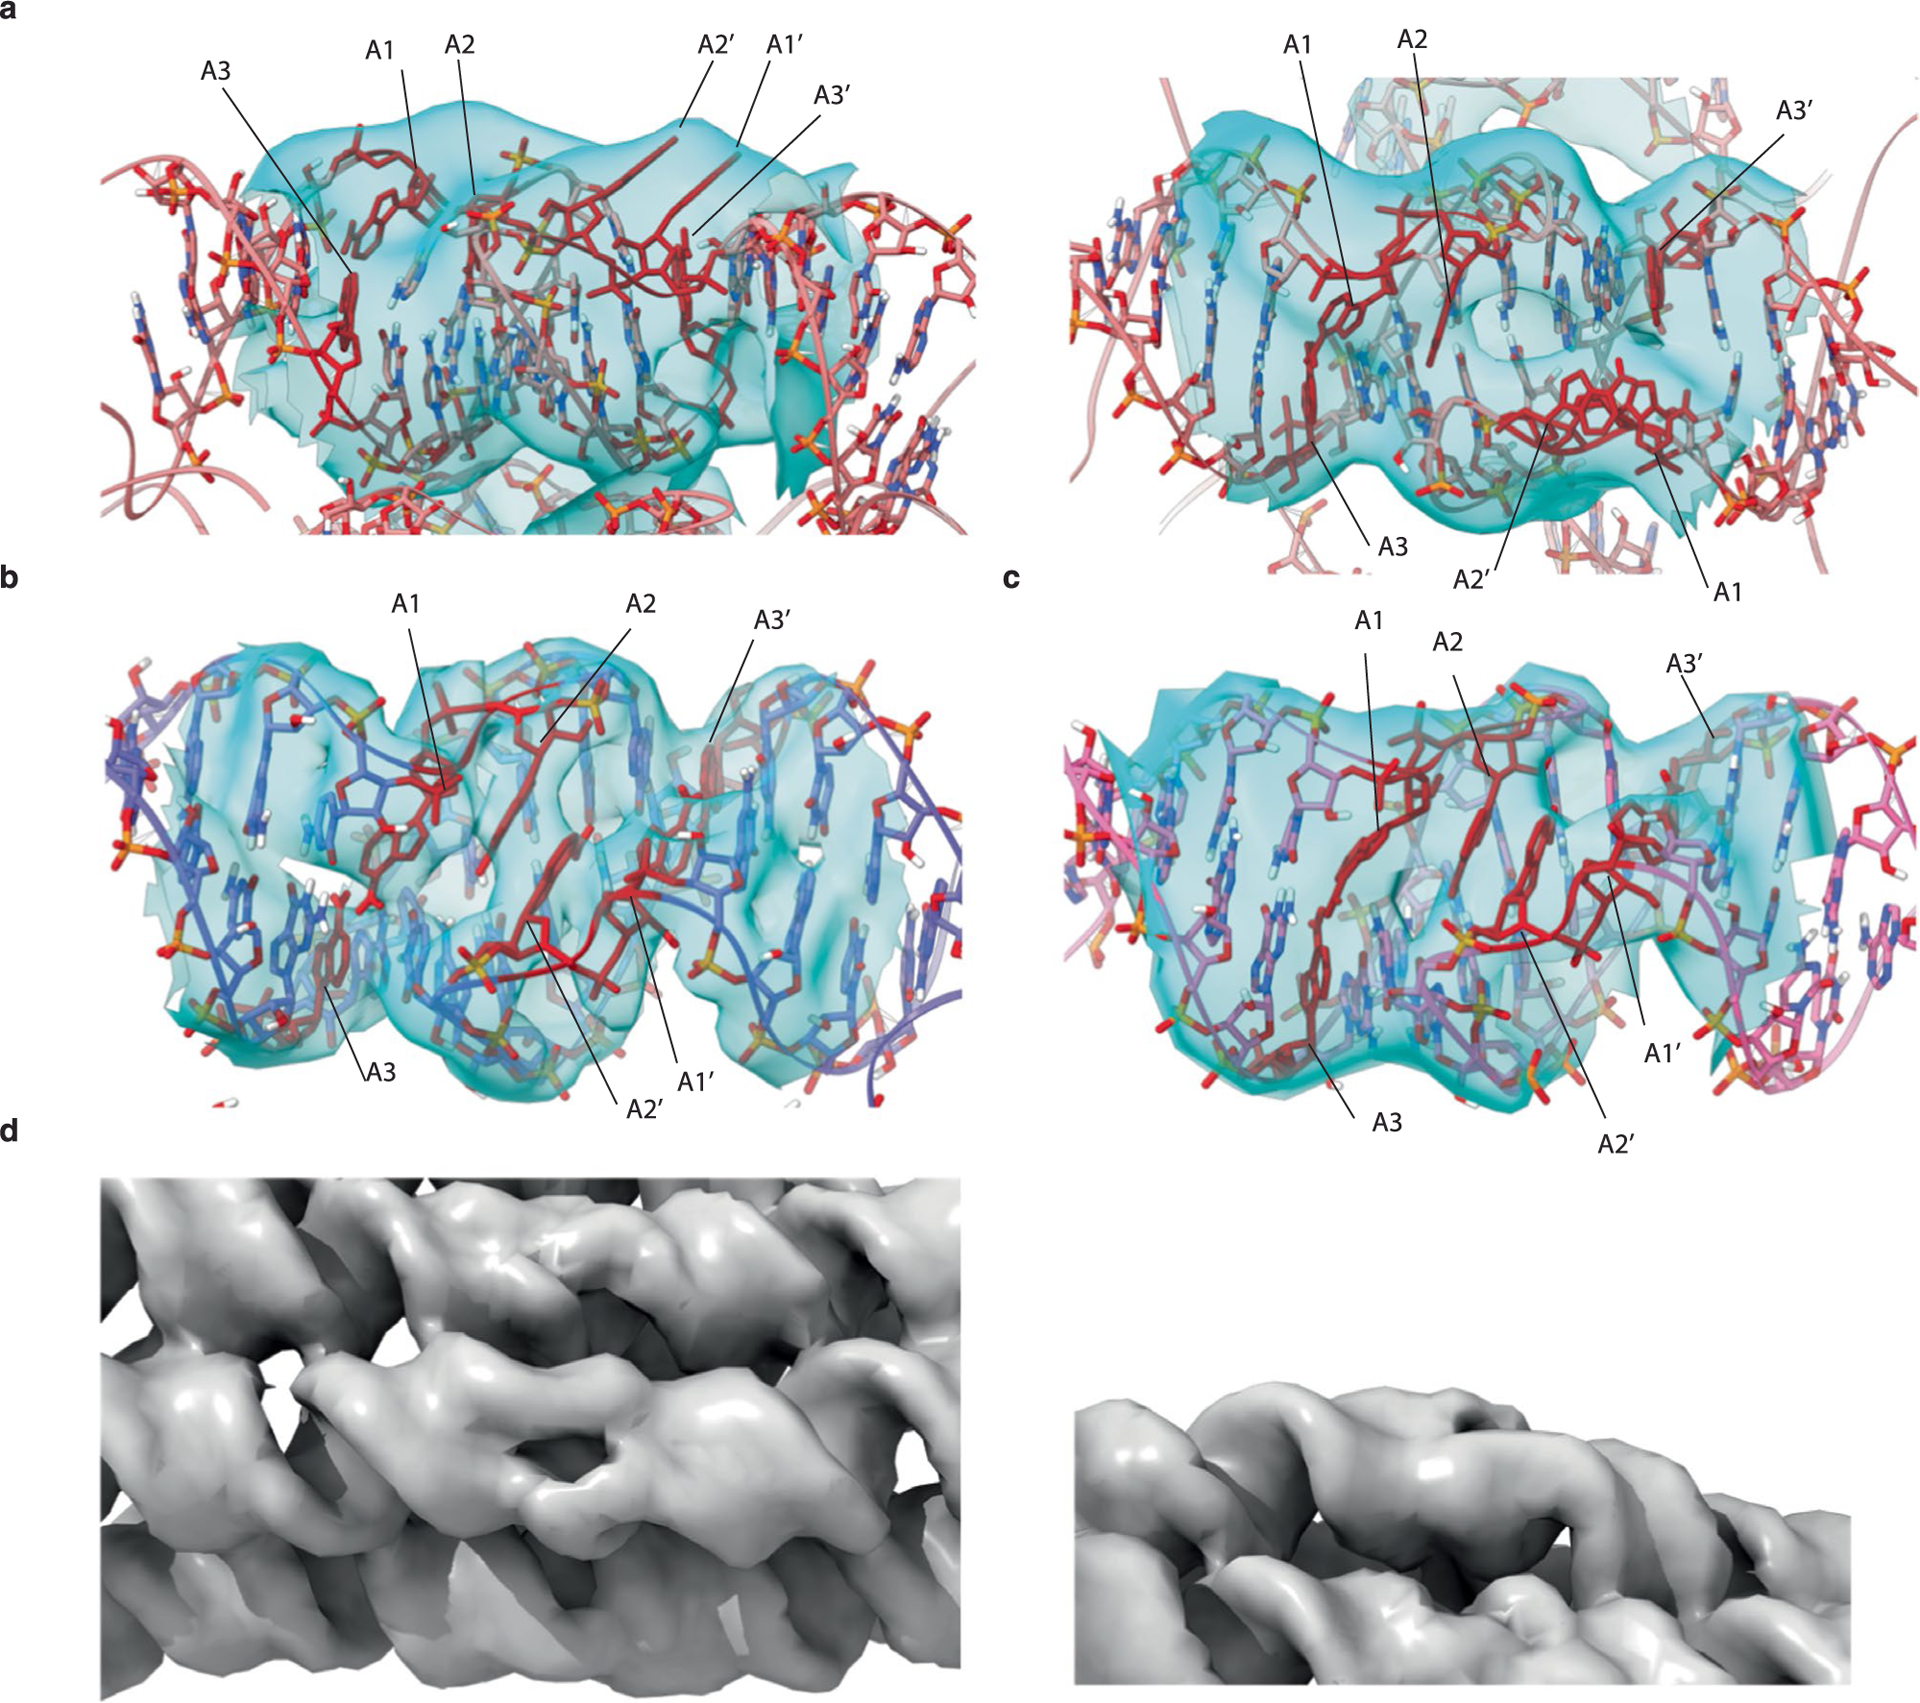
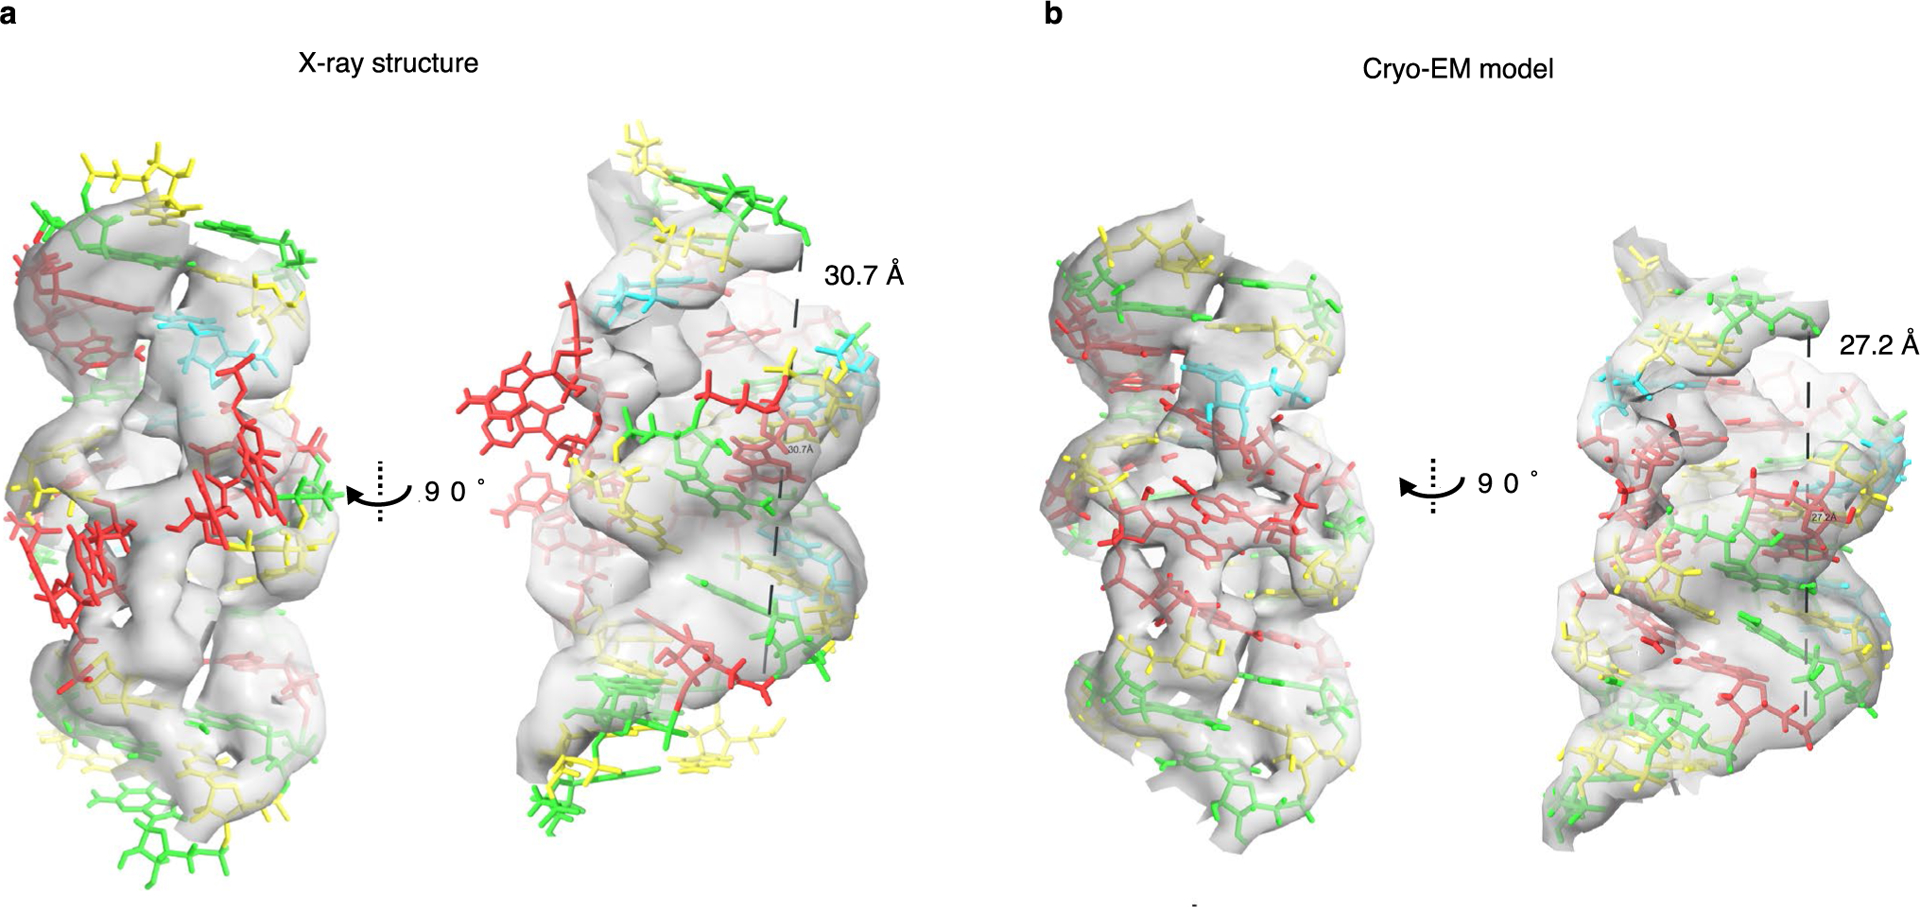
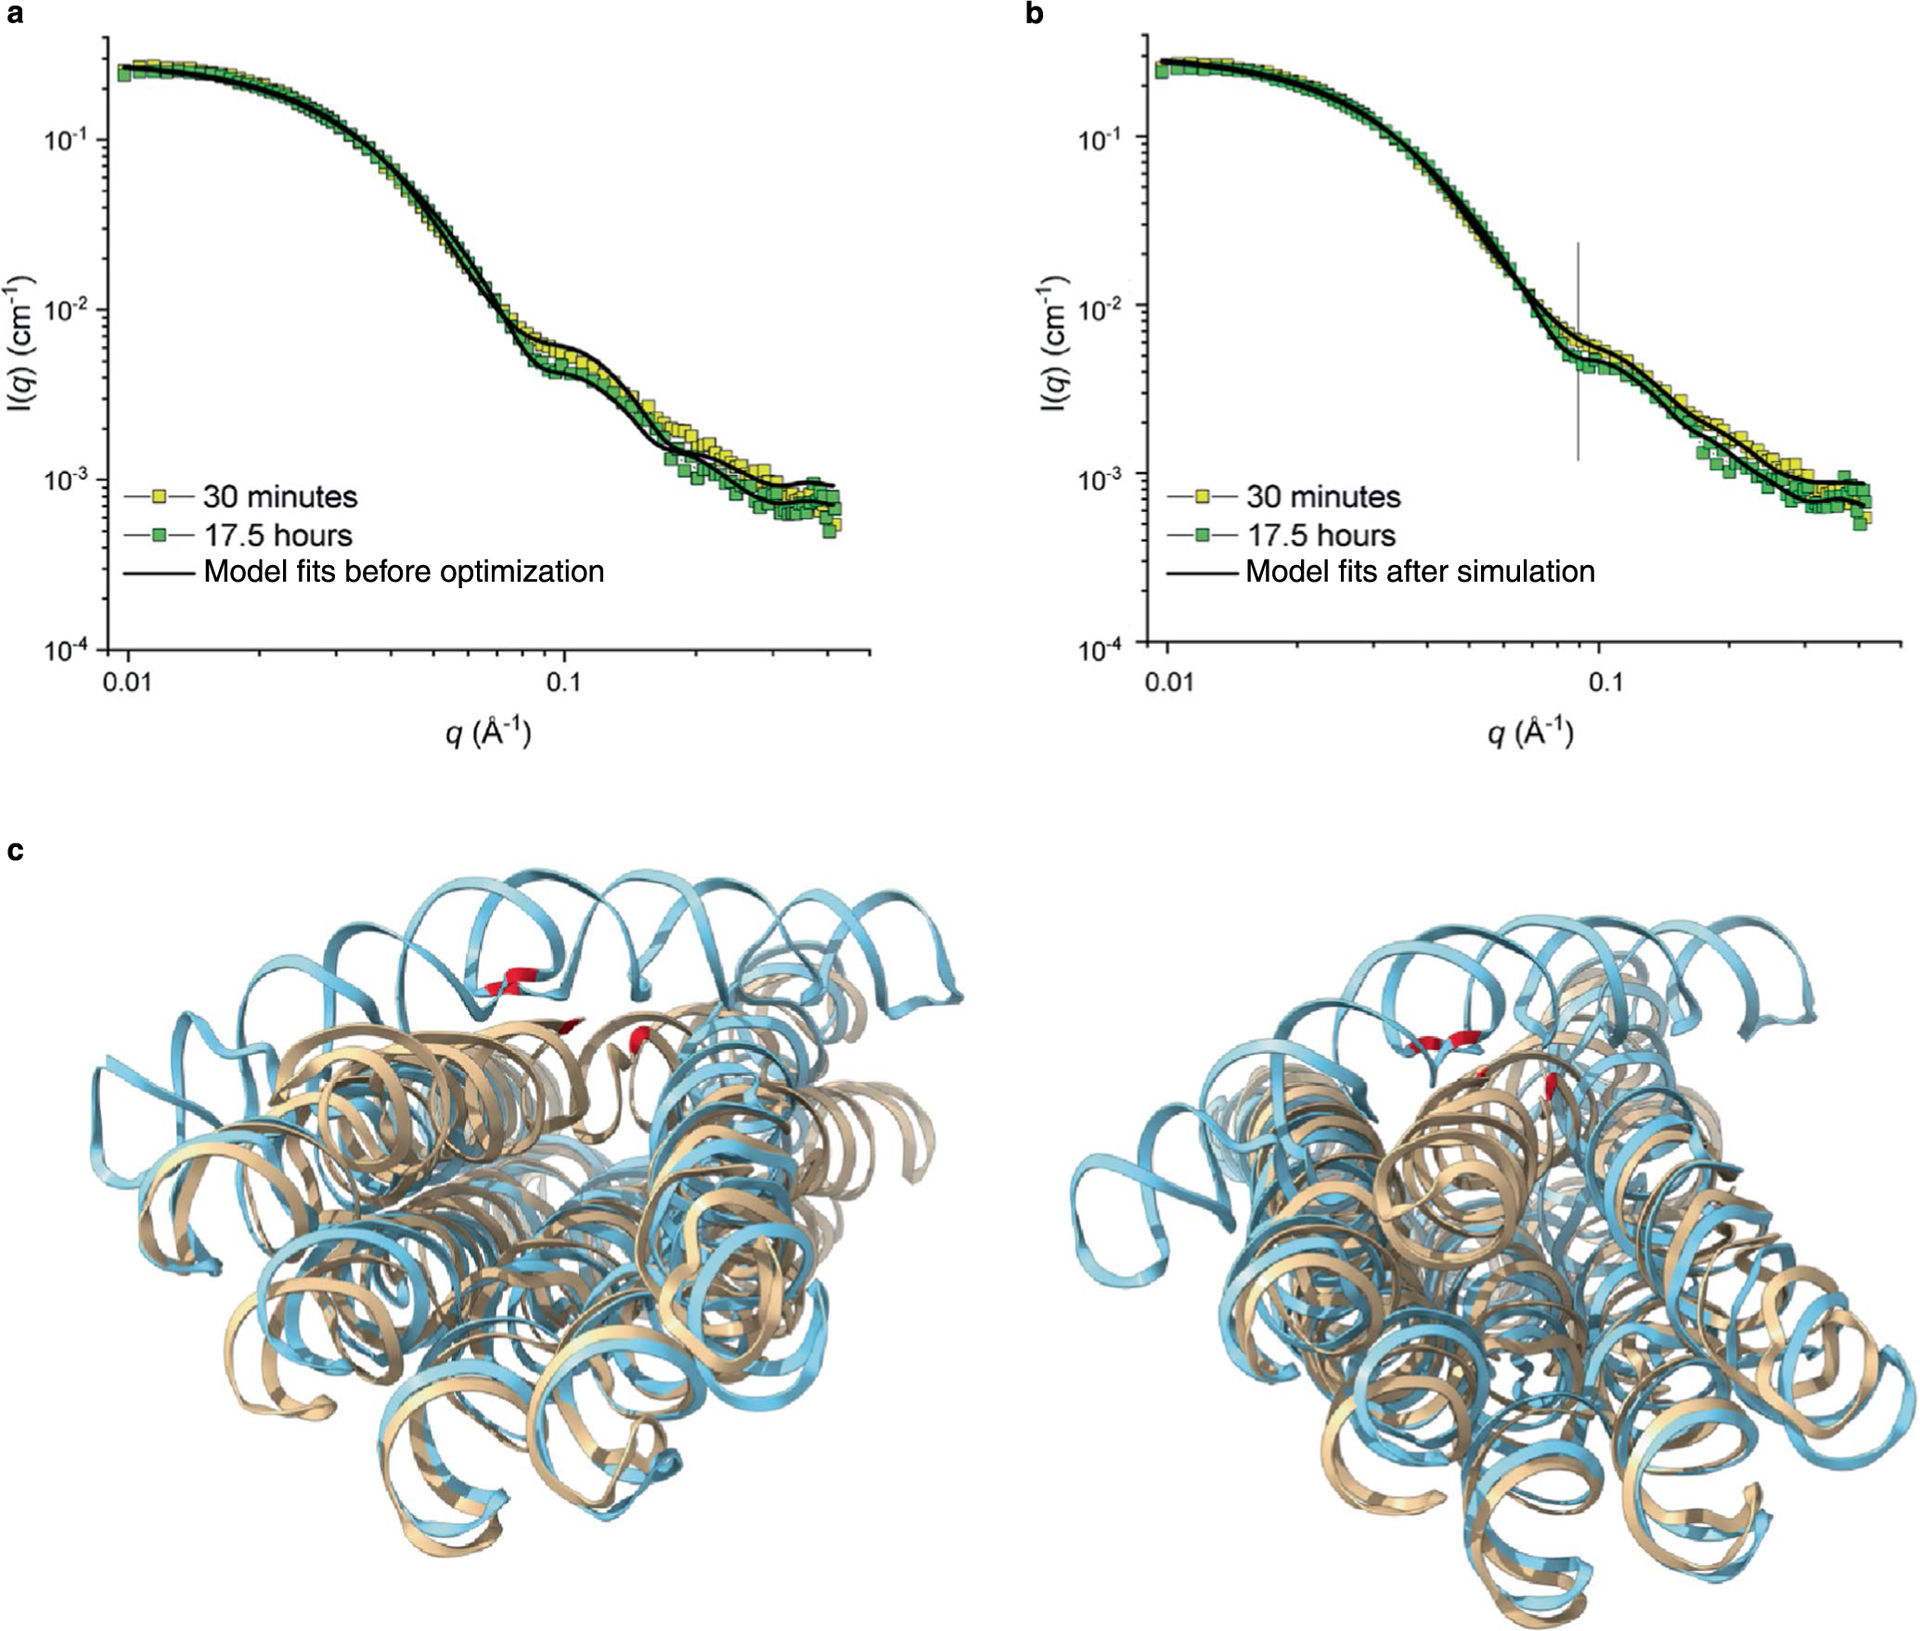
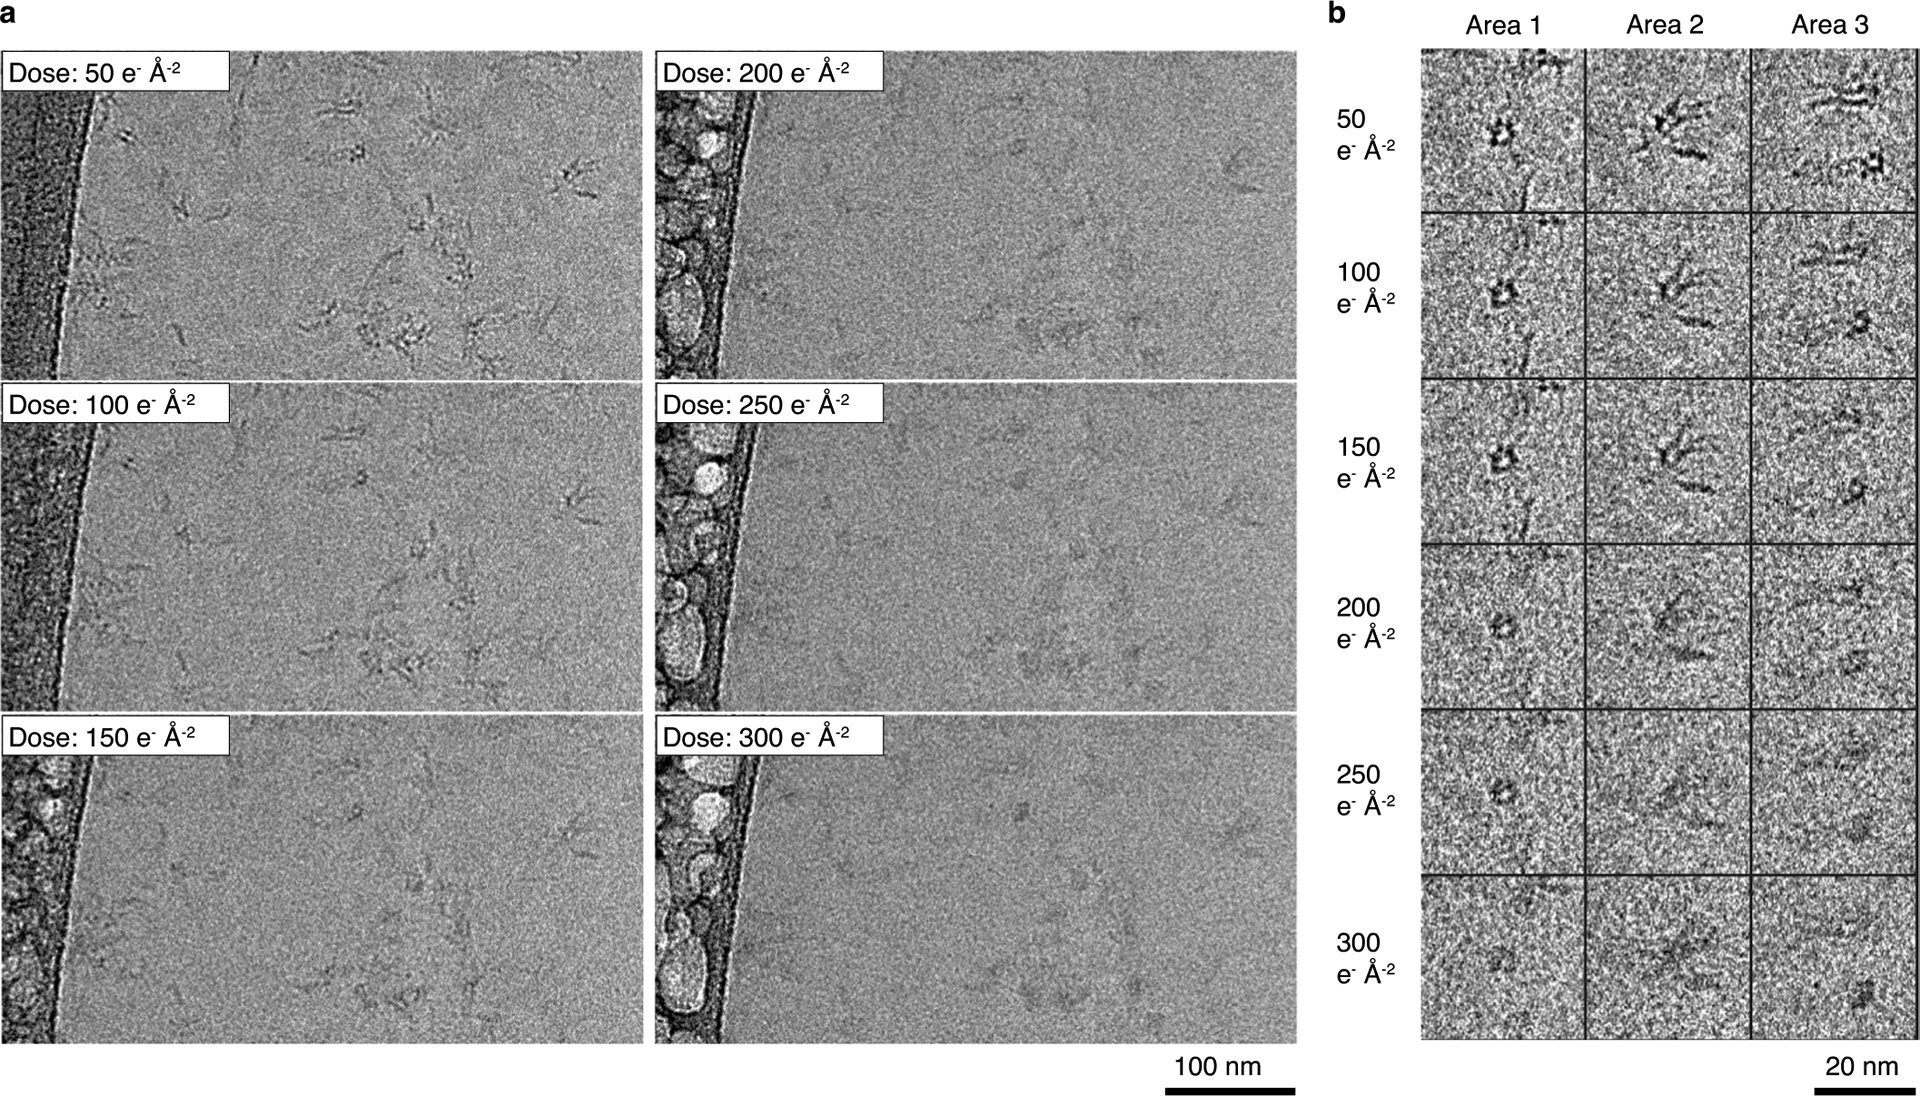
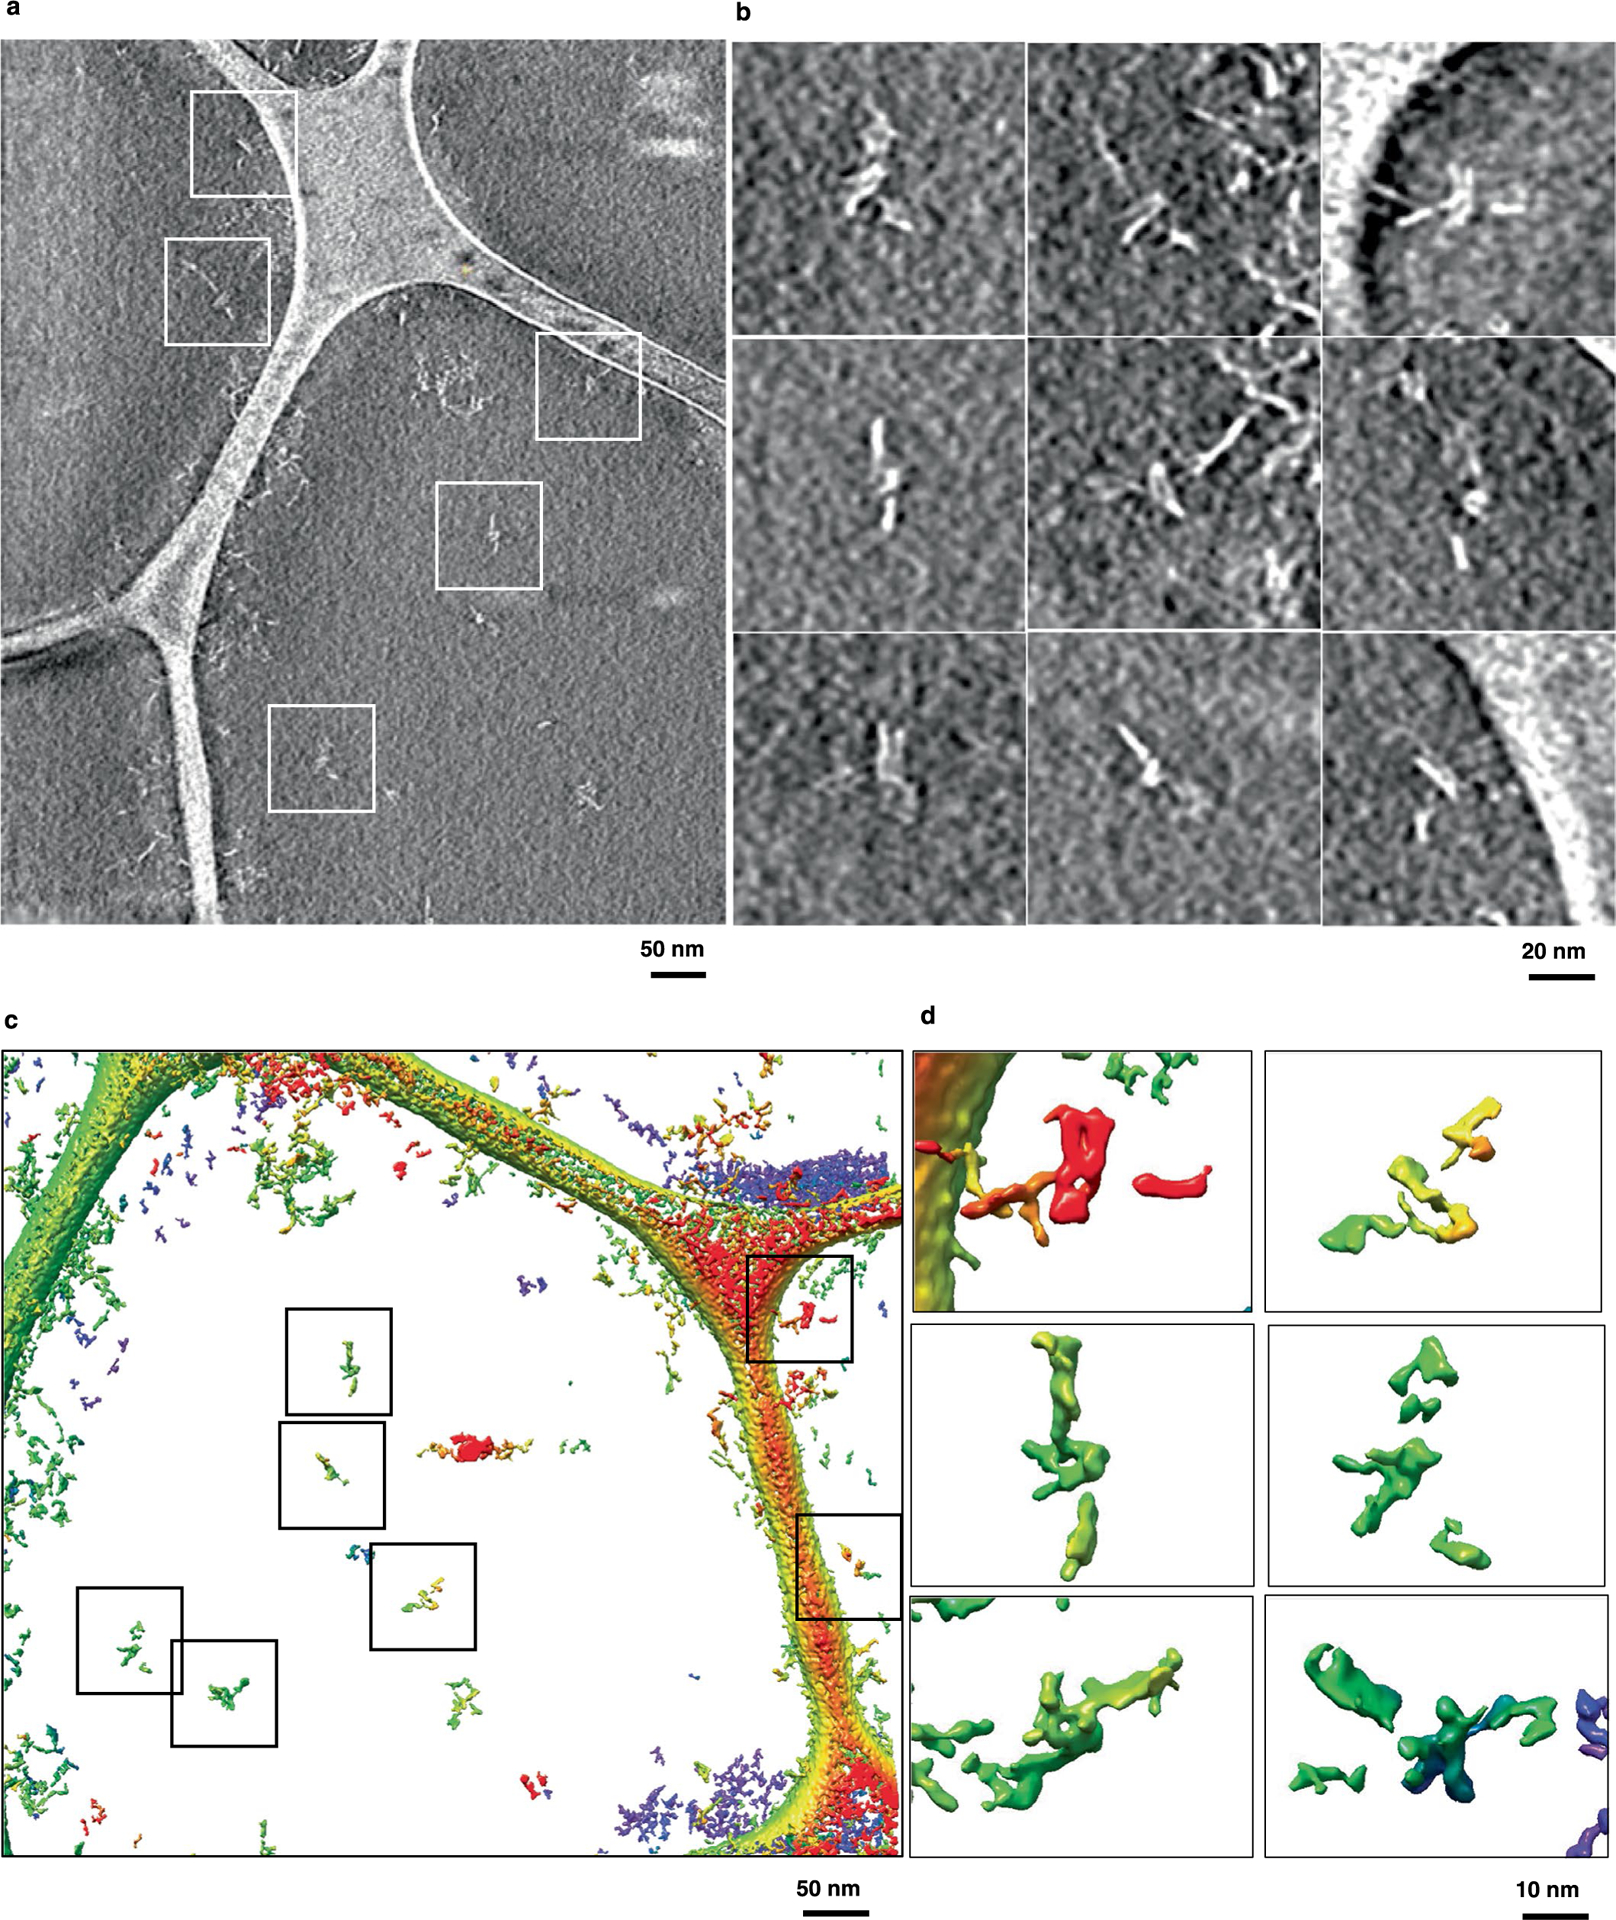
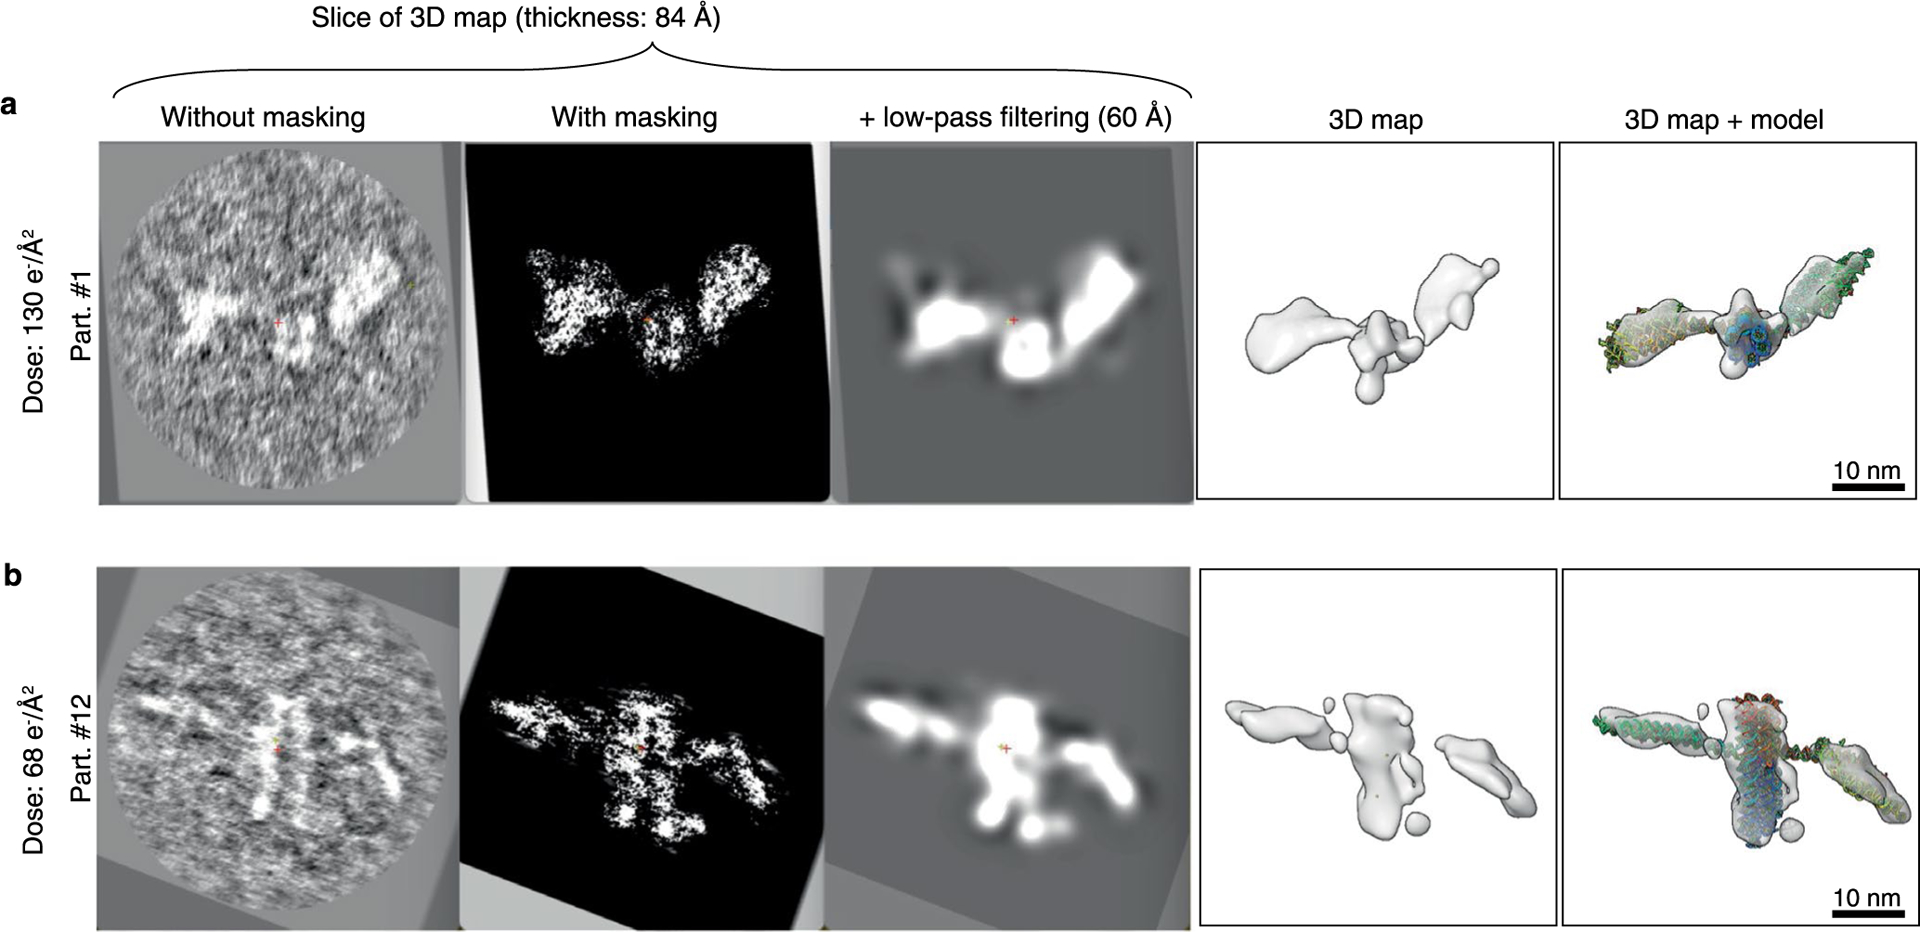
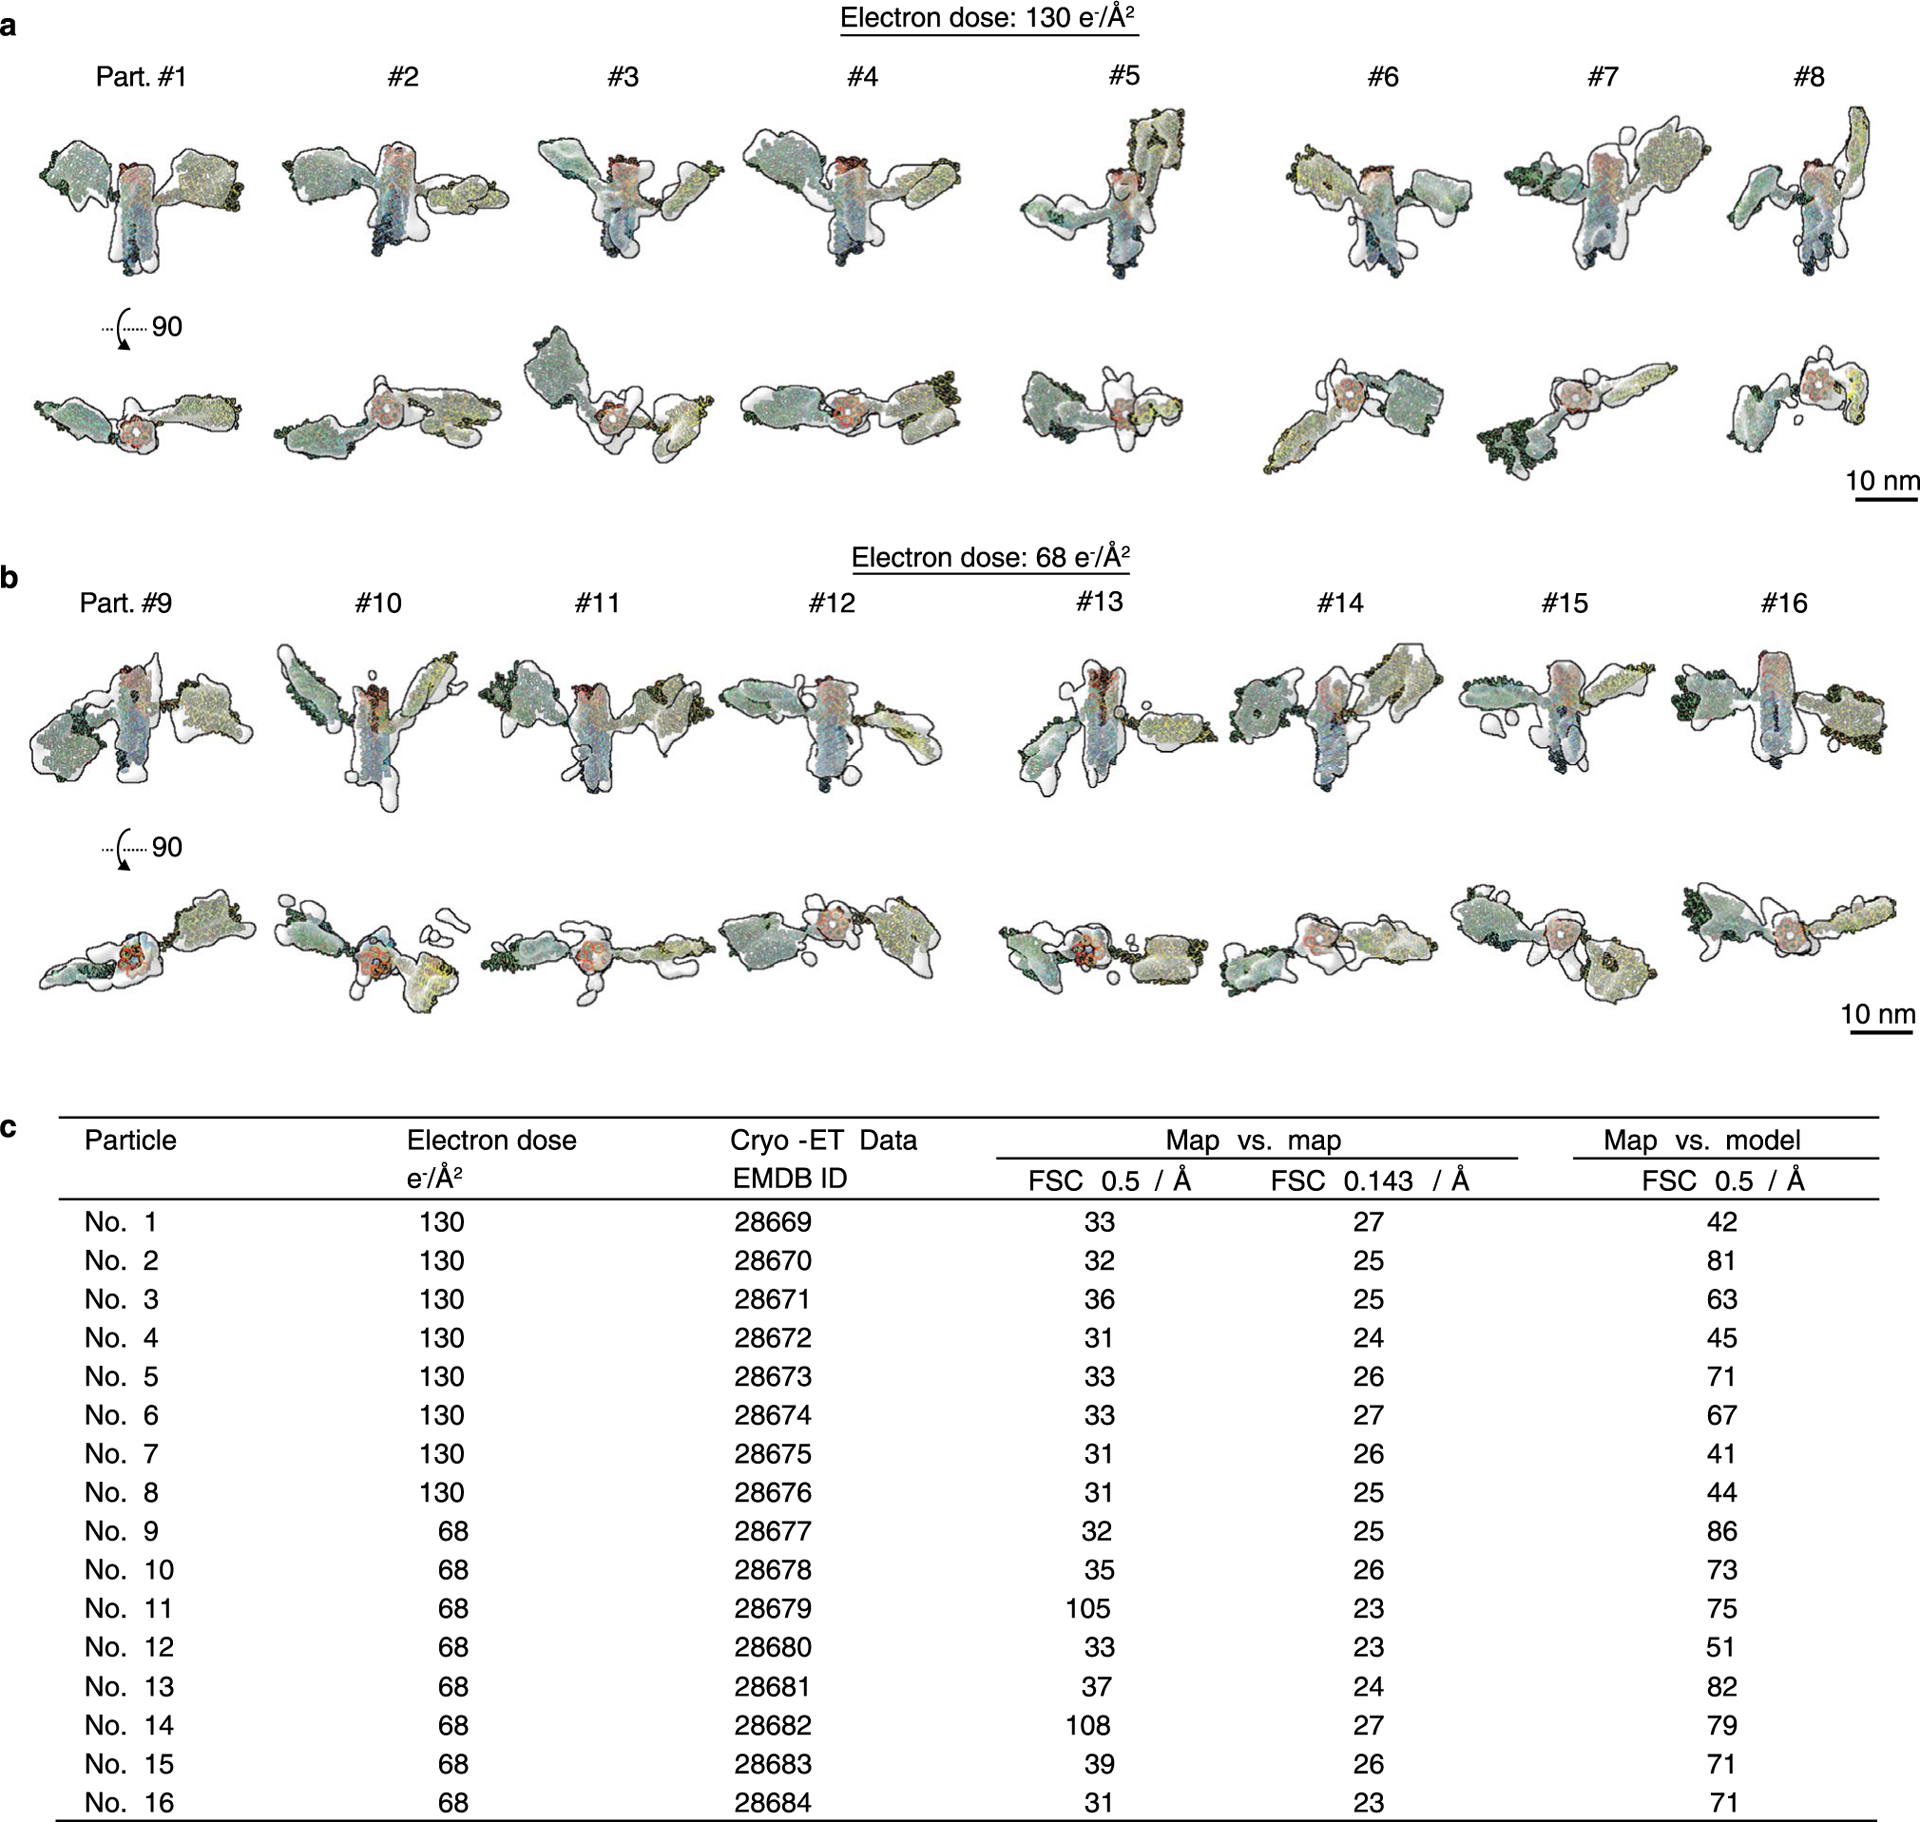
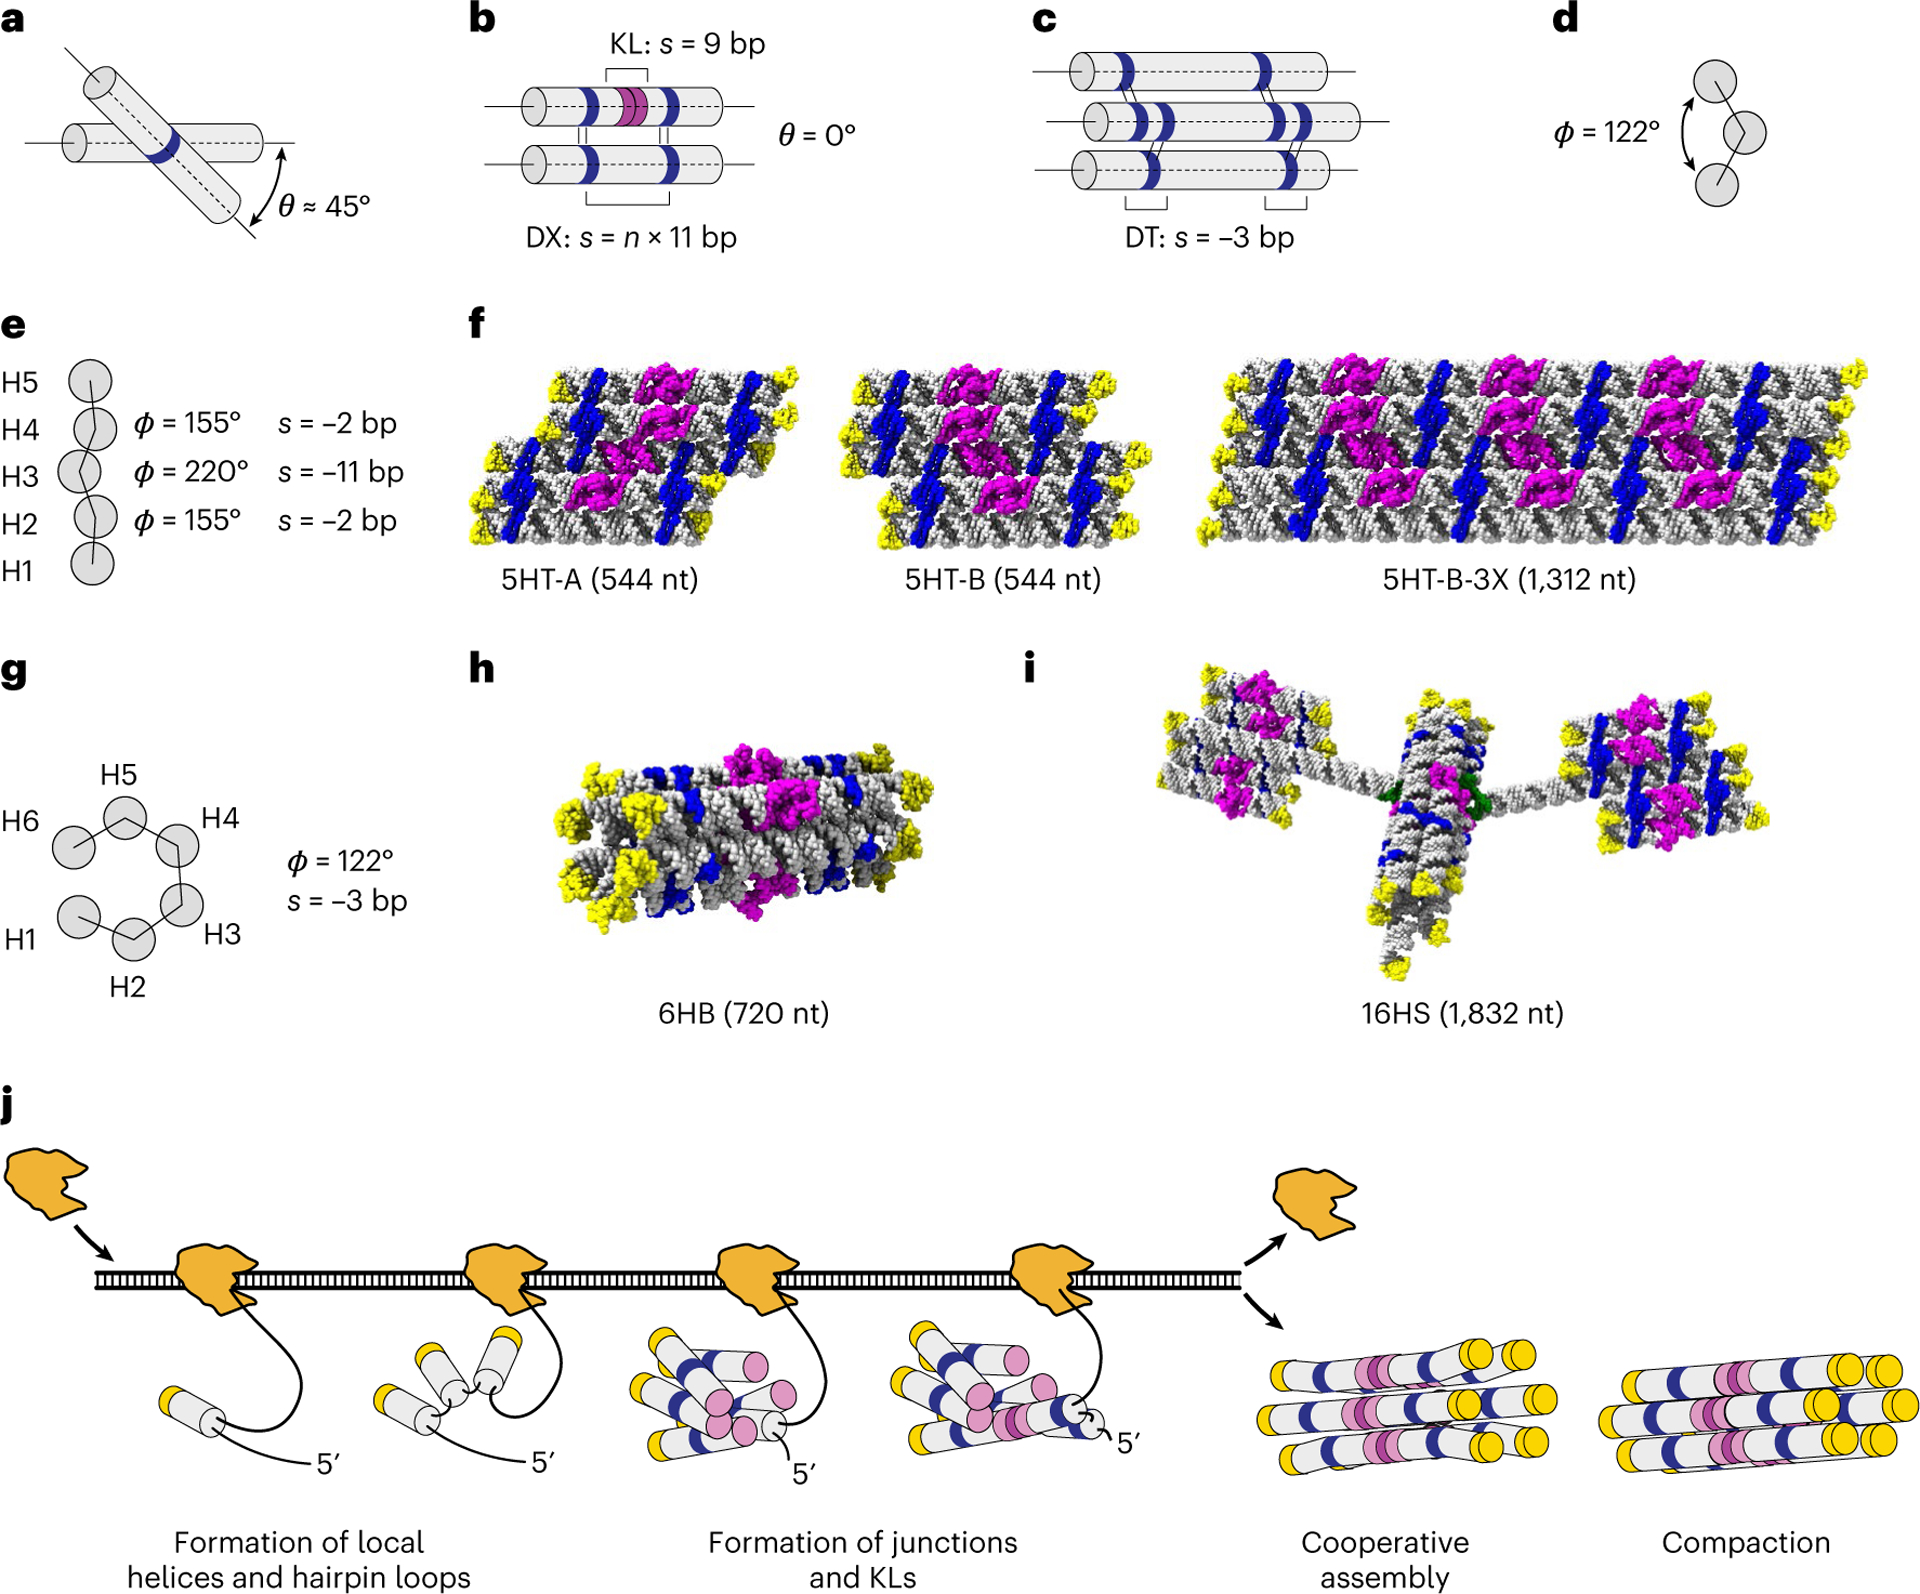
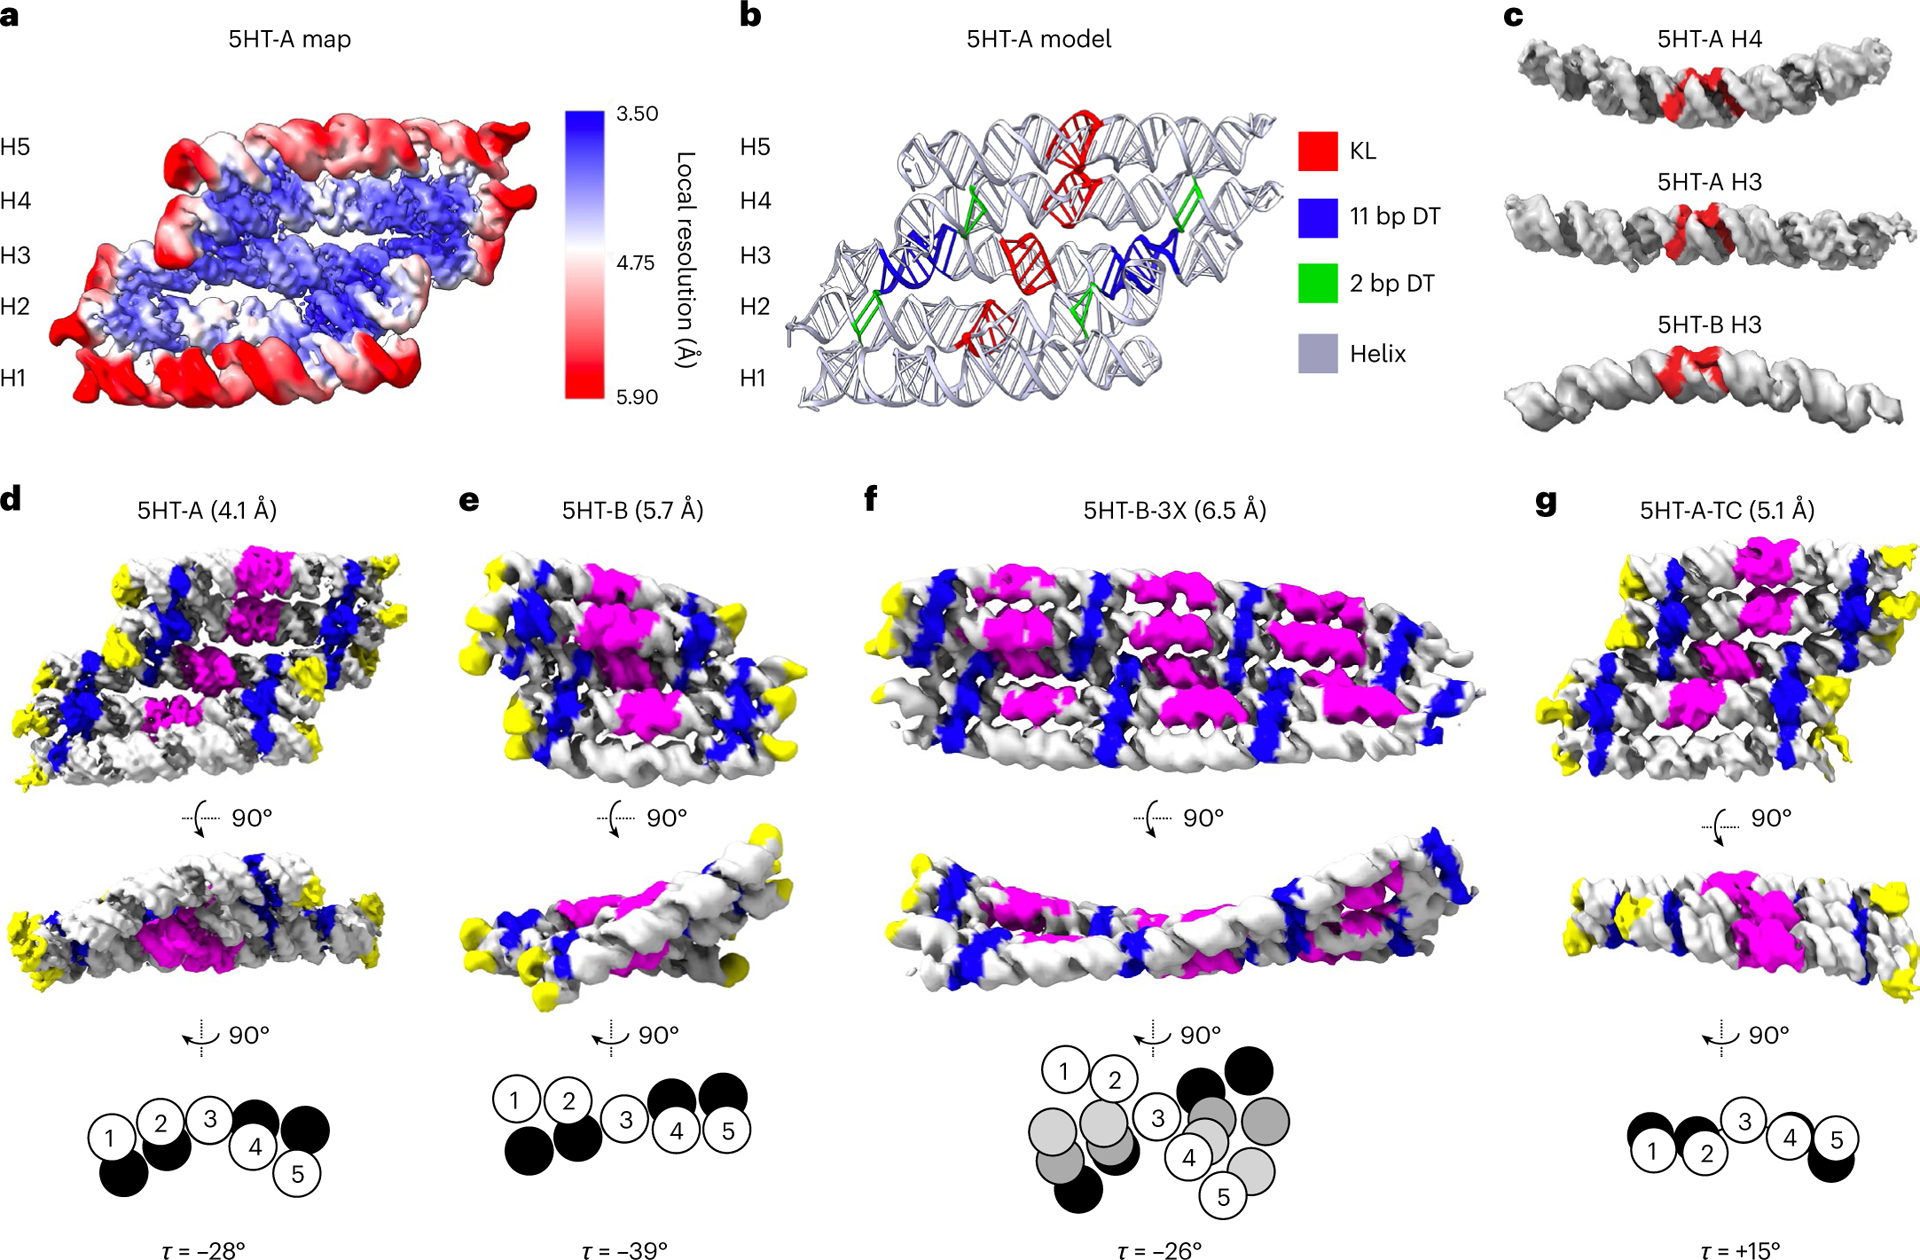
RNA origami is a method for designing RNA nanostructures that can self-assemble through co-transcriptional folding with applications in nanomedicine and synthetic biology. However, to advance the method further, an improved understanding of RNA structural properties and folding principles is required. Here we use cryogenic electron microscopy to study RNA origami sheets and bundles at sub-nanometre resolution revealing structural parameters of kissing-loop and crossover motifs, which are used to improve designs. In RNA bundle designs, we discover a kinetic folding trap that forms during folding and is only released after 10 h. Exploration of the conformational landscape of several RNA designs reveal the flexibility of helices and structural motifs. Finally, sheets and bundles are combined to construct a multidomain satellite shape, which is characterized by individual-particle cryo-electron tomography to reveal the domain flexibility. Together, the study provides a structural basis for future improvements to the design cycle of genetically encoded RNA nanodevices.


Conflict of interest statement

Competing interests

The authors declare no competing interests.

Figures

Extended Data Fig. 1 |
Extended Data Fig. 1 |. Overview of RNA origami designs, cryo-EM reconstructions and atomic models used in the study.
a, Example cryo-EM reconstructions for sheets (top row) and bundles (bottom row). b, Table listing RNA origami designs by name, blueprint, number of nucleotides, EMD ID, Gold-Standard Fourier Shell Correlation (GSFSC) for the reconstructions, PDB ID and model resolution (see Supplementary Table 10 for further details).
Extended Data Fig. 2 |
Extended Data Fig. 2 |. Reconstruction and model measurements of 5HT.
a, 5HT-A reconstruction based on local refinement of the 3 central helices shown at contour levels 0.344, 0.267 and 0.136 from left to right and colour coded by local resolution. b, Curves+ analysis of the 5HT-A model with helical axis shown as black lines. c, Curves+ analysis with backbone shown as red lines with major and minor groove measurements shown as grey lines. d, Tabulated data from Curves+ analysis of the helical components from the 5HT-A model. *All helical regions exclude KLs. **Crossover values are only based on the three central helices. e, Structural comparison of 5HT-B and 5HT-B-V2. Overlay of 5HT-B reconstructions with different kissing-loop sequences (blue is 5HT-B and red is 5HT-B-V2).
Extended Data Fig. 3 |
Extended Data Fig. 3 |. Definition and measurements of angles θ, φ and τ.
a, Schematics showing the definition of crossover angle θ, curvature angle φ and twist angle τ. Diagrams use arrows for 3′ and dots for 5′ when seen from side and circle with a dot for 3′ and circle with a cross for 5′ when seen from end. Direction of angles shown with arrow. Red lines indicate seam base pairs. The seams (S) and helices (H) are numbered from 5′ to 3′. b,c,d, Measurements of θ, φ and τ angles for different RNA origami designs, where angles are identified by seams and helices involved.
Extended Data Fig. 4 |
Extended Data Fig. 4 |. Comparison of KL regions and position of adenines.
a, Two views of the instance of bulged-out adenines from our 6HBC-mature dataset. A notable protrusion is present where the adenines are modelled, and a clear lack of density is in the spot where density from base stacking adenines is observed in our highest resolution 5HT-A dataset b, and our lower resolution 5HT-B dataset, c. Adenines shown in red against coulomb potential map shown in cyan. d, A similar gap in density was observed in helix 3 of the 6HB no clasp reconstruction. Left image shows top view. Right image shows side view.
Extended Data Fig. 5 |
Extended Data Fig. 5 |. KL motif from X-ray crystallography and cryo-EM.
a, X-ray structure used for modelling RNA origami in silico and b, the model from our cryo-EM data. A line drawn between the phosphate of the first A in the KL motif and 3 nucleotides after the motif is parallel to the helical axis in the EM model, but tilted in the X-ray model. This, along with the P-P distance shows that the KL is compacted and underwound in the cryo-EM structure and can be approximated as 8 bp of A-form helix.
Extended Data Fig. 6 |
Extended Data Fig. 6 |. SAXS data and model fitting.
a, SAXS data showing observed scattering pre and post structural transformation of the 6HBC and the predicted scattering from the models prior to rigid-body minimization. b, Fit of the predicted scattering from rigid-body optimized 6HBC-Young and 6HBC-Mature models to the experimental scattering from early and late time points. Black line denotes q = 0.09 Å−1. c, Two views of an overlay of the two conformations (young and mature are turquoise and beige, respectively) of the 6HBC with the cross-strand adenine base stack shown in red.
Extended Data Fig. 7 |
Extended Data Fig. 7 |. Cryo-EM images of 16H-Satellite RNA and effect of electron dosage.
a, On a same area of the satellite sample, a series of un-tilted cryo-EM images were acquired under a same illumination condition, for example the electron dose of 50 eÅ−2 for each of six images. Thus, the images are corresponding to radiation damage after 50 eÅ−2, 100 eÅ−2, 150 eÅ−2, 200 eÅ−2, 250 eÅ−2 and 300 eÅ−2, respectively. After a dose above 100 eÅ−2, the radiation damage caused ‘bubbling’ phenomena on the supporting carbon area (left edge). However, the RNA particles in vitrious ice are not showing bubbling even at the dose of 300 eÅ−2. b, Zoomed-in images of three representative areas with particles. The radiation damage blurred the detailed structural features, but the low resolution shape of the particles remains.
Extended Data Fig. 8 |
Extended Data Fig. 8 |. IMOD 3D reconstruction from cryo-ET of 16H-satellite.
a, Central slice of the IMOD 3D reconstruction and b, zoomed-in areas that contains 16HS particles. c, The IMOD 3D reconstruction of a selected area shown in the Chimera software and colored based on the height along the normal direction to the plane, where particles are indicated by boxes and d, shows zoomed-in images of selected particles.
Extended Data Fig. 9 |
Extended Data Fig. 9 |. IPET 3D reconstruction and effects of masking and low-pass filtering.
IPET cryo-EM 3D reconstruction of two different particles imaged under the dose of 130 eÅ−2 (a) and dose of 68 eÅ−2 (b). Left panels show the central slice of the IPET cryo-EM 3D reconstruction of an individual particle without using the particle-shaped mask. Second left panel shows the central slice using the automatically generated particle-shaped soft mask. Middle panel shows the masked particle low-pass filtered to 60 Å. Second right panel show the final 3D density map. Right panel shows the final 3D density map superimposed with fitted model.
Extended Data Fig. 10 |
Extended Data Fig. 10 |. Cryo-ET 3D reconstruction of 16 individual particles of 16H-Satellite RNA.
a, Perpendicular views of the cryo-ET 3D reconstructions with the corresponding fitted models of 8 representative particles. The tilt series was imaged under the total electron dose of 130 eÅ−2. b, Another 8 cryo-ET reconstructions of individual particles that were imaged under the electron dose of 68 eÅ−2. c, Table listing FSC analyses of the final map resolution. Two resolutions were measured for ‘map vs. map’ analysis at FSC = 0.5 and FSC = 0.143 and one resolution was measured for ‘map vs. model’ analysis at FSC = 0.5.
Fig. 1 |
Fig. 1 |. Principles for RNA origami design and folding.
a, Depiction of the relaxed angle θ observed in natural anti-parallel crossovers. b, DX with strained θ angle of 0° used in RNA origami designs, where s refers to DX spacing in base pairs and n refers to the number of turns. c,d, Depiction of a −3 bp DT seam (c) and its effect on φ (d). e,f, Predicted φ angles for a designed 5HT building block (e) and molecular models of three designs (f). gi, Predicted φ (g) for a 6HB (h) and 16HS (i) multidomain structure. In the molecular models, tetraloops are depicted in yellow; crossovers, blue; KLs, magenta; and bKLs, green. j, Hypothetical co-transcriptional folding and maturation by the compaction of a 6HB RNA origami. The A-form helix is shown as grey cylinders; tetraloops, yellow caps; junctions, blue rings; and KLs, purple circles.
Fig. 2 |
Fig. 2 |. Cryo-EM characterization of 5HT structures.
a, 5HT-A reconstruction based on the local refinement of the three central helices. The colour bar shows local resolution. b, Atomic model with colour annotation of the KL and DT helices. c, H4 from 5HT-A (top) and H3 from 5HT-B (bottom) show the most prominent bending; notably, they are bent in opposite directions with respect to the position of A1 and A2 from the KL motif, and H3 from 5HT-A (middle) is straight (A1, A2 and A3 positions are shown in red). dg, Cryo-EM reconstructions for 5HT-A (d), 5HT-B (e), 5HT-B-3X (f) and 5HT-A-TC (g) shown in two views with the resolution indicated in brackets (top). The colouring has been applied to the maps through the motifs modelled into the map. The tetraloops are depicted in yellow; crossovers, blue; and KLs, magenta. The relative scale of the reconstructions can be estimated by the thickness of a helix, which is ~2 nm. Schematic showing the cross-section of H1–H5 at seam 1 (white) and other seams (black/greyscale) aligned on H3 with the calculated seam twist angle τ (bottom).
Fig. 3 |
Fig. 3 |. Tertiary structure of KL and crossover motifs.
a, Secondary structure of the KL motif with the annotation of A1–A3. The capped red lines annotate stacking. b,c, Trans-Watson–Crick base pair of A1:A3 (b) and A1′:A3′ (c) from H3 KL are shown with the EM map as a mesh. d, A 3D model of KL3 of 5HT-A in the EM map. Nucleotides coloured by base (green, guanine; yellow, cytosine; red, adenine; blue, uracil). e, A 3D model of KL3 of 5HT-A showing the base stack of A2:A2′ across the major groove. The EM map is shown as a mesh around the displayed nucleotides. The 6 bp kissing nucleotides are ‘hidden’ to highlight the A2:A2′ base stack by displaying it as a ribbon and hiding the EM map mesh. f, Zoomed-in view of the A1:A3/A1’:A3’ base pairs and A2:A2′ base stack with the EM map shown as a mesh around the displayed nucleotides. g, Secondary structure of the crossover junction with annotation of J1–J4. Here J refers to junction nucleotides and are numbered from 5′ to 3′, and N represents any nucleotide. h, View of the crossover junctions between H1, H2 and H3 of 5HT-A shown with the EM map as a mesh. J1–J4 are highlighted in red. i, View of J1–J4 shown with the EM map as a mesh. C3′-endo nucleotides are coloured blue and C2′-endo nucleotides, red.
Fig. 4 |
Fig. 4 |. Cryo-EM and SAXS characterization of 6HB structures.
ac, Cryo-EM reconstructions of 6HB (a), 6HBC-young (b) and 6HBC-PBS-mature (c) designs with the resolution indicated in brackets. The colour code is the same as in Fig. 2d–g. In c, the tetraloops were modelled into density in place of protein-binding domains. The schematic shows the cross-sections of H1–H6 at seam 1 (white) and seam 2 (black) as well as the seam twist angle τ. d, SAXS measurements on the 6HBC structure over time, where the black arrow shows the main change at q = 0.09 Å−1. e, Average intensity of seven points around q = 0.09 Å−1 plotted as a function of time. The error bars show the standard errors from counting statistics. The red line shows a general trend. f, Linear combination analysis of the experimental data for the initial and mature state. The error bars are obtained from least-squares fitting using weights related to the standard errors on the SAXS data. g, Schematic showing the compaction and transition between young and mature conformations. The red arrows show the rotation of clasp helices.
Fig. 5 |
Fig. 5 |. NS-TEM and cryo-ET characterization of 16HS structure.
a, NS-TEM micrograph. b, Ten representative images of 16HS-shaped particles. c, Reference-free 2D class averages of particles. d, A 3D model of 16HS. e, Templated reconstruction of the satellite volume shown in perpendicular views. f, The cryo-TEM micrograph. g, Ten representative images of 6HB particles. h, Perpendicular views of three representative cryo-ET 3D reconstructions of individual particles imaged under the dose of 130 e Å–2 with the fitted model shown in rainbow colours from the 5′ to 3′ end. i, Perpendicular views of another three representative cryo-ET 3D reconstructions of individual particles imaged under the dose of 68 e Å–2 with the fitted model shown in rainbow colours from the 5′ to 3′ end. j, Superimposed 16-fitted models aligned on the basis of the central helical bundle, shown in two perpendicular views. The models are shown in rainbow colours from the 5′ to 3′ end.

References

    1. Jasinski D, Haque F, Binzel DW & Guo P Advancement of the emerging field of RNA nanotechnology. ACS Nano 11, 1142–1164 (2017). - PMC - PubMed
    1. Ohno H, Akamine S & Saito H RNA nanostructures and scaffolds for biotechnology applications. Curr. Opin. Biotechnol 58, 53–61 (2019). - PubMed
    1. Kim J & Franco E RNA nanotechnology in synthetic biology. Curr. Opin. Biotechnol 63, 135–141 (2020). - PubMed
    1. Geary C, Rothemund PW & Andersen ES A single-stranded architecture for cotranscriptional folding of RNA nanostructures. Science 345, 799–804 (2014). - PubMed
    1. Høiberg HC, Sparvath SM, Andersen VL, Kjems J & Andersen ES An RNA origami octahedron with intrinsic siRNAs for potent gene knockdown. Biotechnol. J 14, 1700634 (2018). - PubMed

Publication types