. 2023 Mar;25(3):493-507.
doi: 10.1038/s41556-023-01093-0. Epub 2023 Feb 27.

A neurodevelopmental epigenetic programme mediated by SMARCD3-DAB1-Reelin signalling is hijacked to promote medulloblastoma metastasis

Affiliations

A neurodevelopmental epigenetic programme mediated by SMARCD3-DAB1-Reelin signalling is hijacked to promote medulloblastoma metastasis

Han Zou et al. Nat Cell Biol. 2023 Mar.

Abstract

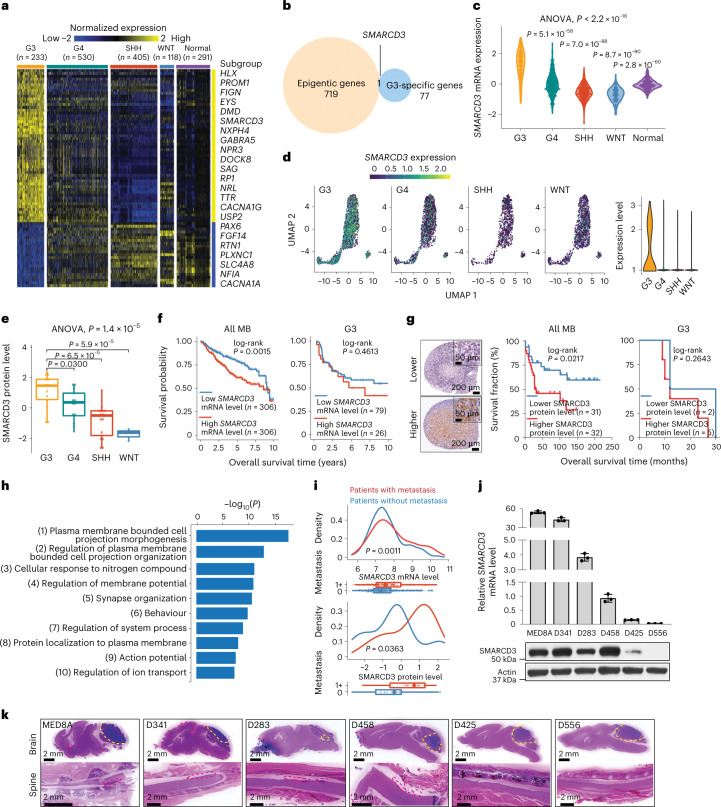
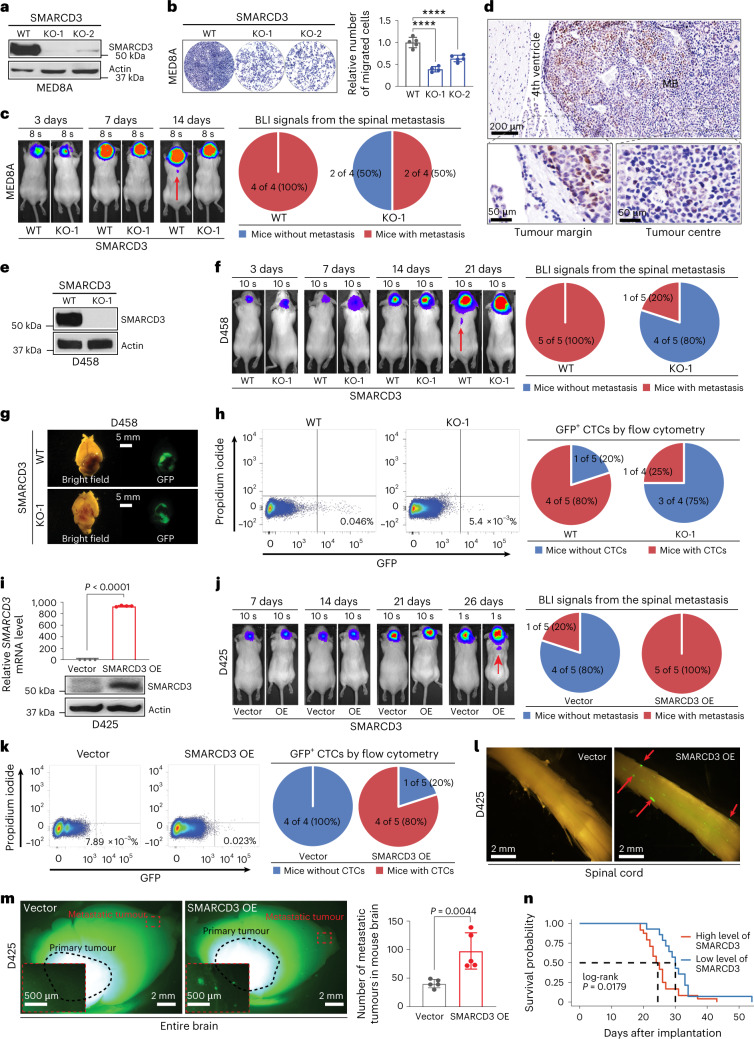
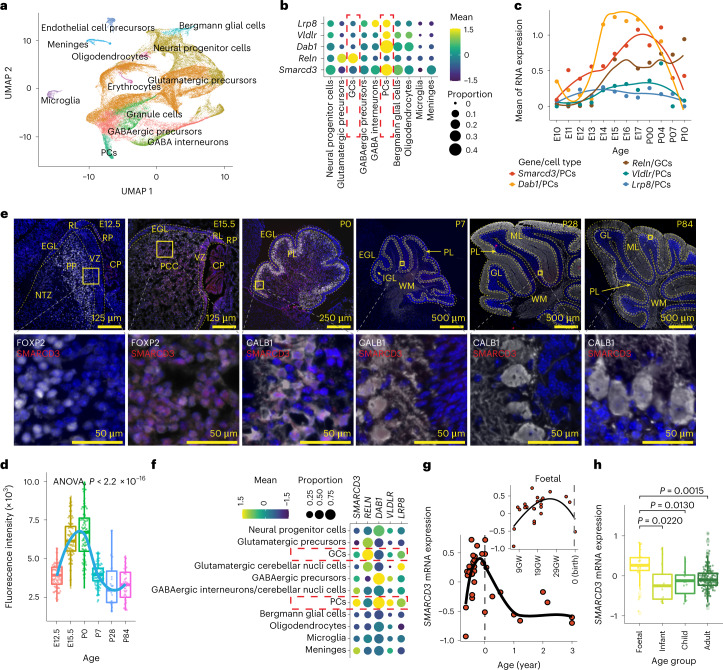
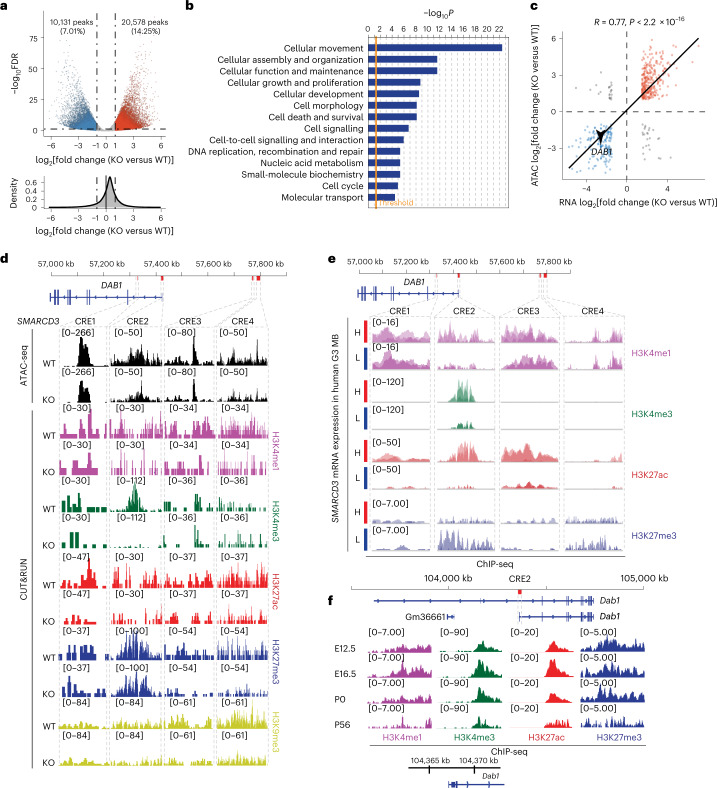
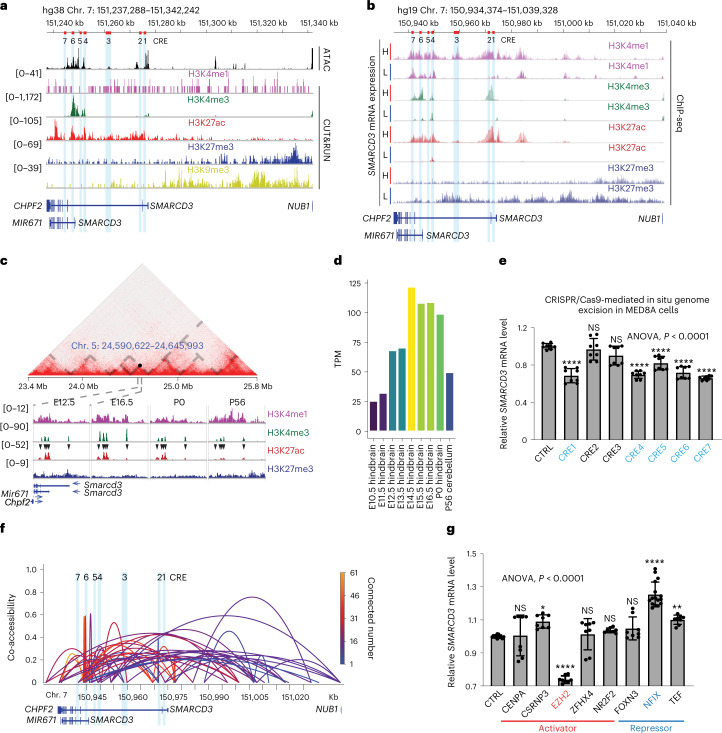
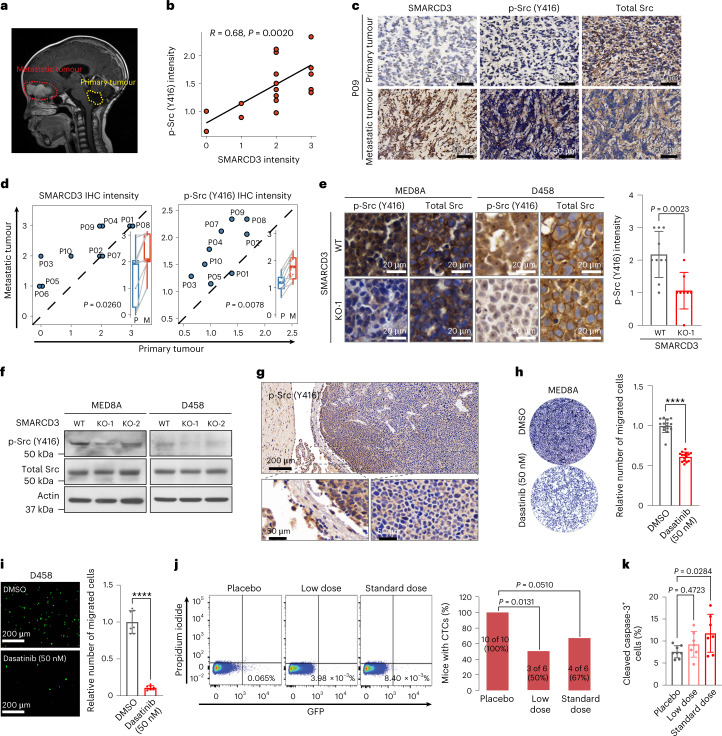
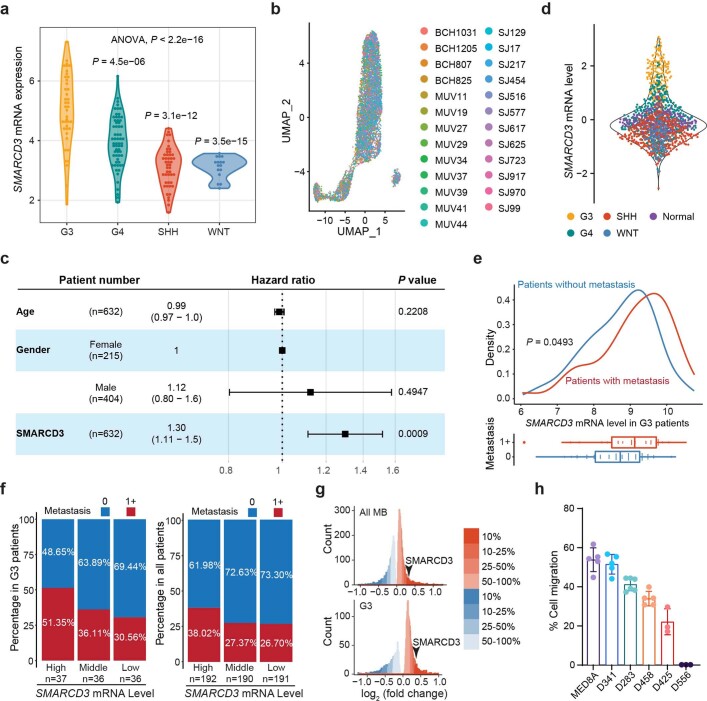
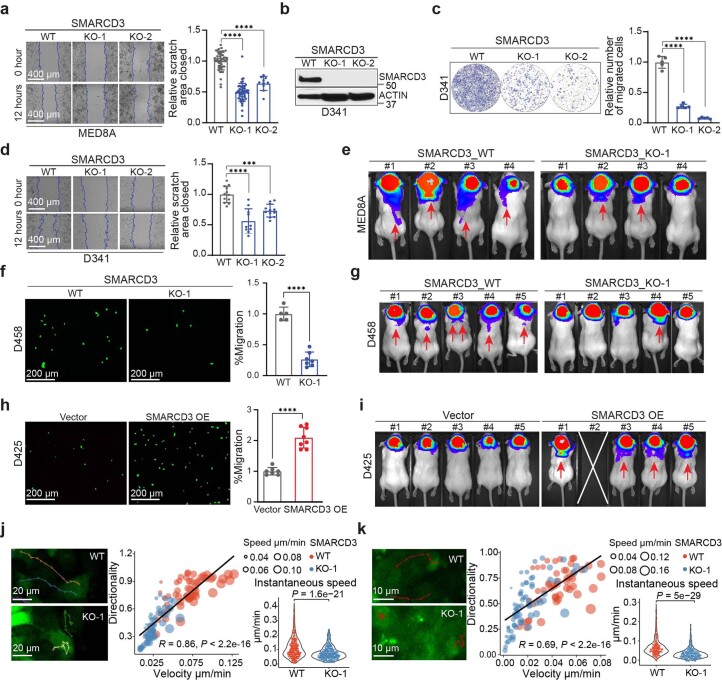
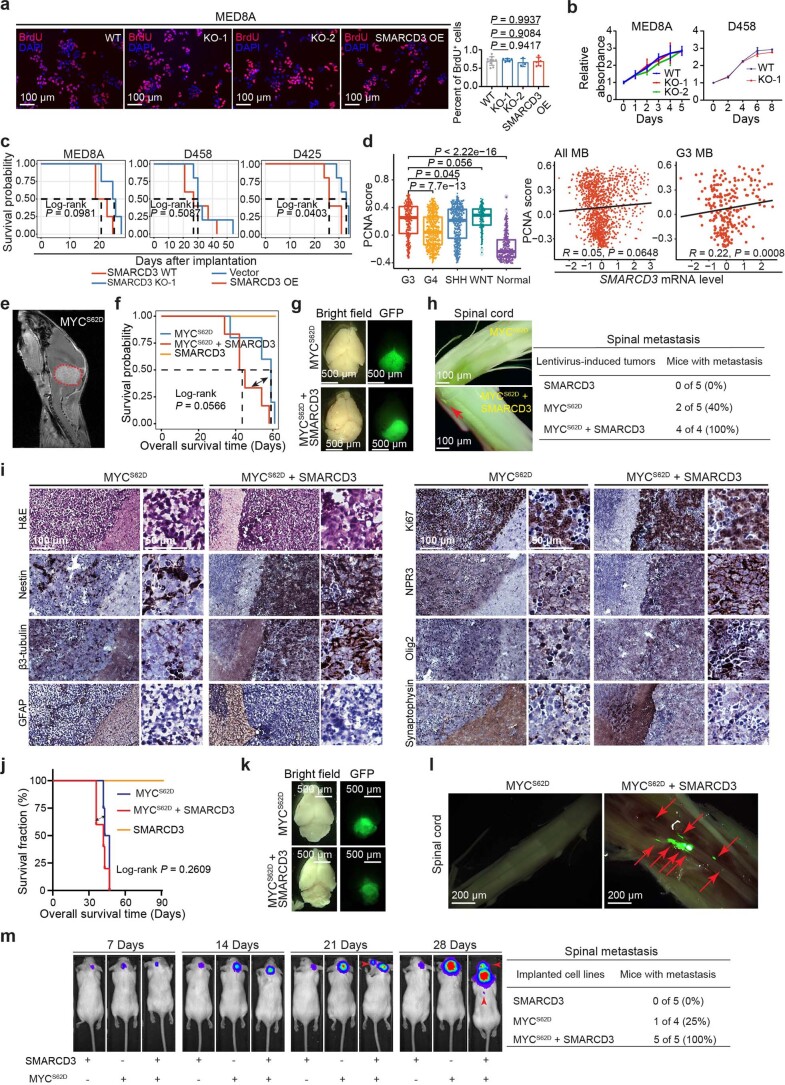
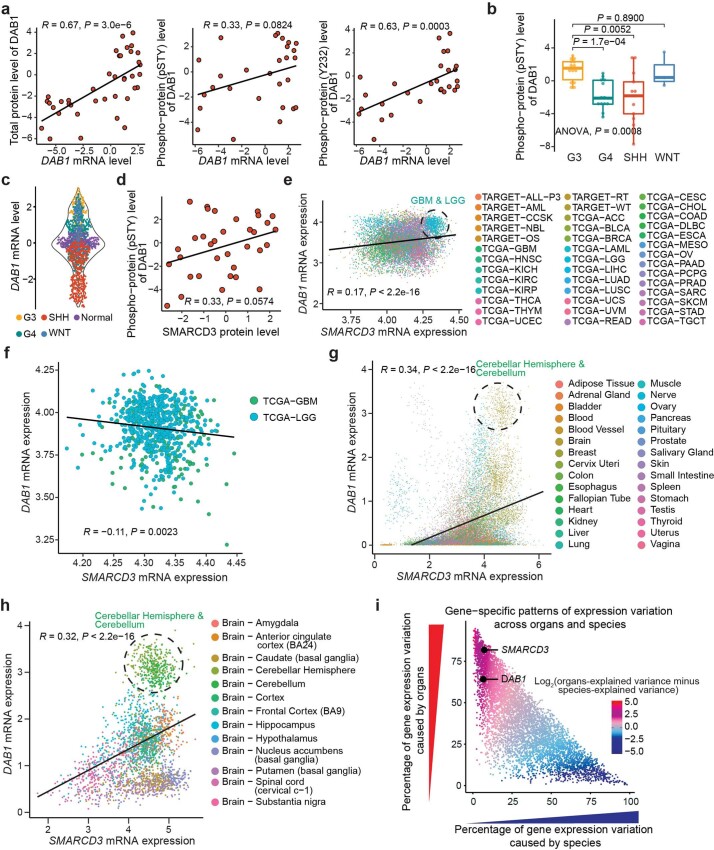
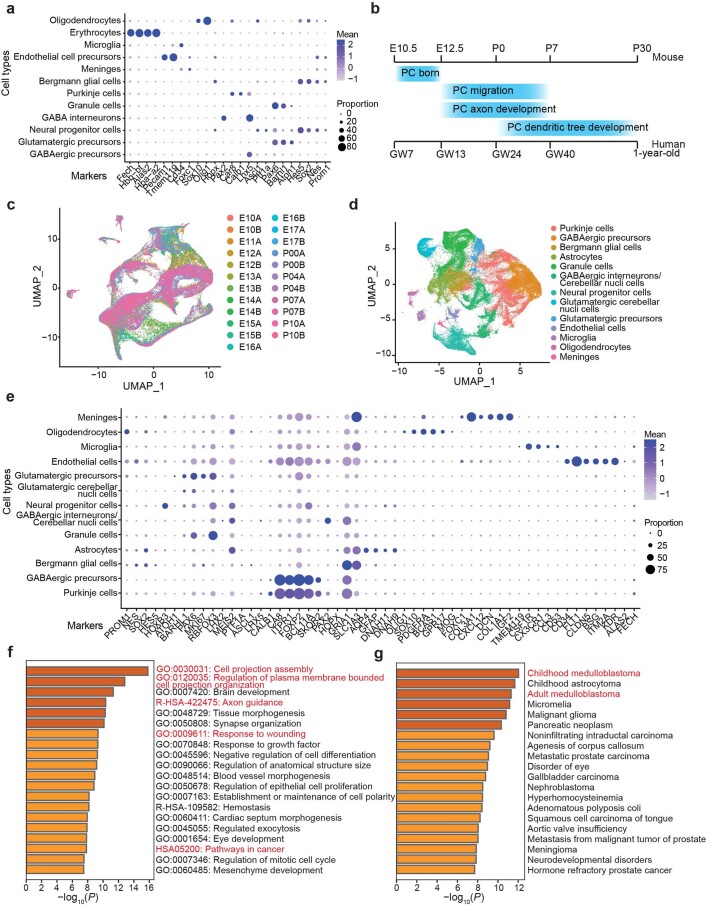
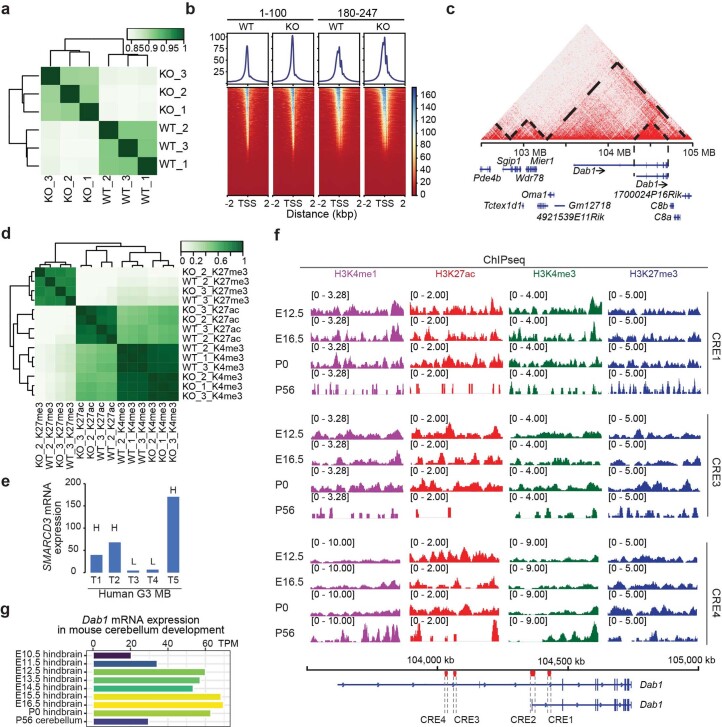
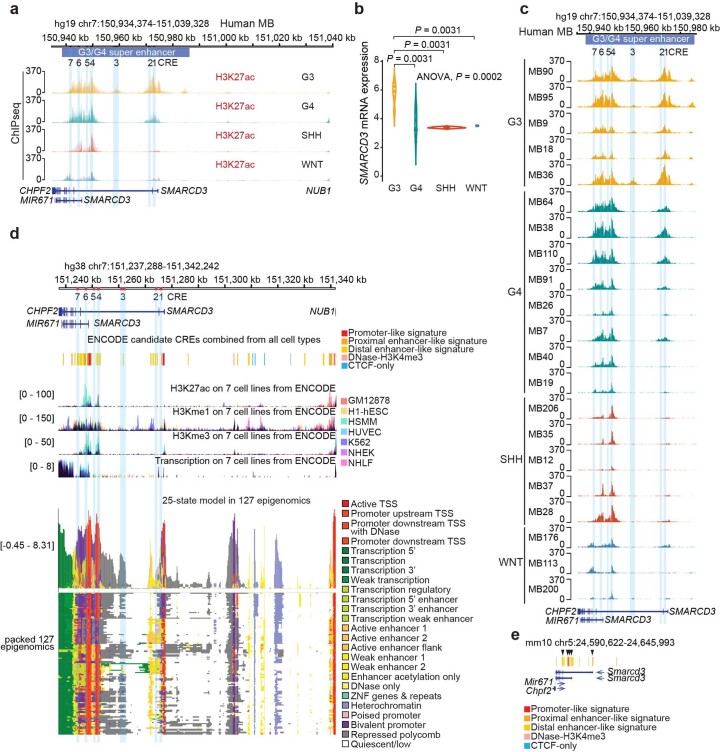
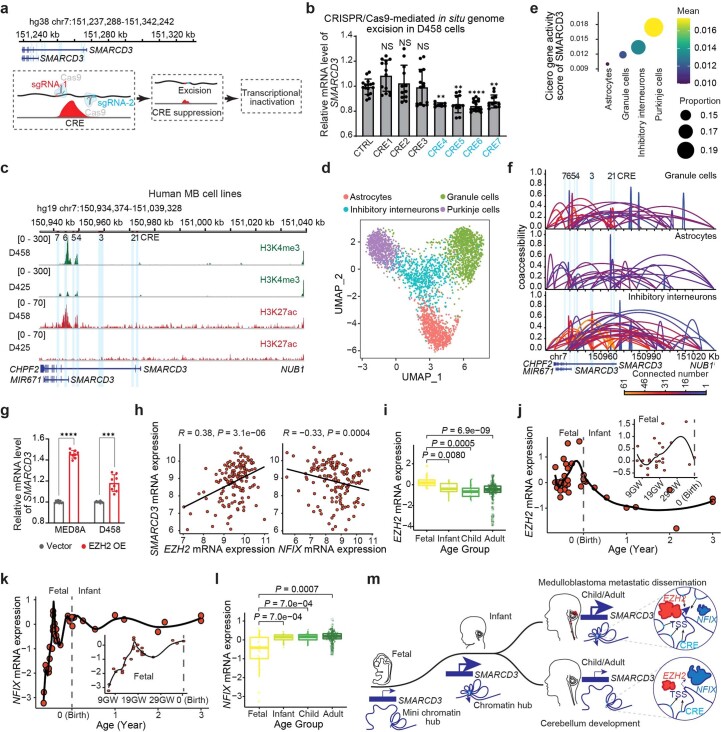
How abnormal neurodevelopment relates to the tumour aggressiveness of medulloblastoma (MB), the most common type of embryonal tumour, remains elusive. Here we uncover a neurodevelopmental epigenomic programme that is hijacked to induce MB metastatic dissemination. Unsupervised analyses of integrated publicly available datasets with our newly generated data reveal that SMARCD3 (also known as BAF60C) regulates Disabled 1 (DAB1)-mediated Reelin signalling in Purkinje cell migration and MB metastasis by orchestrating cis-regulatory elements at the DAB1 locus. We further identify that a core set of transcription factors, enhancer of zeste homologue 2 (EZH2) and nuclear factor I X (NFIX), coordinates with the cis-regulatory elements at the SMARCD3 locus to form a chromatin hub to control SMARCD3 expression in the developing cerebellum and in metastatic MB. Increased SMARCD3 expression activates Reelin-DAB1-mediated Src kinase signalling, which results in a MB response to Src inhibition. These data deepen our understanding of how neurodevelopmental programming influences disease progression and provide a potential therapeutic option for patients with MB.


Conflict of interest statement

The authors declare no competing interests.

Figures

Fig. 1
Fig. 1. High levels of SMARCD3 expression in G3 correlate with MB metastasis.
a, A heatmap of gene expression in the four MB subgroups (G3, group 4 (G4), SHH and WNT) and in unaffected (normal) tissues. Twofold change; false discovery rate (FDR) < 0.05. b, Venn diagram showing the overlapping SMARCD3 expression between G3-associated genes and epigenetic genes. c, Violin plot showing SMARCD3 mRNA expression using transcriptomics data from patients with MB. ANOVA, analysis of variance. d, Uniform manifold approximation and projection (UMAP) visualization (left) and violin plot (right) showing SMARCD3 mRNA expression based on scRNA-seq data from 25 patients with MB. e, Boxplot showing levels of SMARCD3 expression (nG3 = 14, nG4 = 13, nSHH = 15, nWNT = 3). f, Kaplan–Meier survival curve of patients comparing all MB subgroups (left) and G3 only (right) based on SMARCD3 mRNA expression level. g, Left, representative images of IHC staining for SMARCD3 levels in MB tissue microarrays. Right, log-rank test for survival fraction of patients comparing all MB subgroups and G3 only based on SMARCD3 level. h, Top ten biological pathways of the SMARCD3-associated genes in MB by GO analysis. i, Density plots (top) and boxplots (bottom) showing the association between metastasis status (0, no metastasis; 1+, metastasis at diagnosis) and SMARCD3 mRNA (n0 = 397, n1+ = 176) and protein (n0 = 23, n1+ = 20) expression levels in primary MB samples. j, RT–qPCR (top) and immunoblotting (bottom) analyses showing SMARCD3 mRNA (n = 3) and protein levels in six G3 MB cell lines. k, Representative haematoxylin and eosin (H&E) images showing primary tumours (yellow dashed lines) and brain and spinal metastatic tumours (red dashed lines) in six orthotopic xenograft models derived from G3 MB cell lines. Images are representative of three independent mice, with similar results obtained (k). Each dot represents one bulk sample (c,e,i) or one cell (d). n represents the number of human patients (a,c,e,f,g,i) or biologically independent samples (j). Data are presented as the mean ± s.d. P values were calculated using two-tailed Welch’s t-test with FDR correction (c,e,i) or two-tailed accumulative hypergeometric distribution (h). Source data
Fig. 2
Fig. 2. SMARCD3 promotes cell migration and tumour metastasis.
a, IB for SMARCD3 expression in MED8A cells with control (WT) and SMARCD3 KO using two independent single-guide RNAs (sgRNAs; KO-1 and KO-2). b, Representative images (left) and quantification (right) showing cell migration of MED8A cells with SMARCD3 WT (n = 5), KO-1 (n = 5) or KO-2 (n = 5) in Transwell assays. c, Representative luminescence images (left) and pie charts (right) showing mice bearing MED8A cells with SMARCD3 WT or KO-1 after implantation. d, Representative IHC staining of SMARCD3 in MED8A-derived xenograft MB tumours. High-magnification images show a part of the tumour margin and core areas. e, IB for SMARCD3 expression in D458 cells with SMARCD3 WT or KO-1. f, Representative luminescence images (left) and pie charts (right) showing mice bearing D458 cells with SMARCD3 WT or KO-1 after implantation. g, Representative bright-field and fluorescence microscopy images of mouse brains bearing D458 cells with SMARCD3 WT or KO. h, Flow cytometry (left) and pie chart (right) analysis of GFP+ CTCs from peripheral blood mononuclear cells (PBMCs) of mice bearing D458 cells with SMARCD3 WT or KO (GFP+ ≥ 0.01%). i, RT–qPCR (top) and IB (bottom) for the SMARCD3 mRNA and protein expression levels in D425 cells with vector (n = 4) or SMARCD3 OE (n = 4). j, Representative luminescence images (left) and pie charts (right) showing mice bearing D425 cells with vector or SMARCD3 OE after implantation. k, Flow cytometry (left) and pie chart (right) analysis of GFP+ CTCs from PBMCs of mice bearing D425 cells with vector or SMARCD3 OE. l, Representative bright-field and fluorescence microscopy images of the spinal cords from mice bearing D425 cells with vector or SMARCD3 OE. m, Left: representative fluorescence stereoscopic images of mouse brain tumours derived from D425 cells with vector (n = 5) or SMARCD3 OE (n = 5). Insets: high-magnification images were donated. Right: histograms showing the number of brain metastases. n, Kaplan–Meier survival curve of the grouped mice bearing cells with high (MED8A, D458, D425-SMARCD3 OE) or low (MED8A-SMARCD3 KO, D458-SMARCD3 KO, D425) levels of SMARCD3 expression. The red arrow denotes the metastatic tumour observed by in vivo (c,f,j) or fluorescence (l) imaging. n represents the number of biologically independent samples (b,i) or mice (m). Data are presented as the mean ± s.d. P values were calculated using one-way ANOVA with Dunnett’s multiple comparison test (b) or one-tailed unpaired t-test (i,m). ∗∗∗∗P < 0.0001. At least five (a,d,e,g,m) or four (l) replicates per experiment were repeated independently, with similar results obtained. Source data
Fig. 3
Fig. 3. SMARCD3 promotes MB metastasis through the Reelin–DAB1 signalling pathway.
a, IPA canonical pathway enrichment analysis of DEGs in MED8A cells with SMARCD3 KO or WT. b, Volcano plot illustrating the DEGs in MED8A cells with SMARCD3 KO or WT (adjusted P < 0.05; twofold change). c, RT–qPCR analysis of DAB1 mRNA expression in MED8A (nKO = 4, nWT = 4) and D458 (nKO = 12, nWT = 8) cells with SMARCD3 KO or WT. d, RT–qPCR analysis of DAB1 mRNA expression in MED8A (nSMARCD3 OE = 4, nvector = 4), D425 (nSMARCD3 OE = 8, nvector = 6) and D556 (nSMARCD3 OE = 12, nvector = 12) cells with SMARCD3 OE or vectors. e, Violin plot showing DAB1 mRNA expression in MB and healthy cerebellum. f, Boxplots showing expression levels of total DAB1 (nG3 = 14, nG4 = 13, nSHH = 15, nWNT = 3) and phospho-DAB1 (Y232) (nG3 = 11, nG4 = 9, nSHH = 11, nWNT = 3) protein in proteomics datasets. g, Scatterplot showing the correlation between SMARCD3 and DAB1 mRNA expression in 1,280 MB samples. h, Scatterplots showing the correlations between SMARCD3 and total or phospho-DAB1 protein expression in 45 MB samples. i, RT–qPCR analysis of DAB1 mRNA expression in MED8A cells with DAB1 KO (n = 8) (three independent sgRNAs) or WT (n = 8). j, Representative images (left) and quantification (right) of cell migration of MED8A cells with DAB1 KO (nKO-1 = 5, nKO-4 = 10, nKO-5 = 5) or WT (n = 5) in Transwell assays. k, Bar diagrams showing the percentage of patients with MB with or without metastasis (0, no metastasis; 1+, metastasis at diagnosis) between high and low DAB1 mRNA expression. l, Boxplot showing DAB1 mRNA expression in patients with MB with metastasis compared with without metastasis. Each dot represents one patient bulk sample (eh). n represents the number of biologically independent samples (c,d,i,j) or patient samples (f). Data are presented as the mean ± s.d. P values were calculated using right-tailed Fisher’s exact test (a), one-tailed unpaired t-test (c,d), two-tailed Welch’s t-test with FDR correction (e,f,l), two-tailed Spearman’s rank correlation analysis (g,h) or one-way ANOVA with Dunnett’s multiple comparison test (i,j). ∗∗∗∗P < 0.0001. Source data
Fig. 4
Fig. 4. SMARCD3 regulates Reelin–DAB1 signalling in the developing cerebellum.
a, UMAP visualization and marker-based annotation of cell types from developing mouse cerebellum. b, Dot plot showing gene expression in the indicated cell types from the developing mouse cerebellum. c, mRNA expression in mouse PCs and GCs across the timeline of cerebellar development. d, Boxplot showing fluorescence intensity of SMARCD3 expression in PCs at each time point (nE12.5 = 100, nE15.5 = 100, nP0 = 100, nP7 = 100, nP28 = 26, nP84 = 43). e, Representative images of SMARCD3 (red) and FOXP2 (white) or CALB1 (white) in mouse cerebellum at each time point. Dashed lines outline indicated cerebellar regions. CP, choroid plexus; EGL, external granule layer; GL, granular layer; IGL, internal granule layer; ML, molecular layer; NTZ, nuclear transitory zone; PCC, Purkinje cell plate; PL, Purkinje layer; RL, upper rhombic lip; RP, roof plate; VZ, ventricular zone; WM, white matter. f, Dot plot showing gene expression in the indicated cell types from the developing human cerebellum. g, Scatterplots showing changes in SMARCD3 mRNA expression of human cerebella across the developmental process. h, Boxplot showing SMARCD3 mRNA expression levels in human cerebella from the indicated age groups. Each dot represents one cell (a,d) or a patient sample (g,h). Dot colour reflects the mean gene expression and dot size represents the percentage of cells expressing the gene (b,f). n represents the number of patient samples (nFoetal = 29, nInfant = 11, nChild = 12, nAdult = 215 for g,h). Representative images from four independent mice at each time point were repeated, with similar results obtained (e). Data are presented as the mean ± s.d. P values were calculated using one-way ANOVA (d) or two-tailed Welch’s t-test with FDR correction (h). Source data
Fig. 5
Fig. 5. SMARCD3 regulates DAB1 transcriptional activation through chromatin remodelling in MB and cerebellar development.
a, Volcano plots showing the differential accessibility (log2(fold change) in reads per peak) against the FDR (–log10) of MED8A cells with SMARCD3 KO or WT. Each dot represents one peak called by MACS3. b, The top ten molecular and cellular functions enriched according to IPA using the genes associated with reduced chromatin accessibility (FDR < 0.05; twofold change) in MED8A cells with SMARCD3 KO. c, Two-tailed Pearson’s correlation analysis of peak accessibility in ATAC-seq compared to DEGs in RNA-seq. d, ATAC-seq and histone-marker-binding signals from CUT&RUN in the DAB1 locus using MED8A cells with SMARCD3 KO or WT. The four CREs are marked by red bars and dashed-line boxes in the schematic of the genome (top). e, Histone-modification signals at the four CREs based on analyses of ChIP-seq data from five samples from patients with G3. H, high; L, low. f, Histone-modification signals at CRE2 based on analyses of ChIP-seq data from mouse cerebellum at the indicated time points. P value was calculated using right-tailed Fisher’s exact test (b).
Fig. 6
Fig. 6. TF-mediated chromatin hubs control SMARCD3 transcriptional activation in cerebellar development and MB.
a, ATAC-seq and histone-modification signals from CUT&RUN at the SMARCD3 locus in MED8A cell. The CREs (1–7) are marked with red bars in the schematic of the genome (top) and in light blue. b, Histone-modification signals at the SMARCD3 locus based on analyses of ChIP-seq data from five samples from patients with G3. c, Hi-C chromatin interaction map on a region centred in the Smarcd3 locus in mouse cerebellum (P22). Grey dashed lines outline topologically associating domain borders. Histone-modification signals are based on analyses of ChIP-seq data of mouse cerebellum samples at the indicated time points. Black arrowheads denote the CREs that are homologous to the CREs in MED8A cells. d, Histogram of Smarcd3 mRNA expression during mouse cerebellar development. TPM, transcripts per million. e, RT–qPCR analysis of SMARCD3 mRNA expression in MED8A cells after CRISPR–Cas9-mediated in situ CRE excision (n = 8 for each group). Excision of CREs in blue caused significant decreases in SMARCD3 mRNA levels. f, Cicero co-accessibility links among SMARCD3 CREs in PCs using sci-ATAC-seq3 data from the human cerebellum. The height and colour of connections indicate the magnitude of the Cicero co-accessibility score and the number of connected peaks. g, RT–qPCR analysis of SMARCD3 mRNA expression in MED8A cells after CRISPR–Cas9-mediated KO of the indicated TF (nCTRL = 12, nCENPA = 8, nCSRNP3 = 8, nEZH2 = 8, nZFHX4 = 8, nNR2F2 = 8, nFOXN3 = 8, nNFIX = 16, nTEF = 8). n represents the number of biologically independent samples from at least three independent experiments. Data are presented as the mean ± s.d. P values were calculated using one-way ANOVA with Dunnett’s multiple comparisons test (e,g). NS, not significant, P = 0.0203, ∗∗P = 0.0070, ∗∗∗∗P < 0.0001. Source data
Fig. 7
Fig. 7. Targeting SMARCD3–DAB1–Src activation attenuates MB metastatic dissemination.
a, Preoperative MRI sagittal image showing a patient with an enhancing metastatic tumour located at peritumoural brain oedema in the frontal lobe (red dashed line) and complete resection of the primary tumour in the cerebellum (yellow dashed line). b, Scatterplot showing the correlation between the IHC intensity of SMARCD3 and p-Src in MB tumours. c, Representative images of SMARCD3 and p-Src IHC staining in paired primary and metastatic MB samples from patient P09. d, Quantitative analyses of SMARCD3 and p-Src expression intensity in ten paired primary (P) and metastatic (M) MB samples. e, IHC (left) and quantitative analysis (right) of p-Src and total Src protein in tumours derived from mice bearing MED8A or D458 cells with SMARCD3 WT (n = 10) or KO (n = 8), respectively. f, IB for p-Src and total Src in MED8A and D458 cells with SMARCD3 WT or KO. g, Representative IHC images of p-Src in a MED8A-derived xenograft MB tumour. High-magnification images show the tumour margin and core areas. h,i, Representative images (left) and quantification (right) showing cell migration of MED8A (h; nDMSO = 15, nDasatinib = 15) and D458 (i; nDMSO = 7, nDasatinib = 8) cells treated with DMSO or 50 nM dasatinib in Transwell assays. j, Flow cytometry analyses (left) and quantification (right) of GFP+ CTCs from PBMCs of treated mice. k, IHC quantitative analysis of cleaved caspase-3 levels in tumours derived from the treated mice (nPlacebo = 8, nLow dose = 7, nStandard dose = 7). n represents the number of biologically independent samples (h,i) or mouse tissues (e,k). Data are presented as the mean ± s.d. P and R values were calculated using two-tailed Spearman’s rank correlation analysis (b), two-tailed paired t-test (d), one-tailed unpaired t-test (e,h,i), chi-square test (j) or one-way ANOVA with Dunnett’s multiple comparison test (k). ∗∗∗∗P < 0.0001. At least five replicates (f) or five mice (g) for each experiment were repeated independently, with similar results obtained. Source data
Extended Data Fig. 1
Extended Data Fig. 1. SMARCD3 expression and association with MB metastasis.
a, Violin plot showing expression levels of SMARCD3 mRNA in four MB subgroups in the RNAseq dataset (nG3 = 41, nG4 = 64, nSHH = 46, nWNT = 16). b, UMAP visualization of SMARCD3 expression in each cell in the scRNAseq data. c, Multivariable forest plot showing the significance of age, gender, and SMARCD3 mRNA expression level for overall survival in a multivariable model. d, Violin plot showing expression levels of SMARCD3 mRNA in four MB subgroups and normal cerebellum. e, Density plot and boxplot showing the association between metastasis status (0, no metastasis; 1 + , metastasis at diagnosis) and expression levels of SMARCD3 mRNA in primary G3 MB samples (n0 = 43, n1+ = 66) only. f, Bar diagrams showing the percentage of primary tumors without metastasis (0) or with metastasis (1 + ) in three groups with different expression levels of SMARCD3 mRNA (high, middle, low) in G3 MBs only and all subgroups of MBs, respectively. g, Histograms showing the number of differentially expressed genes between patients with metastasis and without metastasis by the log2(fold change). The arrows denote where SMARCD3 is located. h, Assessment of cell migration for 6 MB cell lines by Transwell assay (nMED8A = 5, nD341 = 5, nD283 = 6, nD458 = 5, nD425 = 3, nD556 = 3). One dot represents one cell (b), or one patient sample (a, d, e). n represents the number of human patients (a, e, f) or biologically independent samples (h). Data are presented as the mean ± s.d. (c, h). P values were calculated by two-tailed Welch’s t-test with FDR correction (a, e) or the two-tailed Wald test (c). Source data
Extended Data Fig. 2
Extended Data Fig. 2. Altering SMARCD3 expression influences MB cell migration and metastatic dissemination.
Time-lapse images and quantification of cell migration of MED8A (a) with SMARCD3 WT (n = 52), KO-1 (n = 52), and KO-2 (n = 10); and D341 (d) with SMARCD3 WT (n = 12), KO-1 (n = 10), and KO-2 (n = 12) by scratch-wound healing assays. b, IB for SMARCD3 in D341 cells with control (WT) and SMARCD3 KO-1 and KO-2. Transwell images and quantification of cell recruitment in D341 (c) with SMARCD3 WT, KO-1, and KO-2 (n = 5 for each group); D458 (f) with SMARCD3 WT (n = 5) and KO-1 (n = 7); and D425 (h) with vector (n = 7) and SMARCD3 OE (n = 8). Bioluminescence images of mice bearing MED8A (e) and D458 (g) cells with SMARCD3 WT vs KO-1 at day 18 and endpoint after implantation respectively; and D425 cells (i) with vector and SMARCD3 OE at day 26 after implantation (one mouse died before imaging scan). Time-lapse imaging for MED8A cell migration with SMARCD3 WT vs KO-1 by scratch-wound healing (j) or ex vivo brain slice assays (k); the color lines show cell tracks; scatterplot shows the correlation between cell migration velocity and directionality; violin plot shows the instantaneous motility speed (one dot shows one cell at a one-time point). Each dot represents one cell and the dot size represents the average motility speed of one cell (scatterplots in j, k). n represents the number of the biologically independent samples from at least 2 independent experiments; data are presented as the mean ± s.d. (a, c, d, f, h). P and R values were calculated using one-way ANOVA with Dunnett’s multiple comparison test (a, c, d), one-tailed unpaired t-test (f, h), or two-tailed Welch’s t-test with FDR correction and two-tailed Pearson’s correlation analysis (j, k). ∗∗∗P = 0.0002, ∗∗∗∗P < 0.0001. Source data
Extended Data Fig. 3
Extended Data Fig. 3. SMARCD3 influences tumor metastasis but not tumor development and growth.
a, IF images and quantification of bromodeoxyuridine (BrdU) in MED8A cells with SMARCD3 WT (n = 10), KO (nKO-1 = 5, nKO-2 = 3), and OE (n = 6). b, Cell proliferation (MTS assay) of MED8A (n = 9) and D458 (n = 3) with SMARCD3 WT vs KO. c, Kaplan-Meier survival of SCID mice bearing indicated tumor cells. d, PCNA signature score levels in G3, G4, SHH, WNT, and normal bulk samples (boxplot); and correlations with SMARCD3 mRNA expression (scatterplots) in all MBs (n = 1, 280) and G3 (n = 233). e, A MRI image of the cerebellar tumor induced by lentivirus carrying MYCS62D in the C57BL/6 J mouse. f, Kaplan-Meier survival of C57BL/6 J mice intracranially infected by lentivirus-mediated indicated gene expression. g, Representative bright-field and fluorescence images of the mouse brains bearing indicated tumors. h, The fluorescence images and pie charts showing the spinal cords from mice bearing indicated tumors. i, H&E and IHC images showing histopathological assessment of MYCS62D- and MYCS62D + SMARCD3-induced tumors for the indicated marker expression. j, Kaplan-Meier survival of SCID mice intracranially implanted by hcNSCs expressing indicated genes. k, Representative bright-field and fluorescence images of the SCID mouse brains bearing indicated tumors. Representative fluorescence images of the spinal cords (l) or luminescence images/pie charts showing spinal metastasis (m) from SCID mice bearing indicated tumors. The n number represents the biologically independent samples (a, b) or patient samples (d), and data are presented as the mean ± s.d. (a, b). P and R values were calculated using one-way ANOVA with Dunnett’s multiple comparison test (a), or two-tailed Welch’s t-test with FDR correction (boxplot in d), two-tailed Spearman’s rank correlation analysis (scatterplots in d), and log-rank test (f, j). The representative images from 4 independent mice were repeated with similar results (g, h, i, k, l). Source data
Extended Data Fig. 4
Extended Data Fig. 4. The association between SMARCD3 and DAB1 is evolutionarily conserved in the cerebellum.
a, Scatterplots showing the correlation of expression levels between DAB1 mRNA and the total DAB1 protein, phospho-DAB1 (pSTY), or phospho-DAB1 (Y232) in all MB tumors (n = 45). b, Boxplot showing the levels of phospho-DAB1 (pSTY) protein expression in the MB proteomics dataset (nG3 = 14, nG4 = 13, nSHH = 13, and nWNT = 3). c, Violin plot showing DAB1 mRNA expression in four MB subgroups and normal cerebellum. d, Scatterplot showing the correlation between SMARCD3 protein expression levels and the phospho-DAB1 (pSTY) protein levels in all MBs. e, f, Scatterplot showing the correlation between SMARCD3 and DAB1 mRNA expression levels in all cancer types and gliomas using the datasets from the TARGET and TCGA projects. The dashed line outlines the glioblastomas and low-grade gliomas. g, Scatterplot showing the correlations between SMARCD3 mRNA expression levels and DAB1 mRNA expression levels in normal tissues using the datasets from the GTEx projects. h, Scatterplot showing the correlations between SMARCD3 and DAB1 mRNA expression levels in brain tissues only. Dashed line circles highlight the tissues from the cerebellum and cerebellar hemisphere (g, h). i, Percentage of gene expression variance explained by species and by organs. Data from the reference were used for analysis, including six organs (brain, cerebellum, heart, kidney, liver, and testis) in seven vertebrate species (chicken, chimpanzee, human, mouse, opossum, platypus, and rhesus). Each color dot represents one tumor sample (a-f), a normal tissue sample (g-h), or a gene (i). The red dot is explained mostly by organ differences, while the blue dot is by species differences (i). P and R values were calculated using two-tailed Welch’s t-test with FDR correction (b) and/or two-tailed Spearman’s rank correlation analysis (a, d, e, f, g, h).
Extended Data Fig. 5
Extended Data Fig. 5. Characterization of SMARCD3 expression during human and mouse cerebellar development using scRNAseq datasets.
a, Dotplot showing the expression of each selected marker gene per cell type in mouse cerebellum. b, The schematic diagram shows the timeline of Purkinje cell development in both humans and mice. c, UMAP visualization of the developing mouse cerebellum. d, UMAP visualization and marker-based annotation of cell types from the developing human cerebellum. e, Dotplot showing the expression of each selected marker gene per cell type in the human cerebellum. f, The top 20 biological pathways are enriched by Gene-ontology analysis of the SMARCD3-positively correlated genes in the human cerebellum. g, The top 20 diseases are enriched in DisGeNET by analyzing the SMARCD3-positively correlated genes in the human cerebellum. Each dot represents one cell (c, d). Dots with the same color come from the same mouse cerebellum (c) or the same cell type (e). P value from the multiple Fisher test is corrected using two-tailed Benjamini-Hochberg method (f, g).
Extended Data Fig. 6
Extended Data Fig. 6. SMARCD3 modulates chromatin architecture for gene regulation.
a, Pearson correlation analysis of ATACseq replicates of MED8A cells with SMARCD3 KO vs WT. b, Mean accessibility and enrichment of ATACseq data with different insert lengths around transcription start site (TSS). c, Hi-C chromatin interaction map on a region centered in the Dab1 gene of mouse cerebellum (P22). The dashed lines outline TAD borders. d, Pearson correlation analysis of histone marker binding signals from CUT&RUN replicates of MED8A cells with SMARCD3 KO vs WT. e, Histogram of SMARCD3 mRNA expression (FPKM) in 5 G3 patient samples. Each tumor (T) is marked with higher (H), or lower (L), levels of SMARCD3 expression. f, Histone modification signals at CRE1, CRE3, and CRE4 at the locus of the Dab1 gene based on analyzing ChIPseq data of mouse hindbrain or cerebellum samples. These CREs in the mouse are homologous to the human CREs of the DAB1 gene. g, Histogram of Dab1 mRNA expression (TPM) during mouse cerebellar development at indicated time points.
Extended Data Fig. 7
Extended Data Fig. 7. The newly-identified CREs at the SMARCD3 gene locus in the primary human MB and combined cell and tissue types from the public enhancer databases.
a, H3K27ac binding signals at the SMARCD3 gene locus based on analyzing ChIPseq data of 4 subgroup MB from patients. b, Violin plot showing SMARCD3 mRNA levels of each subgroup of tumors. c, H3K27ac binding signals at the SMARCD3 gene locus based on analyzing ChIPseq data of each MB. d, CREs and histone modifications at the human SMARCD3 gene locus identified by ENCODE Data Analysis Center and Roadmap Epigenomics Project. e, CREs at the mouse Smarcd3 gene locus identified by ENCODE Data Analysis Center. Each dot represents one bulk sample (b). The color of the peak represents the subgroup (a, c). The CREs (1-7) in the genome are marked in light blue (a, c, d). The homologous CREs in the mouse genome are denoted with black arrowheads (e). P values were calculated using two-tailed Welch’s t-test with FDR correction (b).
Extended Data Fig. 8
Extended Data Fig. 8. Chromatin remodeling of SMARCD3 transcriptional regulation in MB and normal human cerebellum.
a, The schematic showing CRISPR/Cas9-mediated in situ genome exclusion. b, qRT-PCR for SMARCD3 mRNA expression in D458 cells with CRE excision (nCTRL = 16, nCRE1 = 14, nCRE2 = 12, nCRE3 = 14, nCRE4 = 8, nCRE5 = 12, nCRE6 = 16, nCRE7 = 12). c, Histone marker signals at the SMARCD3 locus. The CREs are marked in light blue. d, UMAP visualization of sci-ATACseq3 data from human cerebellum (nAstrocytes = 790, nGranule neurons = 1080, nInhibitory interneurons = 669, nPurkinje neurons = 774). e, Dotplot showing Cicero gene activity score calculated using sci-ATACseq3 data. f, Cicero coaccessibility links among SMARCD3 CREs. g, qRT-PCR for SMARCD3 mRNA expression in the cells with EZH2 OE vs Vector (n = 8 for each group). h, Association between SMARCD3 and EZH2 or NFIX mRNA expression in patient MB samples. Boxplot showing EZH2 (i) or NFIX (l) mRNA expression of human cerebella. Scatterplots showing EZH2 (j) and NFIX (k) mRNA expression of human cerebella changing along with the developmental process. m, The schematic diagram shows SMARCD3 transcriptional regulation mediated by chromatin hubs in cerebellar development and MB metastatic dissemination. Each dot represents one bulk sample (h-l), one cell (d), or the average Cicero gene activity score of SMARCD3 within a cell type (e). Dot size represents the percentage of nuclei within a cell type in which the Cicero gene activity score is not zero (e). n represents the number of the biologically independent samples from at least 2 independent experiments (b, g); data are presented as the mean ± s.d. P and R values were calculated using one-way ANOVA with Dunnett’s multiple comparison test (b), one-tailed unpaired t-test (g), two-tailed Welch’s t-test with FDR correction (i, l), and/or two-tailed Spearman’s rank correlation analysis (h). NS, not significant, ∗∗P = 0.0045 (CRE4)/0.0014 (CRE5)/0.0099 (CRE7), ∗∗∗∗P < 0.0001. Source data
Extended Data Fig. 9
Extended Data Fig. 9. Dasatinib treatment inhibits cell migration and tumor metastasis.
a, The schematic diagram shows that SMARCD3 induces PC radial migration and MB metastasis mediated by the Reelin/DAB1-activated SFK loop. b, IHC and quantitative analysis of expression levels of p-Src (416) and total Src in the tumors derived from mice bearing MED8A and D458 with SMARCD3 KO (n = 8) vs WT (n = 10), respectively. Boxed regions correspond to the regions shown in Fig. 7e. c, d, Representative images showing cell migration of MED8A (n ≥ 5) and D458 (n ≥ 7) cells treated with DMSO or indicated concentrations of dasatinib by Transwell assay. e, Scheme of experiment in which mice bearing MB were gavaged with placebo, low dose, and standard dose dasatinib. f, Bioluminescence images and pie charts showing mice bearing D458 cells with dasatinib treatment at day 21 after intracranial implantation. g, IHC quantitative analysis of Ki67 levels in the treated mice (n = 7 for each group). h, The schematic diagram shows that SMARCD3 plays a central role in cerebellar development and MB metastatic dissemination by regulating the Reelin/DAB1/Src signaling at the molecular, cellular, and tissue/organ levels. SMARCD3 transcription regulation is mediated by chromatin hubs during cerebellar development and MB aggressiveness. Targeting SMARCD3/Reelin/DAB1/Src signaling provides a potential novel antimetastatic therapy for patients with MB. n represents the number of the biologically independent samples from at least 3 independent experiments (c, d) or mouse samples (b, g); data are presented as the mean ± s.d. P value was calculated using two-tailed unpaired t-test (b), or one-way ANOVA with Dunnett’s multiple comparison test (c, d, g). NS, not significant, ∗∗∗∗P < 0.0001. Source data

References

    1. Louis, D. N. et al. The 2016 World Health Organization classification of tumors of the central nervous system: a summary. Acta Neuropathol.131, 803–820 (2016). - PubMed
    1. Zou, H., Poore, B., Broniscer, A., Pollack, I. F. & Hu, B. Molecular heterogeneity and cellular diversity: implications for precision treatment in medulloblastoma. Cancers10.3390/cancers12030643 (2020). - PMC - PubMed
    1. Taylor MD, et al. Molecular subgroups of medulloblastoma: the current consensus. Acta Neuropathol. 2012;123:465–472. doi: 10.1007/s00401-011-0922-z. - DOI - PMC - PubMed
    1. Cavalli FMG, et al. Intertumoral heterogeneity within medulloblastoma subgroups. Cancer Cell. 2017;31:737–754.e6. doi: 10.1016/j.ccell.2017.05.005. - DOI - PMC - PubMed
    1. Northcott PA, et al. Medulloblastomics: the end of the beginning. Nat. Rev. Cancer. 2012;12:818–834. doi: 10.1038/nrc3410. - DOI - PMC - PubMed

Publication types

MeSH terms

Substances