. 2023 Apr;7(4):529-544.
doi: 10.1038/s41562-023-01522-y. Epub 2023 Feb 27.

Changes in preterm birth and stillbirth during COVID-19 lockdowns in 26 countries

Clara Calvert #  1 Meredith Merilee Brockway #  2 Helga Zoega #  3   4 Jessica E Miller #  5   6 Jasper V Been  7 Adeladza Kofi Amegah  8 Amy Racine-Poon  9 Solmaz Eradat Oskoui  1 Ishaya I Abok  10 Nima Aghaeepour  11 Christie D Akwaowo  12   13 Belal N Alshaikh  14 Adejumoke I Ayede  15 Fabiana Bacchini  16 Behzad Barekatain  17 Rodrigo Barnes  18 Karolina Bebak  19 Anick Berard  20   21   22 Zulfiqar A Bhutta  23   24 Jeffrey R Brook  25 Lenroy R Bryan  26 Kim N Cajachagua-Torres  27   28   29 Marsha Campbell-Yeo  30 Dinh-Toi Chu  31 Kristin L Connor  32 Luc Cornette  33 Sandra Cortés  34 Mandy Daly  35 Christian Debauche  36   37 Iyabode Olabisi F Dedeke  38 Kristjana Einarsdóttir  4   39 Hilde Engjom  40 Guadalupe Estrada-Gutierrez  41 Ilaria Fantasia  42 Nicole M Fiorentino  2 Meredith Franklin  43 Abigail Fraser  44 Onesmus W Gachuno  45 Linda A Gallo  46 Mika Gissler  47   48   49 Siri E Håberg  50 Abbas Habibelahi  51 Jonas Häggström  52 Lauren Hookham  53 Lisa Hui  54 Luis Huicho  55 Karen J Hunter  1 Sayeeda Huq  56 Ashish Kc  57 Seilesh Kadambari  58 Roya Kelishadi  59 Narjes Khalili  60 Joanna Kippen  19 Kirsty Le Doare  61   62 Javier Llorca  63   64 Laura A Magee  65 Maria C Magnus  50 Kenneth K C Man  66   67   68 Patrick M Mburugu  69 Rishi P Mediratta  70 Andrew D Morris  71 Nazeem Muhajarine  72 Rachel H Mulholland  1 Livia Nagy Bonnard  73 Victoria Nakibuuka  74 Natasha Nassar  75 Sylvester D Nyadanu  39   76 Laura Oakley  50   77 Adesina Oladokun  78 Oladapo O Olayemi  78 Olanike A Olutekunbi  79 Rosena O Oluwafemi  80 Taofik O Ogunkunle  81 Chris Orton  82 Anne K Örtqvist  83   84 Joseph Ouma  85 Oyejoke Oyapero  86 Kirsten R Palmer  87 Lars H Pedersen  88 Gavin Pereira  50   89 Isabel Pereyra  90 Roy K Philip  91 Dominik Pruski  19 Marcin Przybylski  19 Hugo G Quezada-Pinedo  27   28   29 Annette K Regan  92 Natasha R Rhoda  93   94 Tonia A Rihs  95 Taylor Riley  96 Thiago Augusto Hernandes Rocha  97 Daniel L Rolnik  87 Christoph Saner  5   98   99 Francisco J Schneuer  100 Vivienne L Souter  101 Olof Stephansson  83 Shengzhi Sun  102 Emma M Swift  103 Miklós Szabó  104 Marleen Temmerman  105 Lloyd Tooke  106 Marcelo L Urquia  107 Peter von Dadelszen  65 Gregory A Wellenius  102 Clare Whitehead  108 Ian C K Wong  66   67   68 Rachael Wood  1   109 Katarzyna Wróblewska-Seniuk  110 Kojo Yeboah-Antwi  111 Christopher S Yilgwan  112 Agnieszka Zawiejska  113 Aziz Sheikh  1 Natalie Rodriguez  2 David Burgner  114   115 Sarah J Stock  116 Meghan B Azad  117   118
Affiliations

Changes in preterm birth and stillbirth during COVID-19 lockdowns in 26 countries

Clara Calvert et al. Nat Hum Behav. 2023 Apr.

Abstract

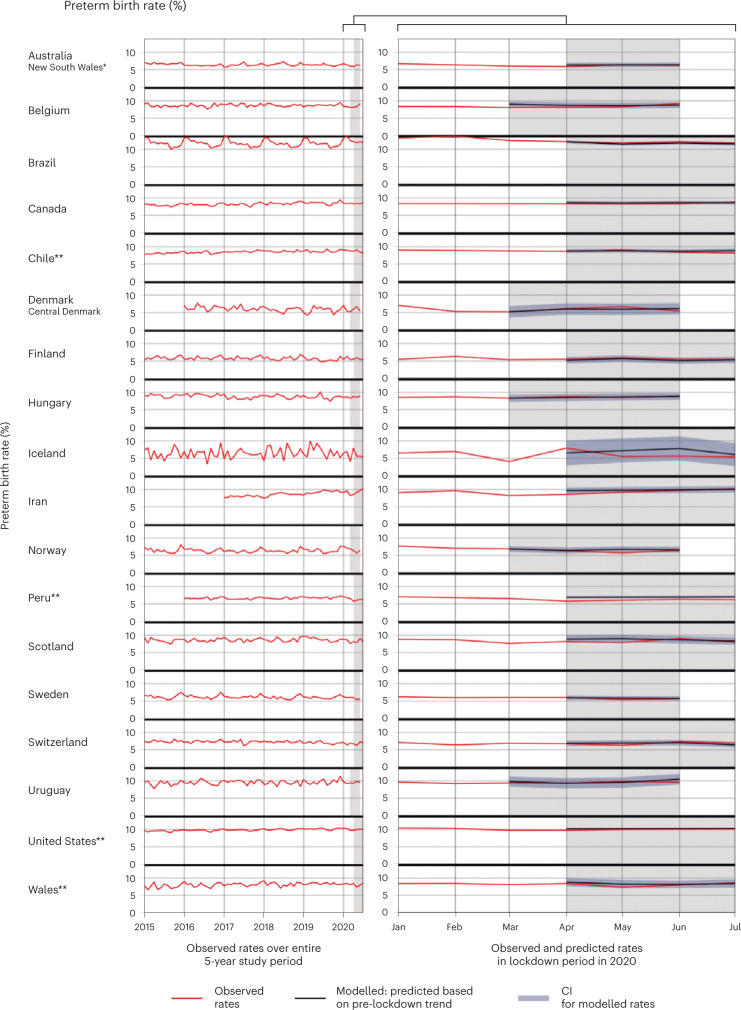
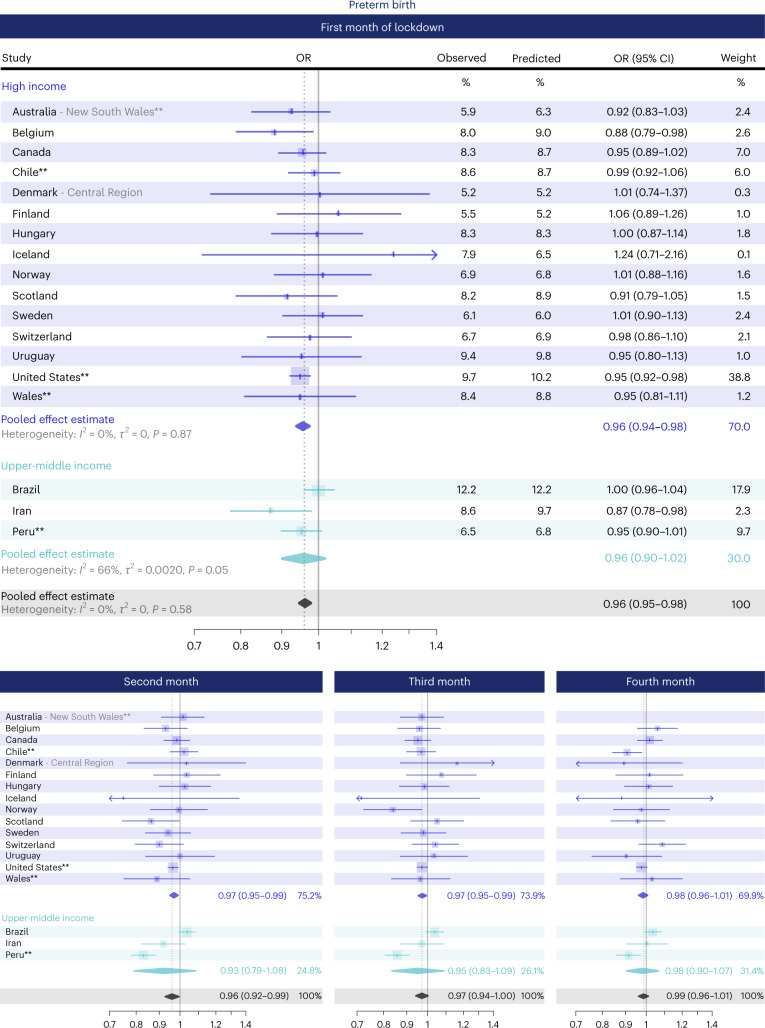
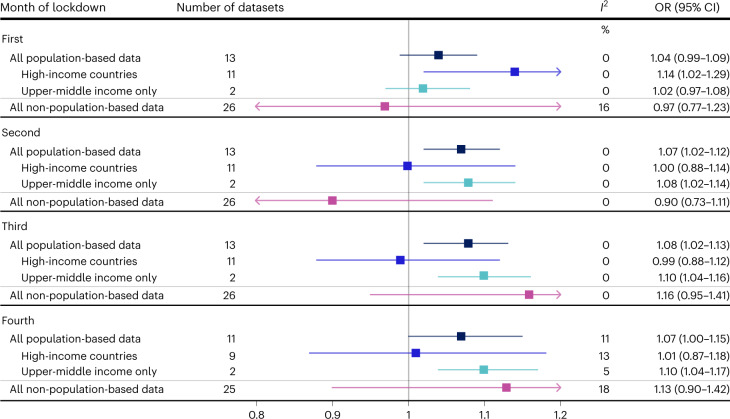
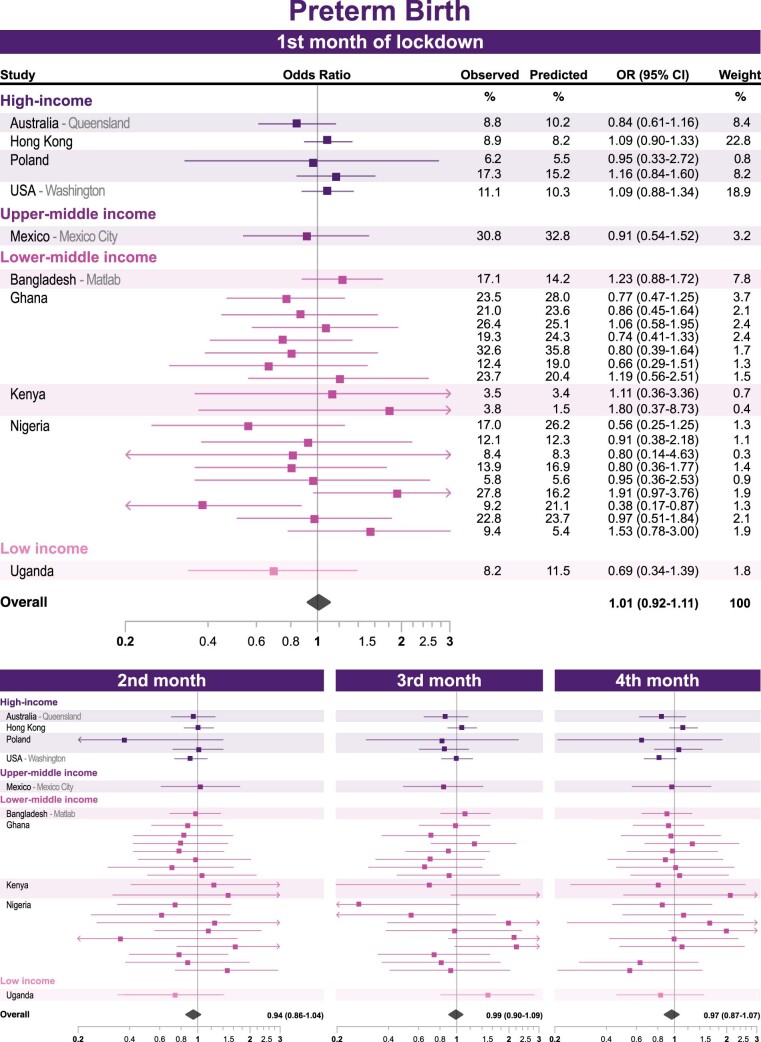
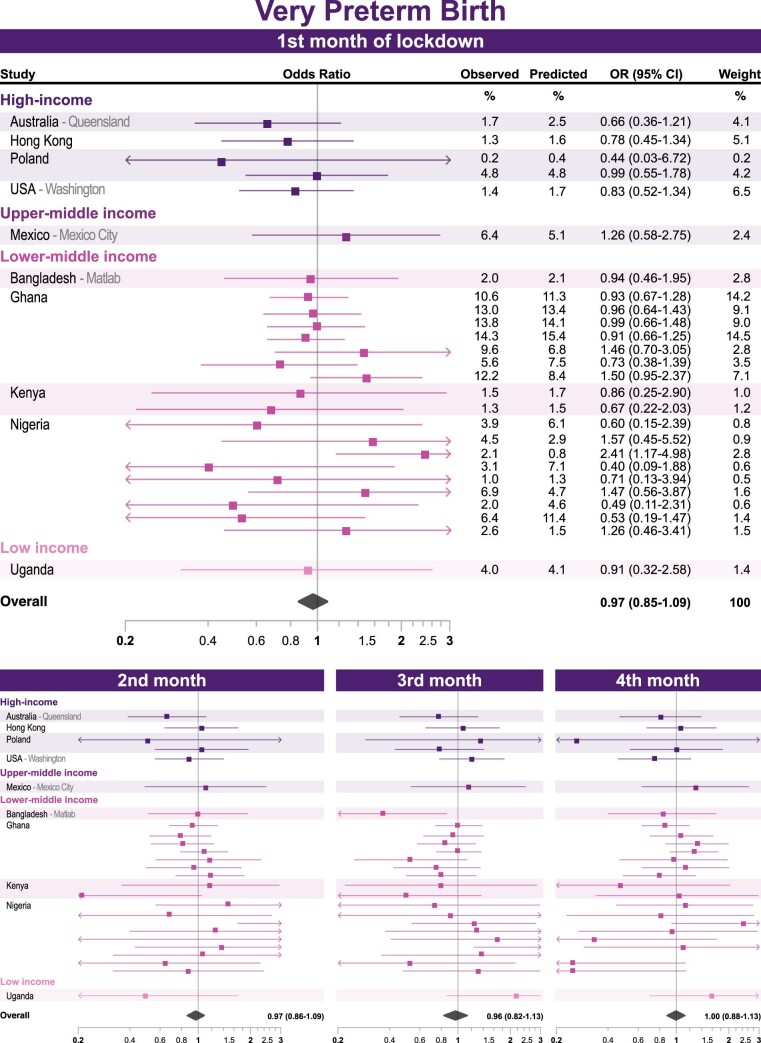
Preterm birth (PTB) is the leading cause of infant mortality worldwide. Changes in PTB rates, ranging from -90% to +30%, were reported in many countries following early COVID-19 pandemic response measures ('lockdowns'). It is unclear whether this variation reflects real differences in lockdown impacts, or perhaps differences in stillbirth rates and/or study designs. Here we present interrupted time series and meta-analyses using harmonized data from 52 million births in 26 countries, 18 of which had representative population-based data, with overall PTB rates ranging from 6% to 12% and stillbirth ranging from 2.5 to 10.5 per 1,000 births. We show small reductions in PTB in the first (odds ratio 0.96, 95% confidence interval 0.95-0.98, P value <0.0001), second (0.96, 0.92-0.99, 0.03) and third (0.97, 0.94-1.00, 0.09) months of lockdown, but not in the fourth month of lockdown (0.99, 0.96-1.01, 0.34), although there were some between-country differences after the first month. For high-income countries in this study, we did not observe an association between lockdown and stillbirths in the second (1.00, 0.88-1.14, 0.98), third (0.99, 0.88-1.12, 0.89) and fourth (1.01, 0.87-1.18, 0.86) months of lockdown, although we have imprecise estimates due to stillbirths being a relatively rare event. We did, however, find evidence of increased risk of stillbirth in the first month of lockdown in high-income countries (1.14, 1.02-1.29, 0.02) and, in Brazil, we found evidence for an association between lockdown and stillbirth in the second (1.09, 1.03-1.15, 0.002), third (1.10, 1.03-1.17, 0.003) and fourth (1.12, 1.05-1.19, <0.001) months of lockdown. With an estimated 14.8 million PTB annually worldwide, the modest reductions observed during early pandemic lockdowns translate into large numbers of PTB averted globally and warrant further research into causal pathways.


Conflict of interest statement

M.B.A. holds a Tier 2 Canada Research Chair in the Developmental Origins of Chronic Disease at the University of Manitoba and is a Fellow in the Canadian Institutes for Advanced Research (CIFAR) Humans and the Microbiome Program. Her effort on this project was partly supported by HDR UK and ICODA. K.K.C.M. declares support from The Innovation and Technology Commission of the Hong Kong Special Administrative Region Government, and Hong Kong Research Grants Council Collaborative Research Fund Coronavirus Disease (COVID-19) and Novel Infectious Disease Research Exercise (Ref: C7154-20G) and grants from C W Maplethorpe Fellowship, National Institute of Health Research UK, European Commission Framework Horizon 2020 and has consulted for IQVIA Ltd. A.S. is supported by ICODA and HDR UK, and has received a research grant from HDR UK to the BREATHE Hub. He participates on the Scottish and UK Government COVID-19 Advisory Committees, unremunerated. S.J.S. is supported by a Wellcome Trust Clinical Career Development Fellowship (209560/Z/17/Z) and HDR UK, and has received personal fees from Hologic and Natera outside the submitted work. D.B. is supported by a National Health and Medical Research Council (Australia) Investigator Grant (GTN1175744). I.C.K.W. declares support from The Innovation and Technology Commission of the Hong Kong Special Administrative Region Government, and Hong Kong Research Grants Council Collaborative Research Fund Coronavirus Disease (COVID-19) and Novel Infectious Disease Research Exercise (Ref: C7154-20G), and grants from Hong Kong Research Grant Council, National Institute of Health Research UK, and European Commission Framework Horizon 2020. H.Z. is supported by a UNSW Scientia Program Award and reports grants from European Commission Framework Horizon 2020, Icelandic Centre for Research, and Australia’s National Health and Medical Research Council. H.Z. was an employee of the UNSW Centre for Big Data Research in Health, which received funding from AbbVie Australia to conduct research, unrelated to the current study. I.I.A.A., C.D.A., K.A., A.I.A., L.C., S.S., G.E.-G., O.W.G., L. Huicho, S.H., A.K., K.L., V.N., I.P., N.R.R., T.R., T.A.H.R., V.L.S., E.M.S., L.T., R.W. and H.Z. received funding from HDRUK (grant #2020.106) to support data collection for the iPOP study. K.H., R.B., S.O.E., A.R.-P. and J.H. receive salary from ICODA. M.B. received trainee funding from HDRUK (grant #2020.106). J.E.M. received trainee funding from HDRUK (grant #2020.109). Other relevant funding awarded to authors to conduct research for iPOP include: M.G. received funding from THL, Finnish Institute for Health and Welfare to support data collection. K.D. received funding from EDCTP RIA2019 and HDRUK (grant #2020.106) to support data collection. R.B. received funding from Alzheimer’s Disease Data Initiative and ICODA for the development of federated analysis. A.D.M. received funding from HDR UK who receives its funding from the UK Medical Research Council, Engineering and Physical Sciences Research Council, Economic and Social Research Council, Department of Health and Social Care (England), Chief Scientist Office of the Scottish Government Health and Social Care Directorates, Health and Social Care Research and Development Division (Welsh Government), Public Health Agency (Northern Ireland), British Heart Foundation (BHF) and the Wellcome Trust; and Administrative Data Research UK, which is funded by the Economic and Social Research Council (grant ES/S007393/1). N.A. received funding from the National Institutes of Health (R35GM138353). O.S received funding from NordForsk (grant #105545). The remaining authors declare no competing interests.

Figures

Fig. 1
Fig. 1. Trends in preterm birth rates among population-based datasets included in the iPOP Study; 2015 –2020.
Observed rates of preterm birth (among all births 22 weeks onwards) over time (2015–2020) for countries providing population-based data, with the forecasted preterm birth rates and 95% CIs also plotted for the lockdown period. Lockdown period shown in shaded grey. Unless specified otherwise, preterm birth rates are the percentage of all births from 22 weeks onwards that were born before 37 weeks gestation. Left: entire study period (2015–2020) illustrating seasonality and trends over time. Right: 2020 period enlarged to show the observed and forecasted births during lockdown. Forecasted (‘modelled’) rates were estimated from a ‘pre-lockdown model’ that was used to forecast the expected rates of the preterm birth for each of the first four months of lockdown assuming lockdown had not occurred. *Preterm birth rates restricted to births from 24 weeks onwards; **Preterm birth rates restricted to live births only.
Fig. 2
Fig. 2. Association between lockdown and preterm birth rates in the iPOP Study in population-based datasets.
Individual and pooled population-based estimates of the association between lockdown and the odds of preterm birth among all births 22 weeks onwards, stratified by time since lockdown. Individual country ORs (represented by boxes on plot) were calculated by comparing the observed odds of preterm birth with the forecasted odds of preterm birth from an ITS model that was fitted to pre-lockdown data. Horizontal lines surrounding each box on the forest plot are 95% CIs. Arrows indicate upper and/or lower bounds of the CI that are outside the x-axis limits. Pooled ORs (represented by diamonds on plot) for the association between lockdown and the odds of preterm birth were calculated using random-effects meta-analysis. Sample sizes for each country provided in Table 1. *Births from 24 weeks onwards **Live births only.
Fig. 3
Fig. 3. Pooled estimates of the association between lockdown and preterm birth rates in the iPOP Study.
Pooled ORs capturing the association between lockdown and the odds of preterm birth, stratified by month of lockdown, type of data (population-based, non-population based) and income setting. Pooled ORs (represented by boxes on plot) were calculated using random-effects meta-analysis. Horizontal lines surrounding each box on the forest plot are 95% CIs for the OR. Arrows indicate upper and/or lower bounds of the CI that are outside the x-axis limits.
Fig. 4
Fig. 4. Pooled estimates of the association between lockdown and very preterm birth in the iPOP Study.
Pooled ORs capturing the association between lockdown and the odds of very preterm birth (births at <32 weeks gestation), stratified by month of lockdown, type of data (population-based, non-population-based) and income setting. Pooled ORs (represented by boxes on plot) were calculated using random-effects meta-analysis. Horizontal lines surrounding each box on the forest plot are 95% CIs for the OR.
Fig. 5
Fig. 5. Pooled estimates of the association between lockdown and spontaneous preterm birth in the iPOP Study.
Pooled ORs capturing the association between lockdown and the odds of spontaneous preterm birth, stratified by month of lockdown, type of data (population-based, non-population based) and income setting. Pooled ORs (represented by boxes on plot) were calculated using random-effects meta-analysis. Horizontal lines surrounding each box on the forest plot are 95% CIs for the OR. Arrows indicate upper and/or lower bounds of the CI that are outside the x-axis limits. NA, not applicable.
Fig. 6
Fig. 6. Pooled estimates of the association between lockdown and odds of stillbirth in the iPOP Study.
Pooled ORs capturing the association between lockdown and the odds of stillbirth, stratified by month of lockdown, type of data (population-based, non-population based) and income setting. Pooled ORs (represented by boxes on plot) were calculated using random-effects meta-analysis. Horizontal lines surrounding each box on the forest plot are 95% CIs for the OR. Arrows indicate upper and/or lower bounds of the CI that are outside the x-axis limits.
Extended Data Fig. 1
Extended Data Fig. 1. Observed rates of very preterm births (amongst all births 22 weeks onwards) over time (2015-2020) for countries with population-based data, with the forecasted very preterm births and 95% confidence intervals also plotted for the lockdown period.
Lockdown period shown in shaded grey. Unless specified otherwise, very preterm birth rates are the percentage of all births from 22 weeks onwards that were born before 32 weeks gestation. Left panel: entire study period (2015-2020) illustrating seasonality and trends over time. Right panel: 2020 period enlarged to show the observed and forecasted very preterm birth rates during lockdown. Forecasted (‘modelled’) rates were estimated from a ‘pre-lockdown model’ which was used to forecast the expected rates of very preterm birth for each of the first four months of lockdown assuming lockdown had not occurred. *Very preterm birth rates restricted to births from 24 weeks onwards; **Very preterm birth rates restricted to live births only.
Extended Data Fig. 2
Extended Data Fig. 2. Observed rates of spontaneous preterm births (amongst all births 22 weeks onwards) over time (2015-2020) for countries with population-based data, with the forecasted spontaneous preterm births and 95% confidence intervals also plotted for the lockdown period.
Lockdown period shown in shaded grey. Unless specified otherwise, spontaneous preterm birth rates are the percentage of all births from 22 weeks onwards that were born before 37 weeks gestation and where the birth was preceded by spontaneous contractions or preterm prelabour rupture of membranes. Left panel: entire study period (2015-2020) illustrating seasonality and trends over time. Right panel: 2020 period enlarged to show the observed and forecasted spontaneous preterm birth rates during lockdown. Forecasted (‘modelled’) rates were estimated from a ‘pre-lockdown model’ which was used to forecast the expected rates of spontaneous preterm birth for each of the first four months of lockdown assuming lockdown had not occurred. *Spontaneous preterm birth rates restricted to births from 24 weeks onwards; **Spontaneous preterm birth rates restricted to live births only.
Extended Data Fig. 3
Extended Data Fig. 3. Observed rates of stillbirth (amongst all births 22 weeks onwards) over time (2015-2020) for countries with population-based data, with the forecasted stillbirth rates and 95% confidence intervals also plotted for the lockdown period.
Lockdown period shown in shaded grey. Unless specified otherwise, stillbirth rates are the number of all births from 22 weeks onwards that were stillborn expressed per 1000 births. Left panel: entire study period (2015-2020) illustrating seasonality and trends over time. Right panel: 2020 period enlarged to show the observed and forecasted stillbirth rates during lockdown. Forecasted (‘modelled’) rates were estimated from a ‘pre-lockdown model’ which was used to forecast the expected rates of stillbirth for each of the first four months of lockdown assuming lockdown had not occurred. *Stillbirths rates restricted to births from 24 weeks onwards.
Extended Data Fig. 4
Extended Data Fig. 4. Individual and pooled non-population-based estimates of the association between lockdown and the odds of preterm birth among all births 22 weeks onwards, stratified by time since lockdown.
Individual odds ratios (represented by boxes on plot) for each dataset were calculated by comparing the observed odds of preterm birth to the forecasted odds of preterm birth from a linear regression model that was fitted to pre-lockdown data. Horizontal lines surrounding each box on the forest plot are 95% confidence intervals. Pooled odds ratios (represented by diamonds on plot) for the association between lockdown and the odds of preterm birth were calculated using random-effects meta-analysis. Sample sizes for each dataset provided in Table 2.*Births from 24 weeks onwards; **Live births only.
Extended Data Fig. 5
Extended Data Fig. 5. Individual and pooled population-based estimates of the association between lockdown and the odds of very preterm birth among all births 22 weeks onwards, stratified by time since lockdown.
Individual country odds ratios (represented by boxes on plot) were calculated by comparing the observed odds of very preterm birth to the forecasted odds of very preterm birth from an interrupted time series model that was fitted to pre-lockdown data. Horizontal lines surrounding each box on the forest plot are 95% confidence intervals. Pooled odds ratios (represented by diamonds on plot) for the association between lockdown and the odds of very preterm birth were calculated using random-effects meta-analysis. Sample sizes for each country provided in Table 1. *Births from 24 weeks onwards; **Live births only.
Extended Data Fig. 6
Extended Data Fig. 6. Individual and pooled non-population-based estimates of the association between lockdown and the odds of very preterm birth among all births 22 weeks onwards, stratified by time since lockdown.
Individual odds ratios (represented by boxes on plot) for each dataset were calculated by comparing the observed odds of very preterm birth to the forecasted odds of very preterm birth from a linear regression model that was fitted to pre-lockdown data. Horizontal lines surrounding each box on the forest plot are 95% confidence intervals. Pooled odds ratios (represented by diamonds on plot) for the association between lockdown and the odds of very preterm birth were calculated using random-effects meta-analysis. Sample sizes for each dataset provided in Table 2.
Extended Data Fig. 7
Extended Data Fig. 7. Individual and pooled population-based estimates of the association between lockdown and the odds of spontaneous preterm birth among all births 22 weeks onwards, stratified by time since lockdown.
Individual country odds ratios (represented by boxes on plot) were calculated by comparing the observed odds of spontaneous preterm birth to the forecasted odds of spontaneous preterm birth from an interrupted time series model that was fitted to pre-lockdown data. Horizontal lines surrounding each box on the forest plot are 95% confidence intervals. Pooled odds ratios (represented by diamonds on plot) for the association between lockdown and the odds of spontaneous preterm birth were calculated using random-effects meta-analysis. Sample sizes for each country provided in Table 1. *Births from 24 weeks onwards; **Live births only.
Extended Data Fig. 8
Extended Data Fig. 8. Individual and pooled non-population-based estimates of the association between lockdown and the odds of spontaneous preterm birth among all births 22 weeks onwards, stratified by time since lockdown.
Individual odds ratios (represented by boxes on plot) for each dataset were calculated by comparing the observed odds of spontaneous preterm birth to the forecasted odds of spontaneous preterm birth from a linear regression model that was fitted to pre-lockdown data. Horizontal lines surrounding each box on the forest plot are 95% confidence intervals. Pooled odds ratios (represented by diamonds on plot) for the association between lockdown and the odds of spontaneous preterm birth were calculated using random-effects meta-analysis. Sample sizes for each dataset provided in Table 2.
Extended Data Fig. 9
Extended Data Fig. 9. Individual and pooled population-based estimates of the association between lockdown and the odds of stillbirth among all births 22 weeks onwards, stratified by time since lockdown.
Individual country odds ratios (represented by boxes on plot) were calculated by comparing the observed odds of stillbirth to the forecasted odds of stillbirth from an interrupted time series model that was fitted to pre-lockdown data. Horizontal lines surrounding each box on the forest plot are 95% confidence intervals. Pooled odds ratios (represented by diamonds on plot) for the association between lockdown and the odds of preterm birth were calculated using random-effects meta-analysis. Sample sizes for each country provided in Table 1. *Per 1000 births; **Births from 24 weeks onwards.
Extended Data Fig. 10
Extended Data Fig. 10. Individual and pooled non-population-based estimates of the association between lockdown and the odds of stillbirth all births 22 weeks onwards, stratified by time since lockdown.
Individual odds ratios (represented by boxes on plot) for each dataset were calculated by comparing the observed odds of stillbirth to the forecasted odds of stillbirth from a linear regression model that was fitted to pre-lockdown data. Horizontal lines surrounding each box on the forest plot are 95% confidence intervals. Pooled odds ratios (represented by diamonds on plot) for the association between lockdown and the odds of stillbirth were calculated using random-effects meta-analysis. Sample sizes for each dataset provided in Table 2. *Per 1000 births; **Restricted to births from 28 weeks onwards.

References

    1. Chawanpaiboon, S. et al. Global, regional, and national estimates of levels of preterm birth in 2014: a systematic review and modelling analysis. Lancet Glob. Health7, e37–e46 (2019). - PMC - PubMed
    1. Vogel, J. P. et al. The global epidemiology of preterm birth. Best. Pract. Res. Clin. Obstet. Gynaecol.52, 3–12 (2018). - PubMed
    1. Blencowe, H. et al. National, regional, and worldwide estimates of stillbirth rates in 2015, with trends from 2000: a systematic analysis. Lancet Glob. Health4, e98–e108 (2016). - PubMed
    1. Hug, L. et al. Global, regional, and national estimates and trends in stillbirths from 2000 to 2019: a systematic assessment. Lancet398, 772–785 (2021). - PMC - PubMed
    1. Matheson, A. et al. Prematurity rates during the coronavirus disease 2019 (COVID-19) pandemic lockdown in Melbourne, Australia. Obstet. Gynecol.137, 405–407 (2021). - PMC - PubMed

Publication types