. 2023 Apr;7(4):596-610.
doi: 10.1038/s41562-023-01519-7. Epub 2023 Feb 27.

A highly replicable decline in mood during rest and simple tasks

Affiliations

A highly replicable decline in mood during rest and simple tasks

David C Jangraw et al. Nat Hum Behav. 2023 Apr.

Abstract

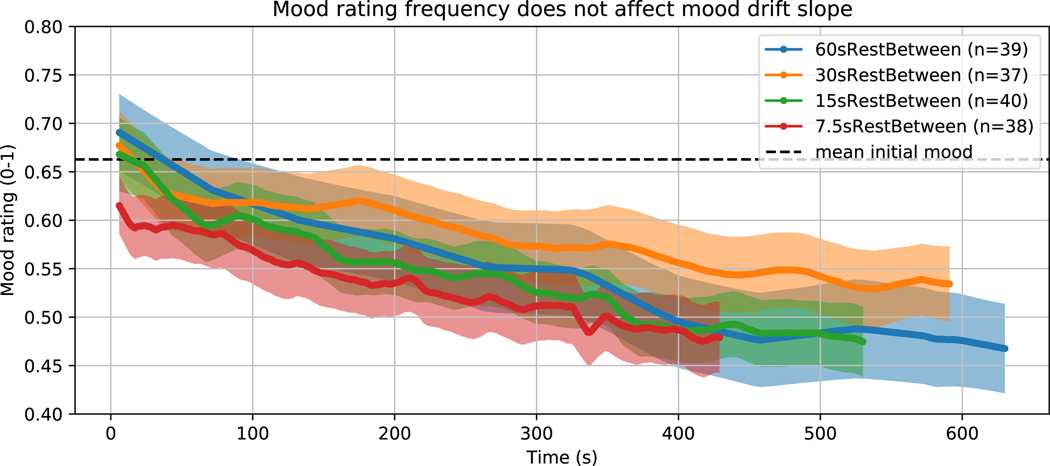
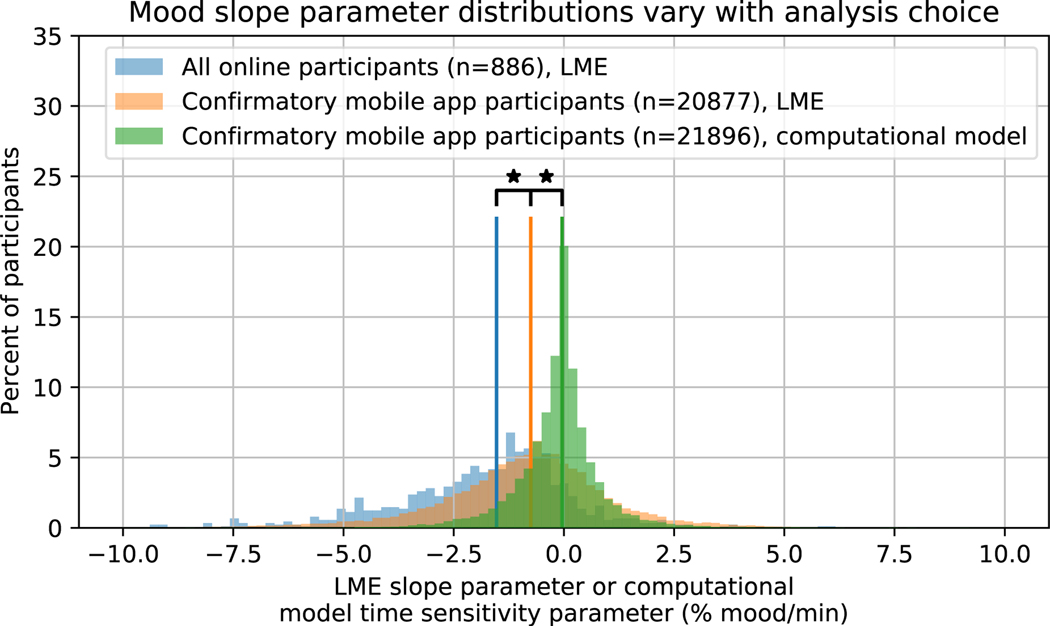
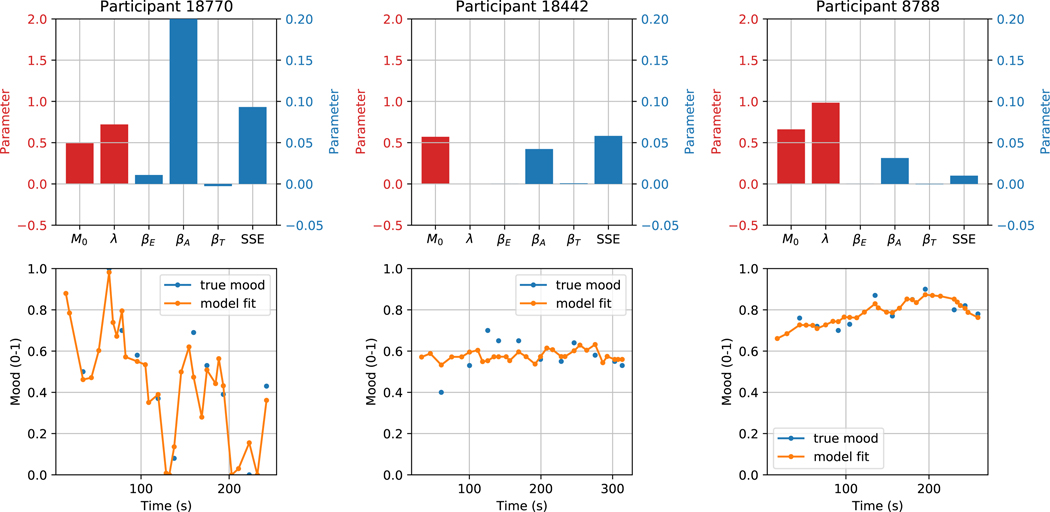
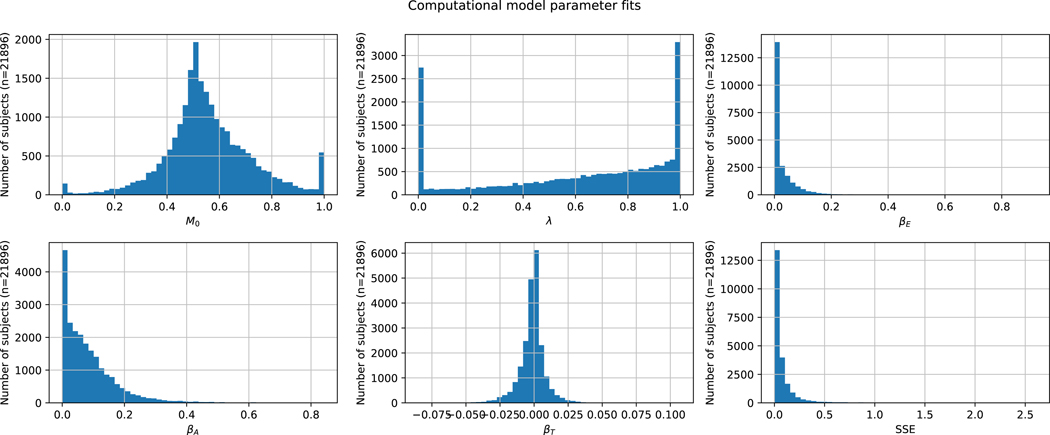
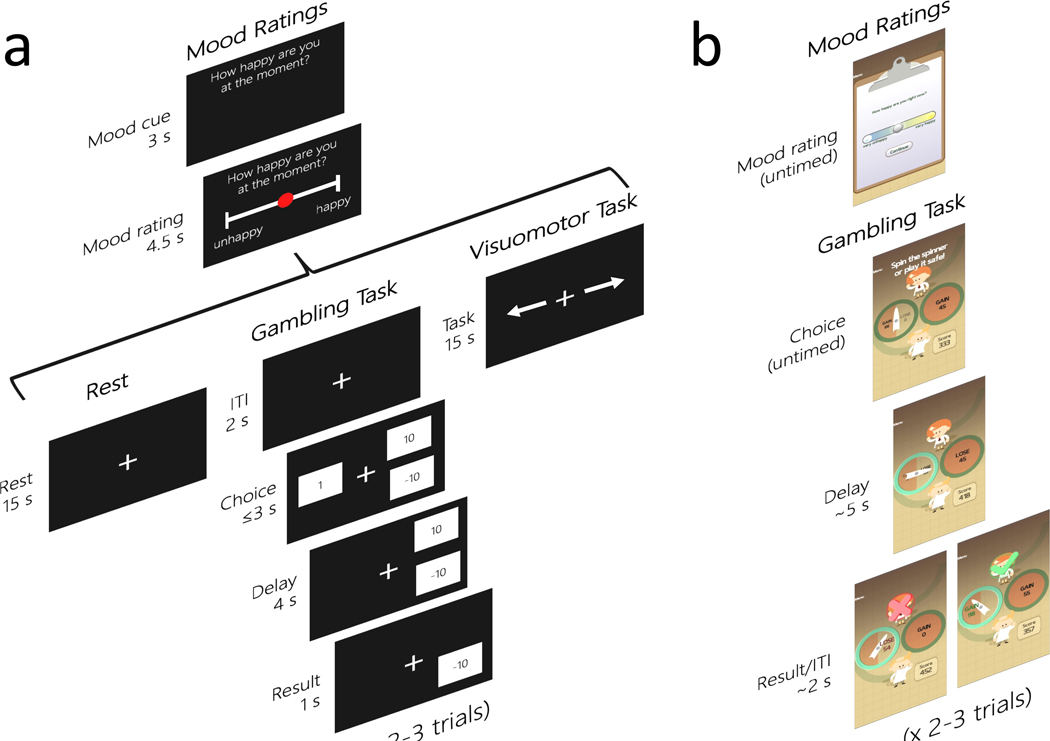
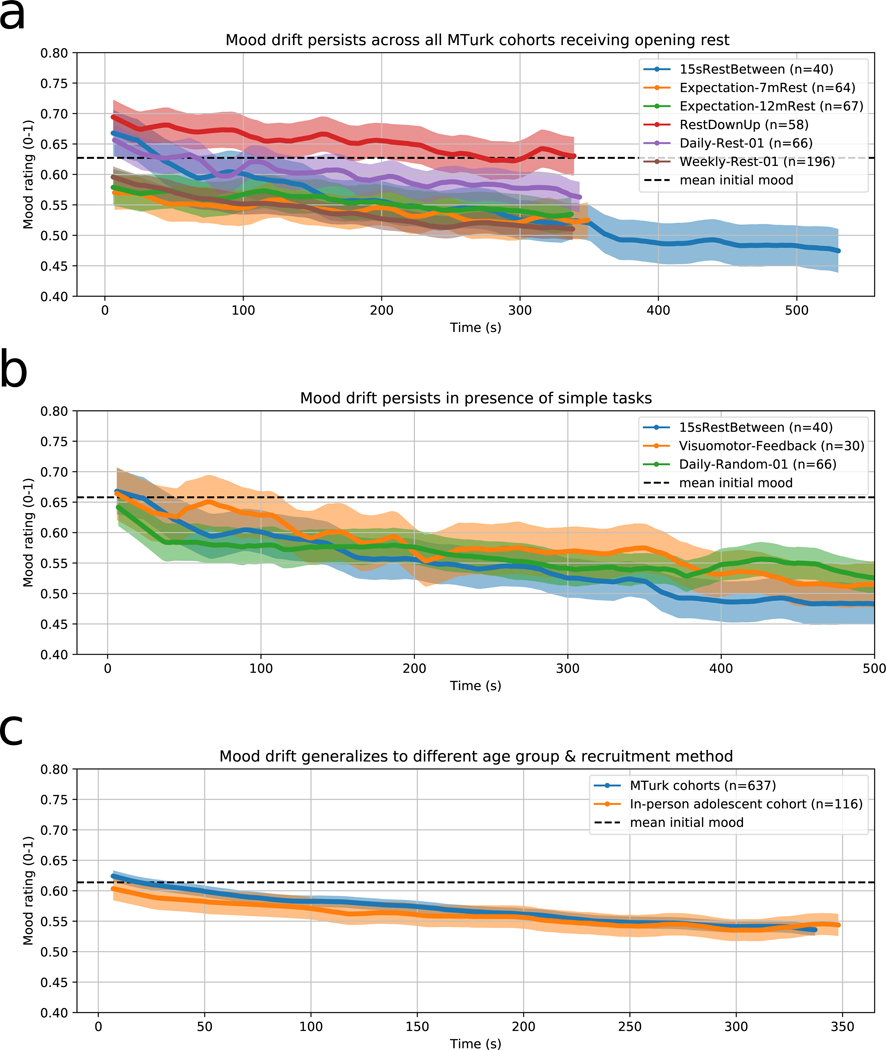
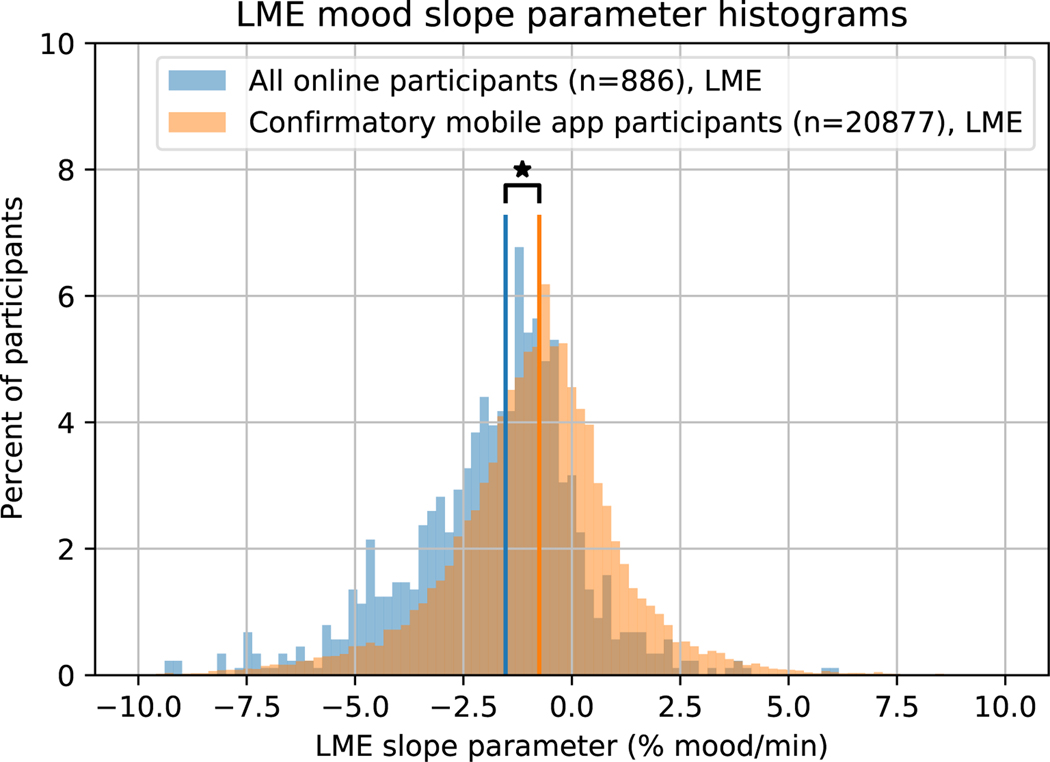
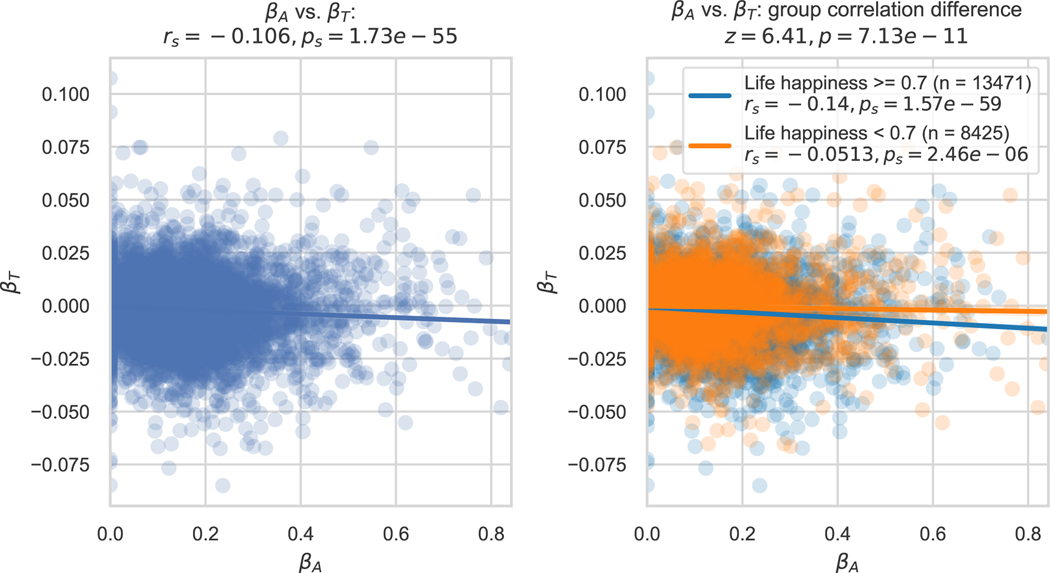
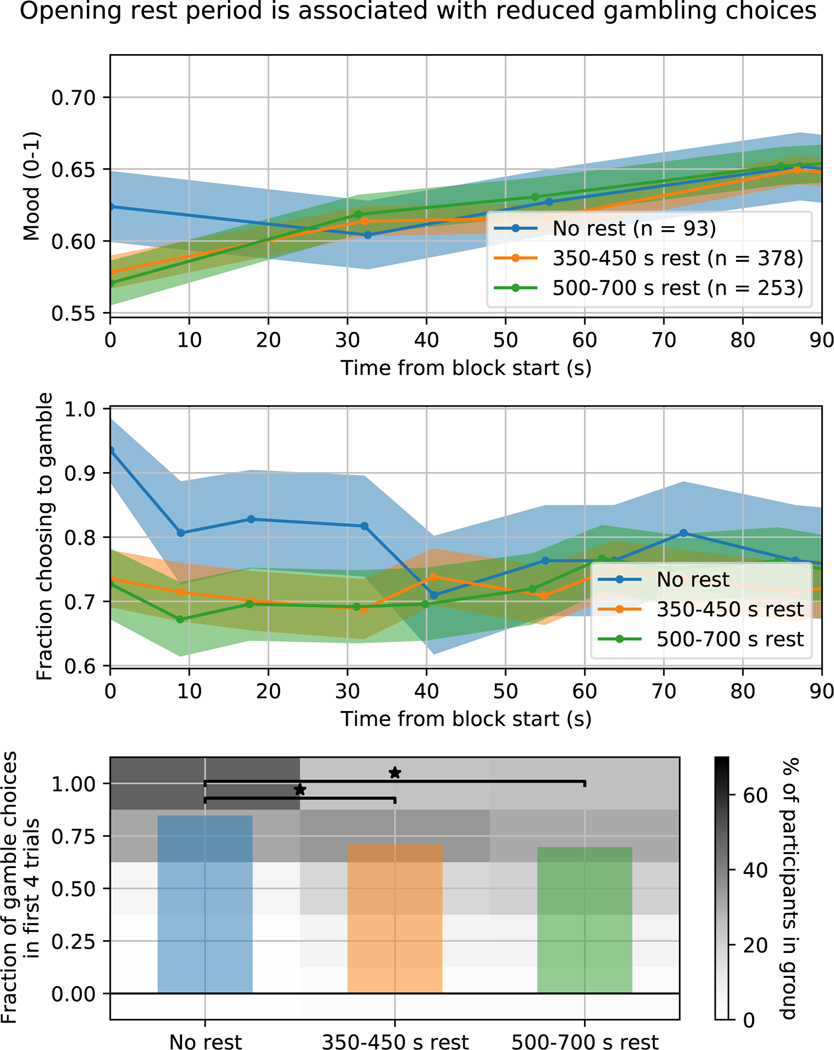
Does our mood change as time passes? This question is central to behavioural and affective science, yet it remains largely unexamined. To investigate, we intermixed subjective momentary mood ratings into repetitive psychology paradigms. Here we demonstrate that task and rest periods lowered participants' mood, an effect we call 'Mood Drift Over Time'. This finding was replicated in 19 cohorts totalling 28,482 adult and adolescent participants. The drift was relatively large (-13.8% after 7.3 min of rest, Cohen's d = 0.574) and was consistent across cohorts. Behaviour was also impacted: participants were less likely to gamble in a task that followed a rest period. Importantly, the drift slope was inversely related to reward sensitivity. We show that accounting for time using a linear term significantly improves the fit of a computational model of mood. Our work provides conceptual and methodological reasons for researchers to account for time's effects when studying mood and behaviour.


Conflict of interest statement

Competing Interests

The authors declare no competing interests.

Figures

Extended Data Fig. 1
Mood rating frequency does not affect mood drift slope Mean ± STE mood rating at each time in the 4 cohorts with 60 s, 30 s, 15 s, and 7.5 s of rest between mood ratings (cohorts 60sRestBetween, 30sRestBetween, 15sRestBetween, and 7.5sRestBetween, respectively). The magnitude of mood drift did not vary with the frequency of mood ratings.
Extended Data Fig. 2
Mood slope parameter distributions vary with analysis choice Histogram of the LME mood slope parameters for the online cohort (blue) and the confirmatory mobile app cohort (orange), along with the computational model time sensitivity parameter for the confirmatory mobile app cohort (green). Mobile app participants with outlier task completion times were excluded from the LME analysis (see Methods). Note that the use of LME modeling to analyze the mobile app data significantly lowered the distribution of slopes compared to when the computational model was used (median = −0.752 vs. −0.0408, IQR= 2.10 vs. 0.764 %mood/min, 2-sided Wilcoxon rank-sum test, W42771 = −54.2, p<0.001), but the LME slopes from the mobile app were still significantly greater than those of the online cohort (median = −1.53 vs. 0.752, IQR = 2.34 vs. 2.1 %mood/min, 2-sided Wilcoxon rank-sum test, W21761 = 14.5, p<0.001). Vertical lines represent group medians. Stars indicate p<0.05. P values were not corrected for multiple comparisons.
Extended Data Fig. 3
Sample fits of the computational model Sample fits of the computational model for three random subjects in the confirmatory mobile app cohort. SSE = sum squared error, a measure of goodness of fit to the training data. In the top plots, the red bars are in units of the left-hand y axis, and the blue bars are in units of the right-hand y axis.
Extended Data Fig. 4
Histogram of computational model parameters Histogram of computational model parameters across the 21,896 confirmatory mobile app subjects.
Extended Data Fig. 5
Mood drift stability over blocks, days, and weeks Stability of LME coefficients estimating the initial mood (top) and slope of mood over time (bottom) for each participant across rest periods one block apart (left), 1 day apart (middle), and 2 weeks apart (right). ICC denotes the intra-class correlation coefficient for each comparison. P values shown are one-sided (since ICC values are expected to be positive) with no correction for multiple comparisons.
Extended Data Fig. 6
Relationship between mood drift and depression risk Relationship between mood drift and depression risk. (a) Mood ratings over time of online participants at risk of depression (defined as MFQ>12 or CES-D>16) vs. those not at risk for the 768 participants with at least 6 minutes of resting mood data (error bars are SEM). The dotted line represents the mean initial rating (mean of cohort means). (b) We fitted simple regressions of time versus mood within each individual and determined significance of the time term with BenjaminiHochberg false-discovery rate correction (2-sided α = 0.5, p<0.05) to better understand the relationship between depression risk and the change in mood over time. Depression risk is operationalised as score on the CES-D or MFQ divided by the threshold for depression risk on each measure (16 and 12 respectively). The line is a linear best fit, and the patch shows the 95% confidence interval of this fit. (c) Proportion of individuals with or without risk of depression (i.e., depression risk >1 or <1) with positive (significantly greater than zero), non-significant (no evidence of a significant difference from zero), and negative (significantly less than 0) slopes of mood over time. 13 more individuals at risk of depression have a positive slope than the 35 expected based on the rates in individuals not at risk of depression, χ2(1,N=886)=14.57, p<0.001 (2-sided Pearson’s chi-squared statistic with no correction for multiple comparisons).
Extended Data Fig. 7
Mood drift’s relation to other computational model parameters Time sensitivity parameter βT vs. other parameters in the confirmatory mobile app cohort. Each dot is a participant (n=21,896). Each line is a linear best fit, and patches show the 95% confidence interval of this fit. rs denotes Spearman correlation coefficient. P values shown are 2-sided with no correction for multiple comparisons.
Extended Data Fig. 8
Initial mood parameter’s relation to life happiness Initial mood parameter vs. life happiness rating in the online cohort (left) and the confirmatory mobile app cohort (right). Life happiness ratings were always multiples of 0.1; small positive random values were added during plotting to reduce overlap between data points. Each dot is a participant (left: n=886, right: n=21,896). rs denotes Spearman correlation coefficient. P values shown are 2-sided with no correction for multiple comparisons.
Figure 1:
Figure 1:
One cycle (mood rating + task) of the administered to (A) online participants and (B) mobile app participants. After completing their first mood rating, participants completed one cycle of the rest, gambling, or visuomotor task, then completed another mood rating, and so on. In the case of the rest and visuomotor tasks, the cycle duration was determined by time. In the case of the gambling task, it was determined by the time taken to complete 2 or 3 (randomised) trials of the gambling task.
Figure 2:
Figure 2:
The timecourse of mood drift is consistently present across many cohorts and task modulations. These plots each show the mean timecourse of mood across participants in various online cohorts for the first block of the task. Each participant’s mood between ratings was linearly interpolated before averaging across participants. The shading around each line represents the standard error of the mean. Each name in the legend corresponds to a cohort completing a slightly different task (Extended Data Table 1). Mean initial mood refers to the mean of cohort means, not the mean of subject means. (a) Mean timecourse of mood ratings during an opening rest period in all Amazon Mechanical Turk (MTurk) cohorts that received it. Mood drift was discovered in one cohort (blue line) and replicated in five independent naive cohorts. (b) Mood drift was observed not only in rest periods (blue), but also in a simple task requiring action and giving feedback (orange), and in a random gambling task with 0-mean reward prediction errors and winnings (green). (c) Mood drift was observed both in adults recruited on MTurk (combining across all MTurk participants that received opening rest or visuomotor task periods) (blue) and in adolescents recruited in person (orange).
Figure 3:
Figure 3:
Individual subject LME slope parameters for online participants (blue) and mobile app participants (orange). The online participants had slopes below zero on average (Mean ± SE = −1.89 ± 0.185 %mood/min, t864 = −10.3, p < 0.001), as did the mobile app participants (Mean ± SE = −0.881 ± 0.0613 %mood/min, t22804 = −14.4, p < 0.001). Mood drift was significantly less negative in the mobile app participants (median=−0.752, IQR=2.10 %mood/min) than in the online participants (median=−1.53, IQR=2.34 %mood/min, 2-sided Wilcoxon rank-sum test, W21761 = −14.5, p < 0.001). Vertical lines represent group medians. Stars indicate p < 0.05.]
Figure 4:
Figure 4:
Individual differences in sensitivity to the passage of time relate to other individual differences in the mobile app cohort. The computational model’s time sensitivity parameter βT for each participant in the mobile app cohort is plotted against that participant’s reward sensitivity parameter βA (left). rs and ps denote Spearman correlation coefficient and corresponding P value. When grouped by life happiness, participants with happiness at or above the median had a stronger βTβA anticorrelation than participants with happiness below the median (right). Each dot is a participant (n=21,896). Each line is a linear best fit, and patches show the 95% confidence interval of this fit. The group difference in Spearman correlations was statistically confirmed using a z statistic. P values shown are 2-sided with no correction for multiple comparisons.
Figure 5:
Figure 5:
Rest periods decreased the likelihood of choosing to gamble in the first 4 trials after rest ended. Top: mean ± standard error mood ratings across participants in their first block of (positive closed-loop) gambling preceded by different rest period durations. Middle: fraction of participants in each group that chose to gamble on each trial of this first gambling block (mean ± 95 percent confidence intervals derived from a binomial distribution). Bottom: bars show mean across participants of the fraction of the first 4 trials of this first gambling block that participants chose to gamble. Histogram shows the distribution of choices (i.e., to gamble on 0, 1, 2, 3, or 4 trials) within each group. Stars indicate that a pair of groups was significantly different (2-sided Wilcoxon rank-sum test, no-rest vs. short-rest: W469 = 4.85, p < 0.001; no-rest vs long-rest: W344 = 4.79, p < 0.001; both < 0.05/3 controlling for multiple comparisons). Sample sizes are: No rest group: n = 93 participants, 350–450 s rest group: n = 378 participants, 500–700 s rest group: n = 253 participants).

References

    1. Penny WD, Friston KJ, Ashburner JT, Kiebel SJ & Nichols TE Statistical Parametric Mapping: The Analysis of Functional Brain Images (Elsevier Science, 2011).
    1. Keren H et al. The temporal representation of experience in subjective mood. eLife 10, 1–24 (2021). 10.7554/elife.62051. - DOI - PMC - PubMed
    1. Rutledge RB, Skandali N, Dayan P & Dolan RJ A computational and neural model of momentary subjective well-being. Proceedings of the National Academy of Sciences of the United States of America 111 (33), 12252–12257 (2014). 10.1073/pnas.1407535111. - DOI - PMC - PubMed
    1. Frijda N, Mesquita B, Sonnemans J & Goozen S The duration of affective phenomena or emotions, sentiments and passions, Vol. 1 187–225 (1991).
    1. Scherer KR & Wallbott HG Evidence for universality and cultural variation of differential emotion response patterning. Journal of Personality and Social Psychology 66 (2), 310–328 (1994). 10.1037//0022-3514.66.2.310. - DOI - PubMed

Publication types