. 2023 Mar;29(3):710-718.
doi: 10.1038/s41591-023-02223-9. Epub 2023 Feb 27.

The artificial sweetener erythritol and cardiovascular event risk

Affiliations

The artificial sweetener erythritol and cardiovascular event risk

Marco Witkowski et al. Nat Med. 2023 Mar.

Abstract

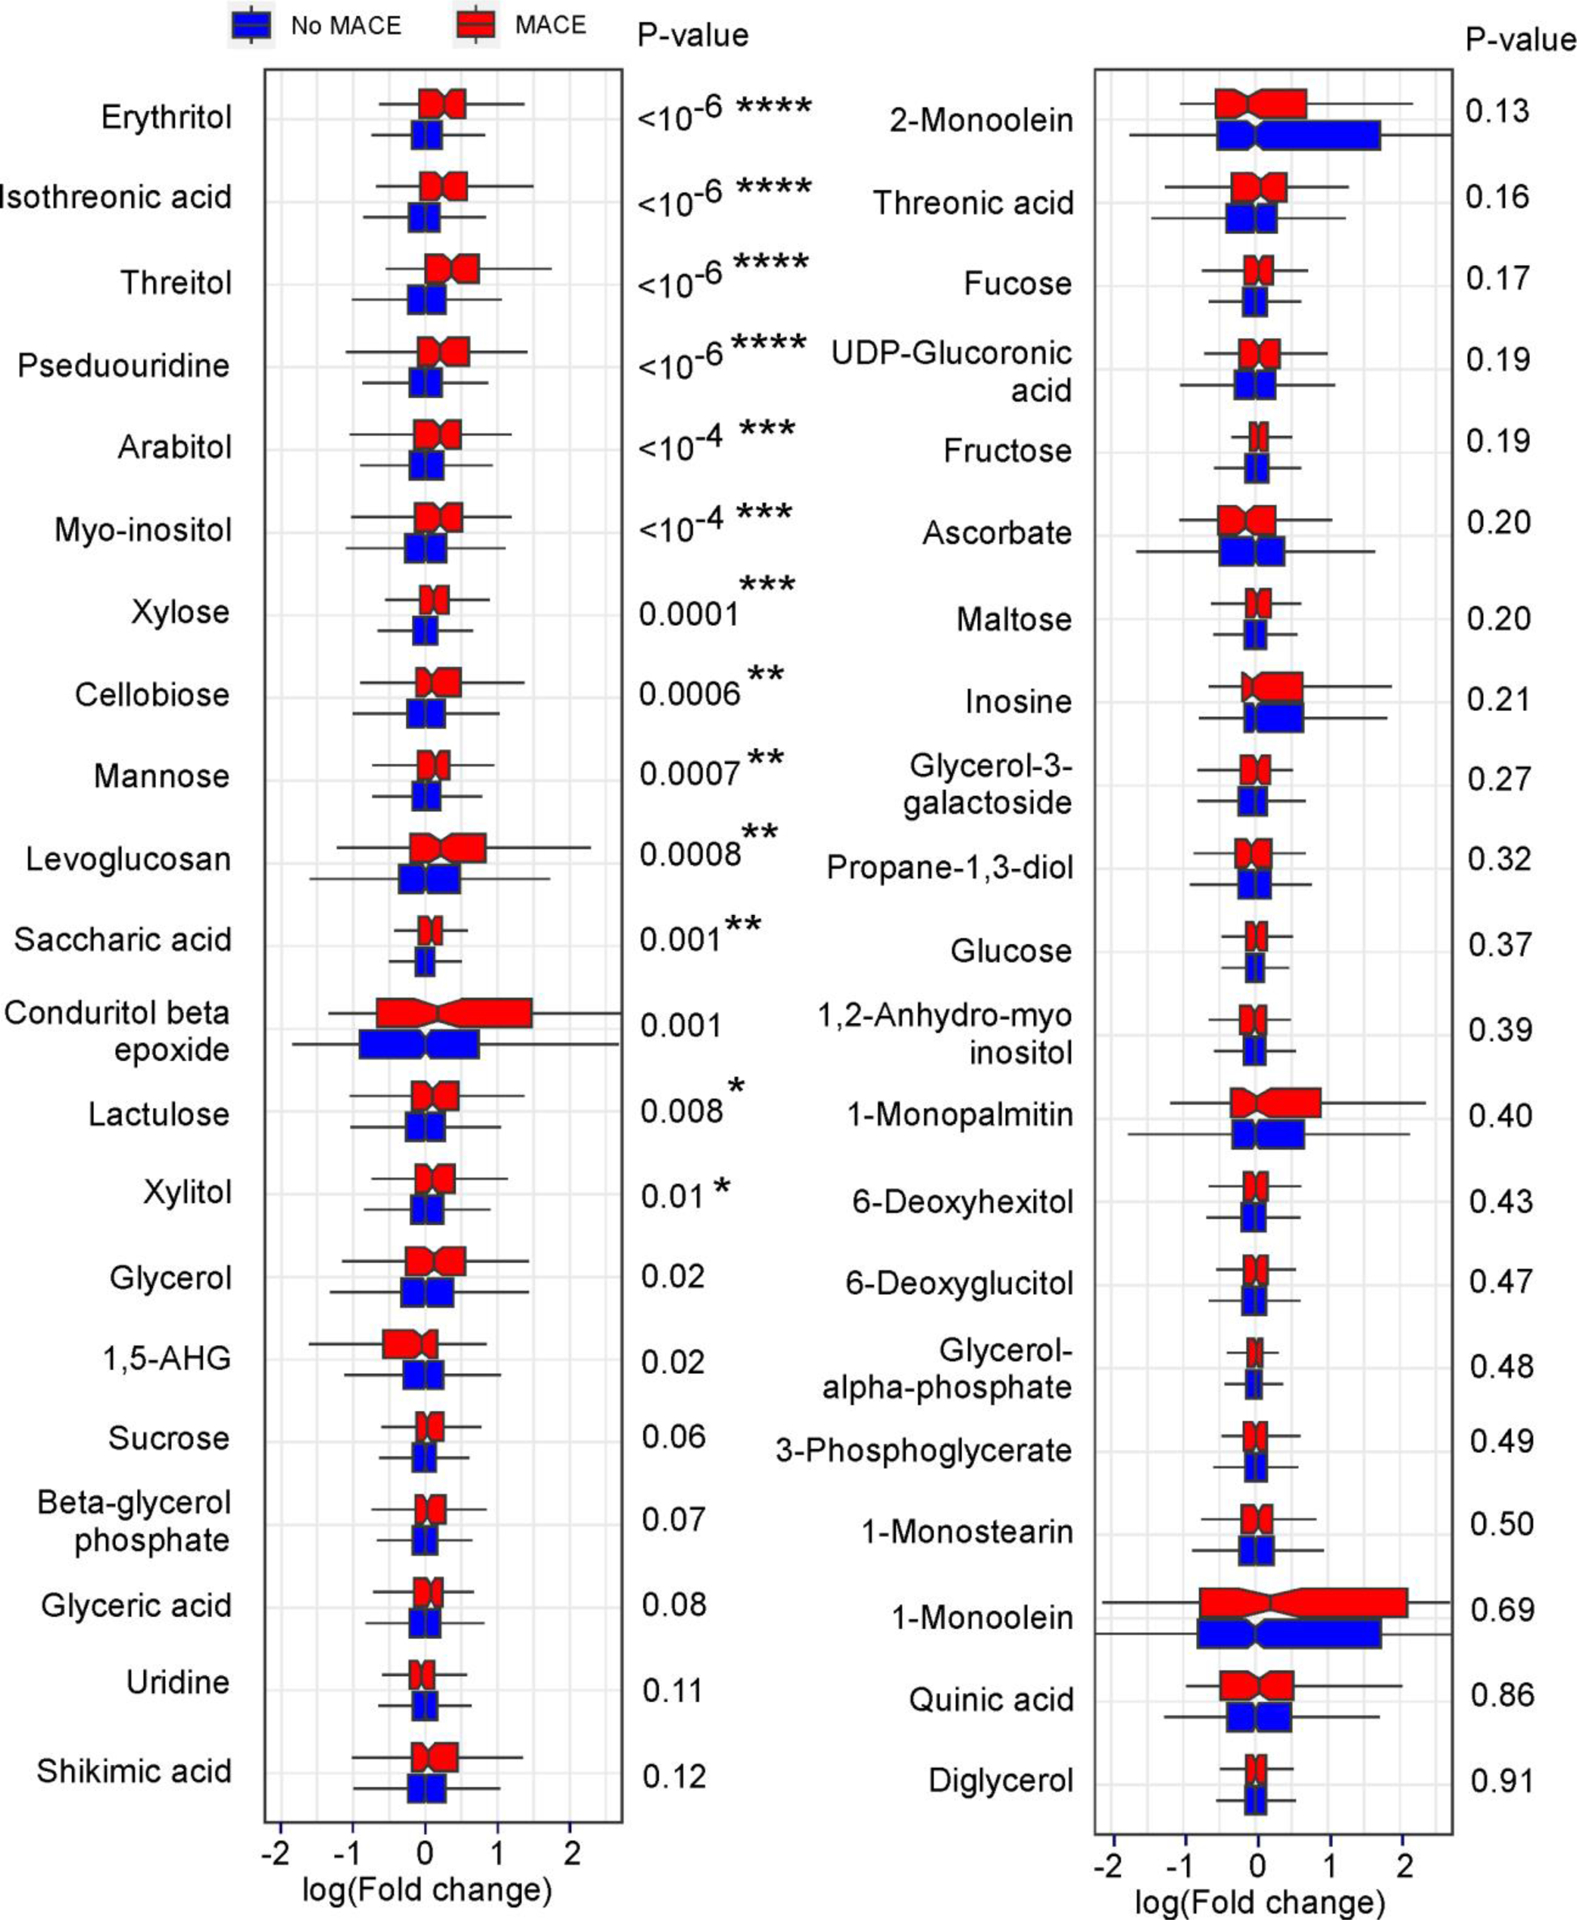
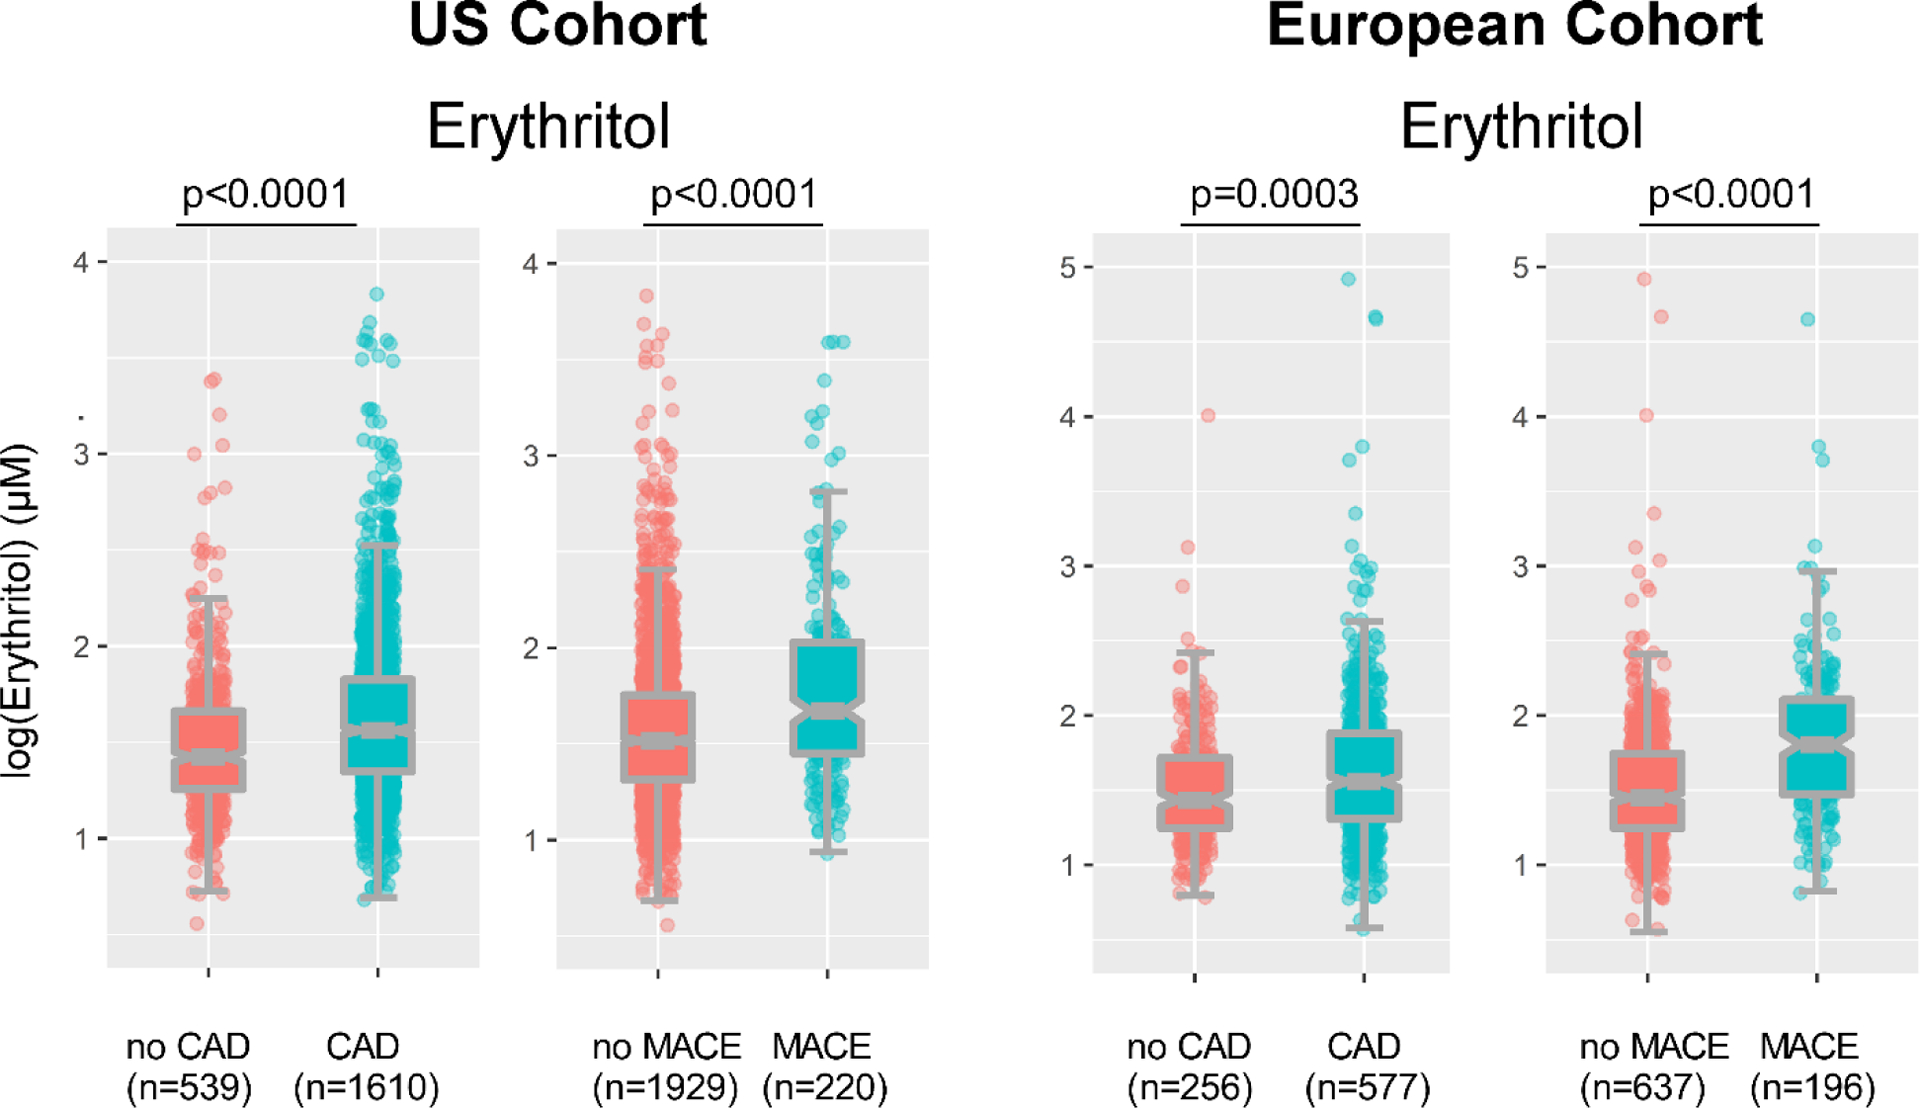
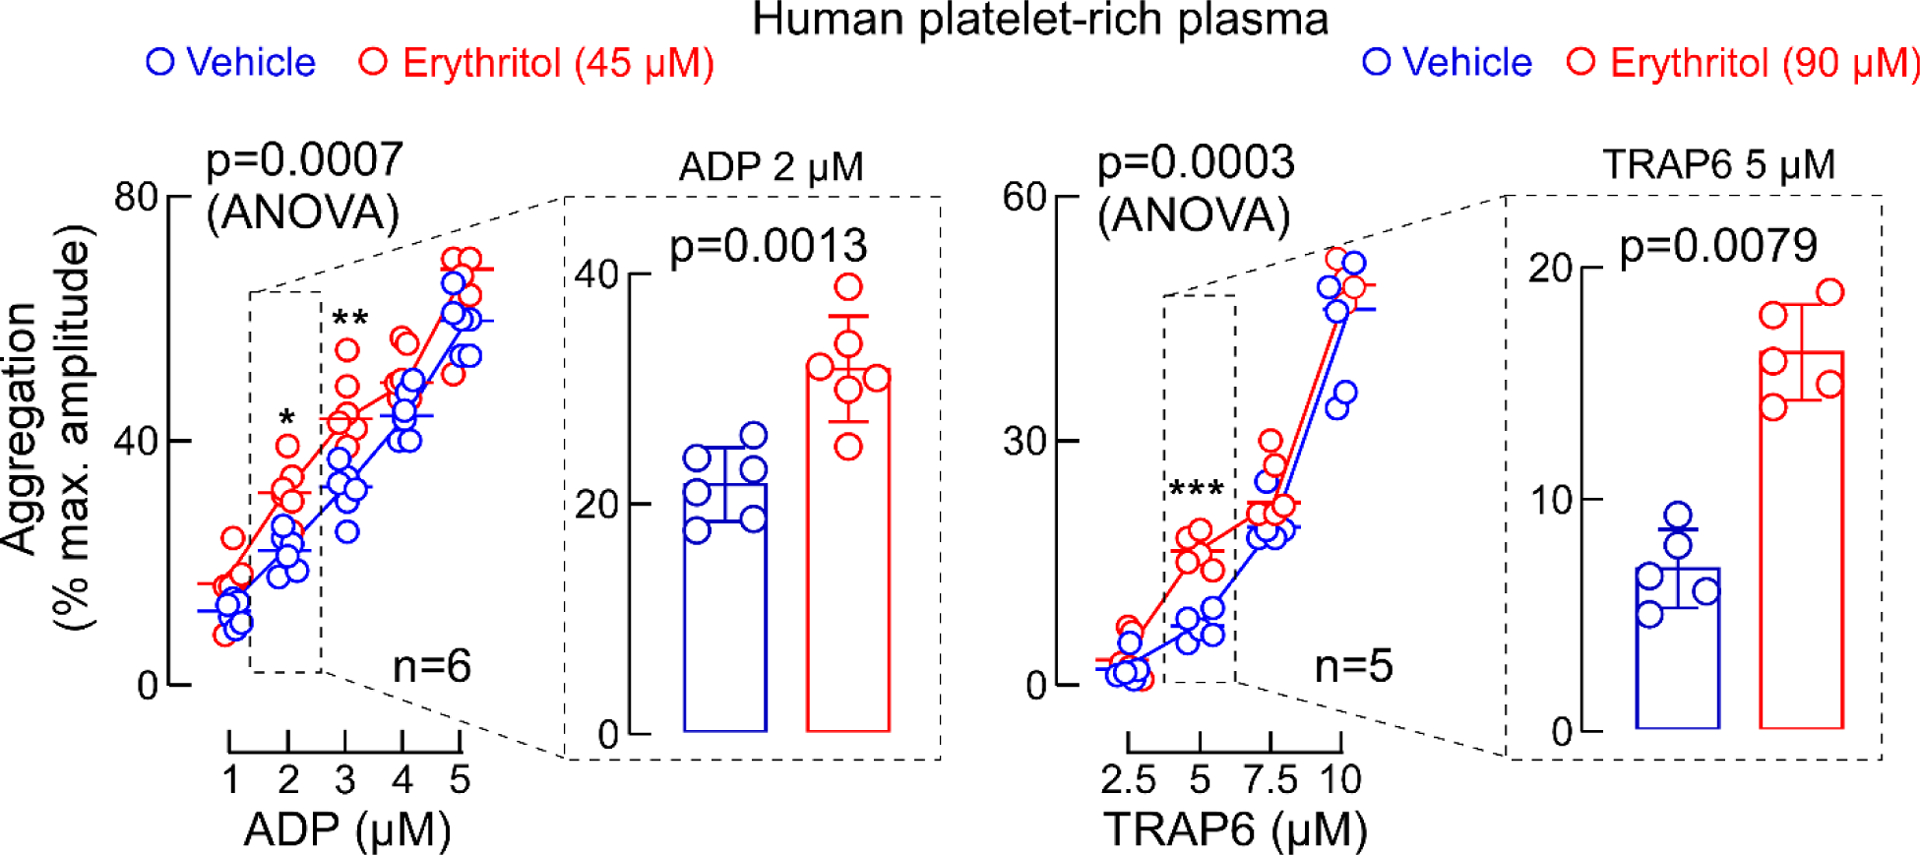
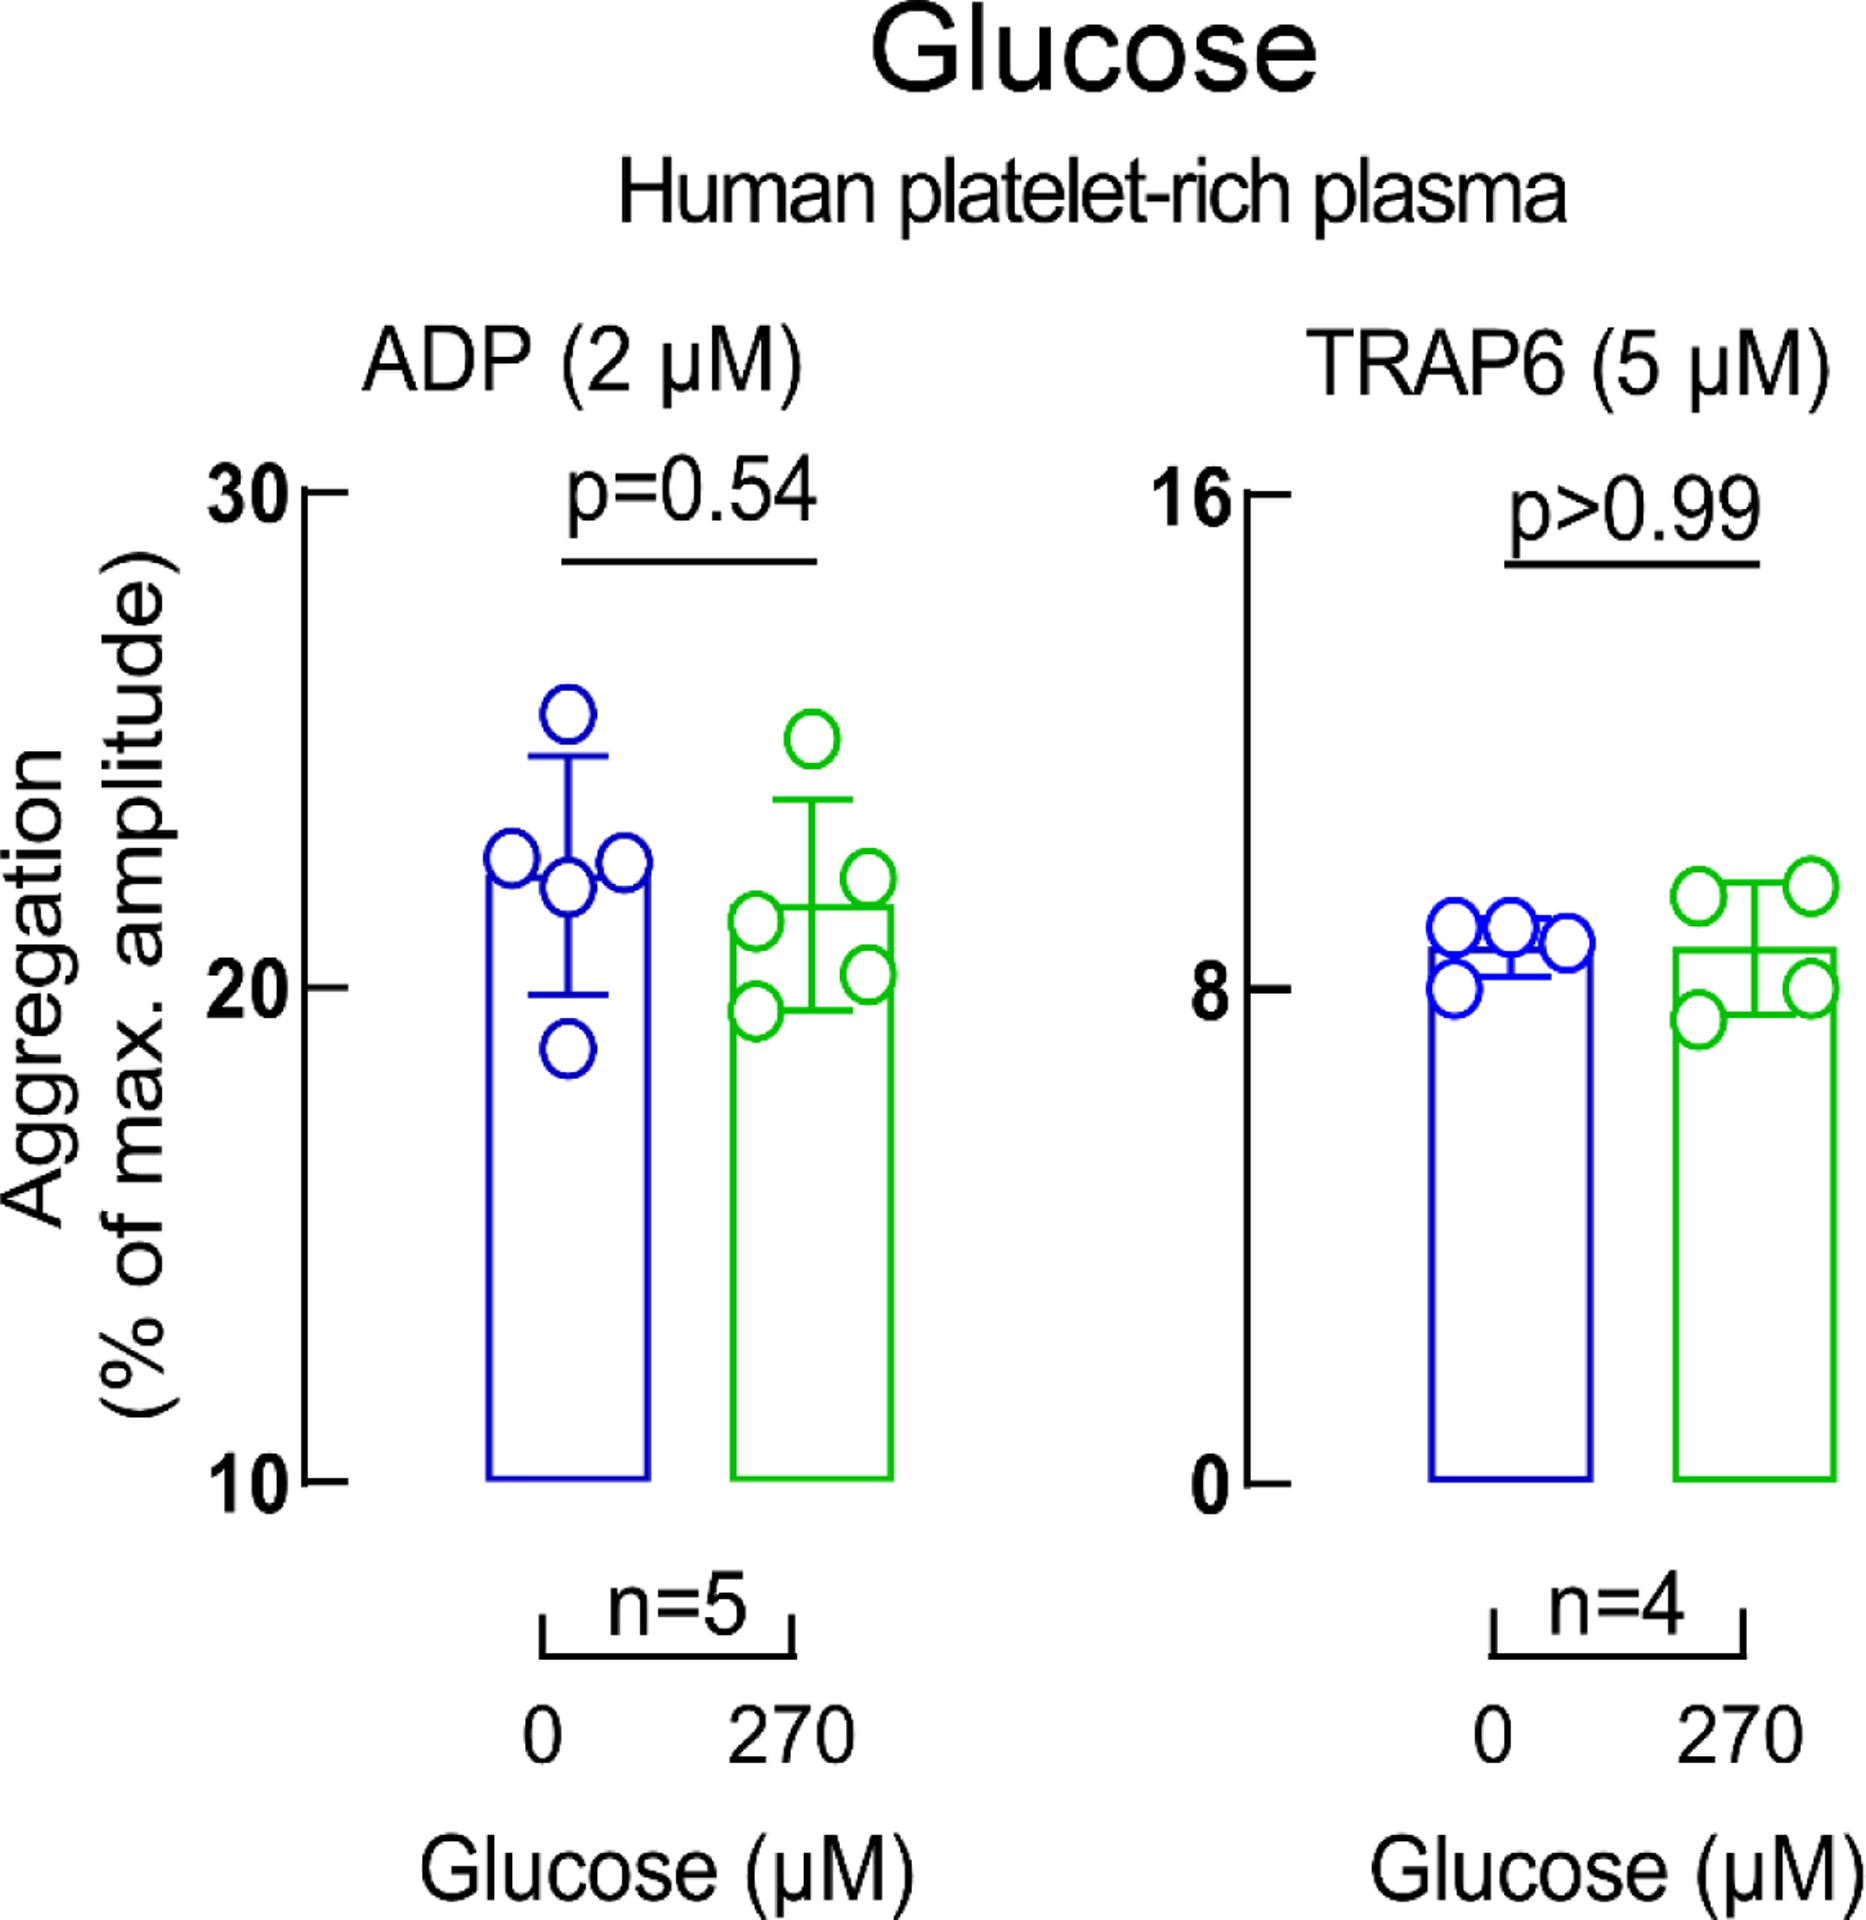
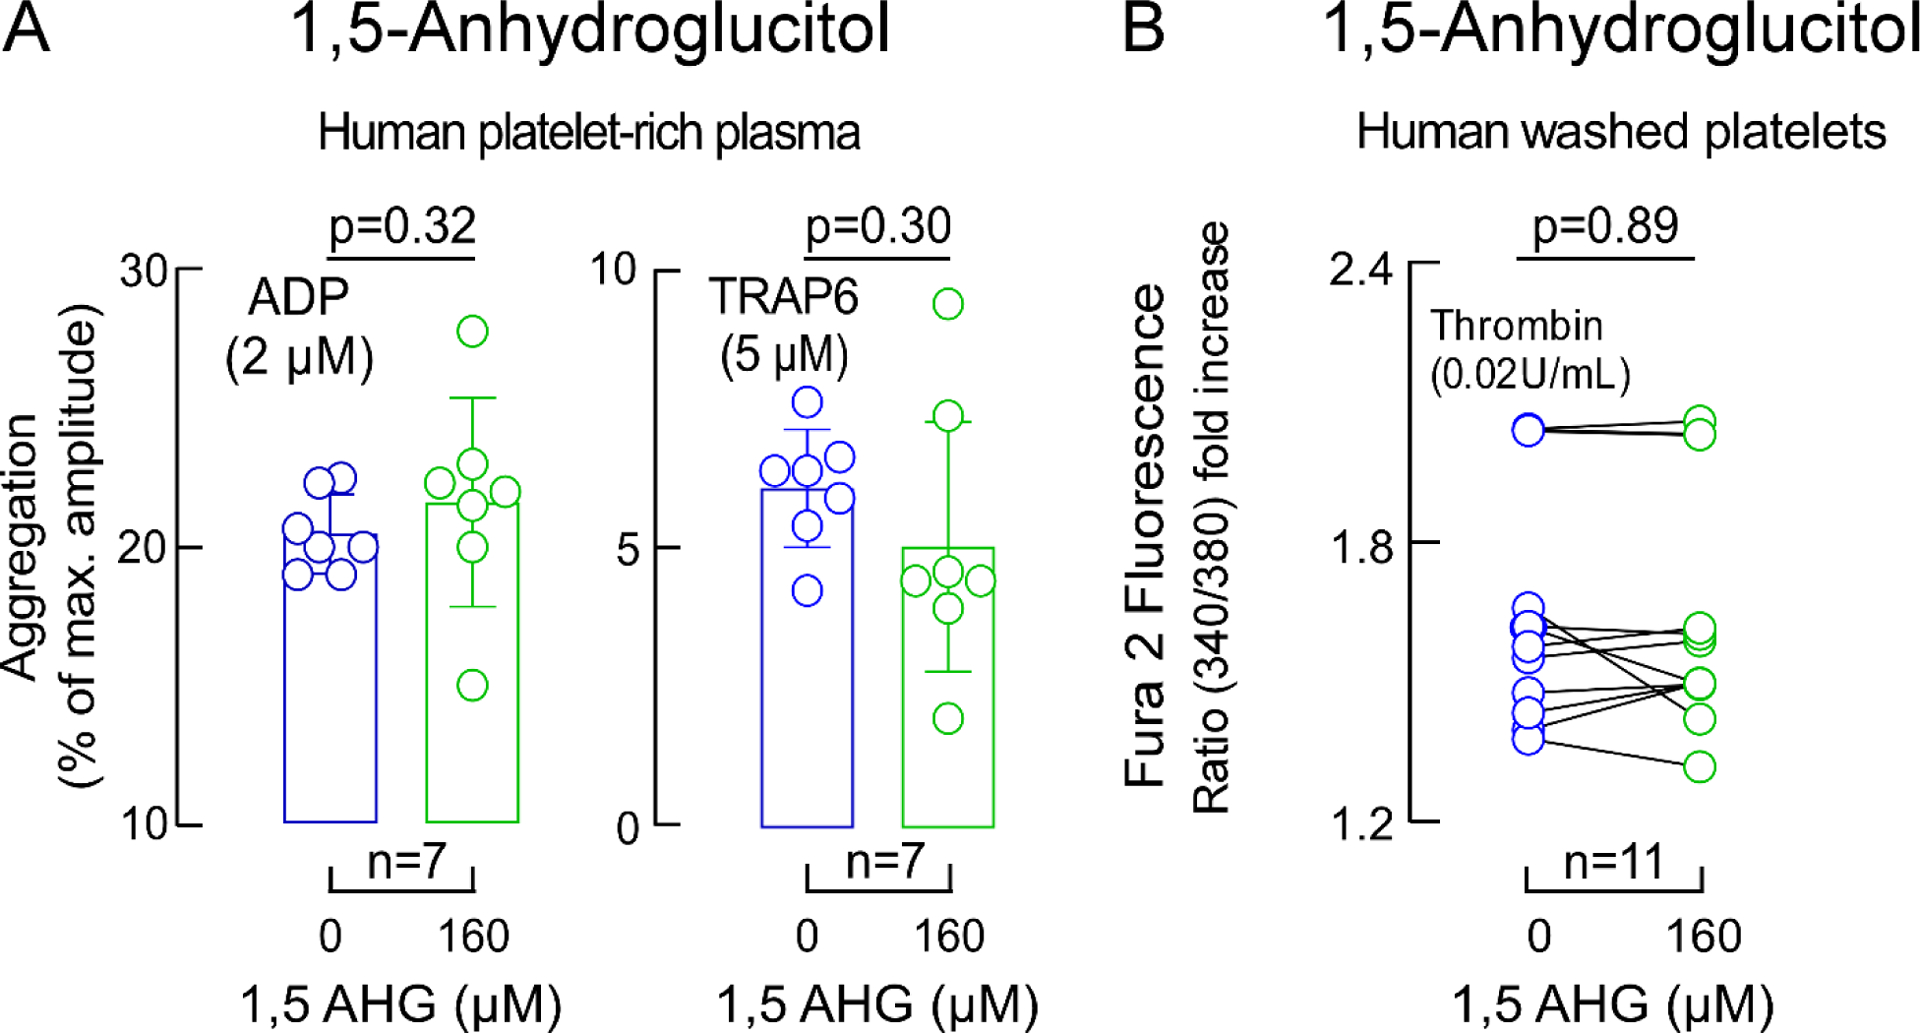
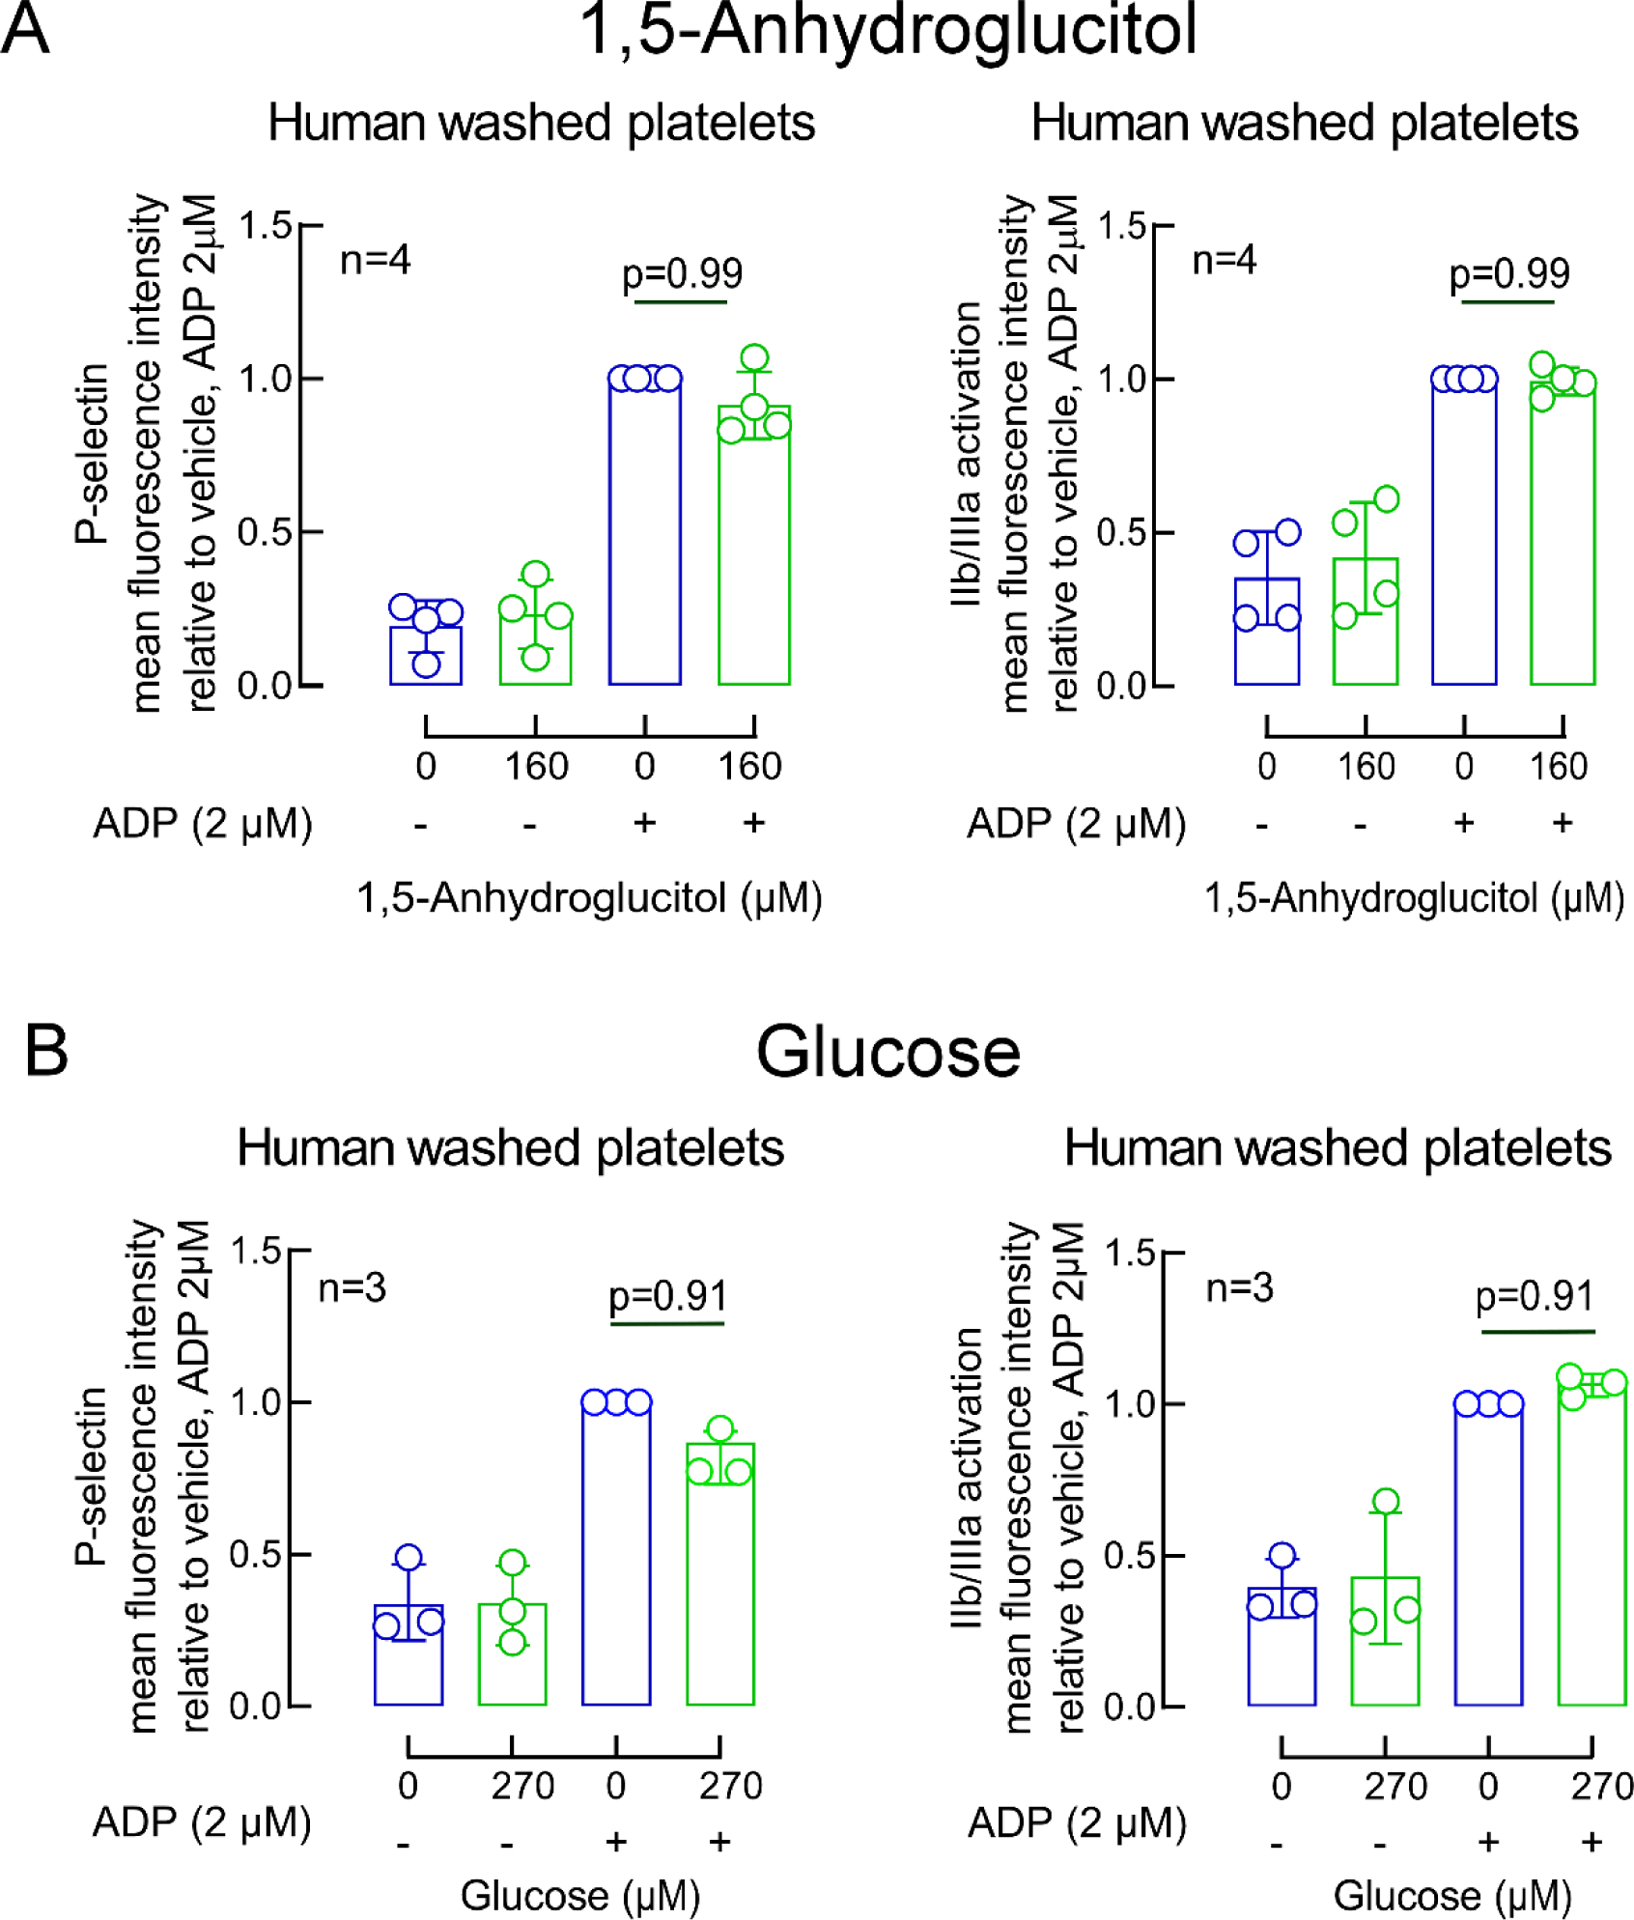
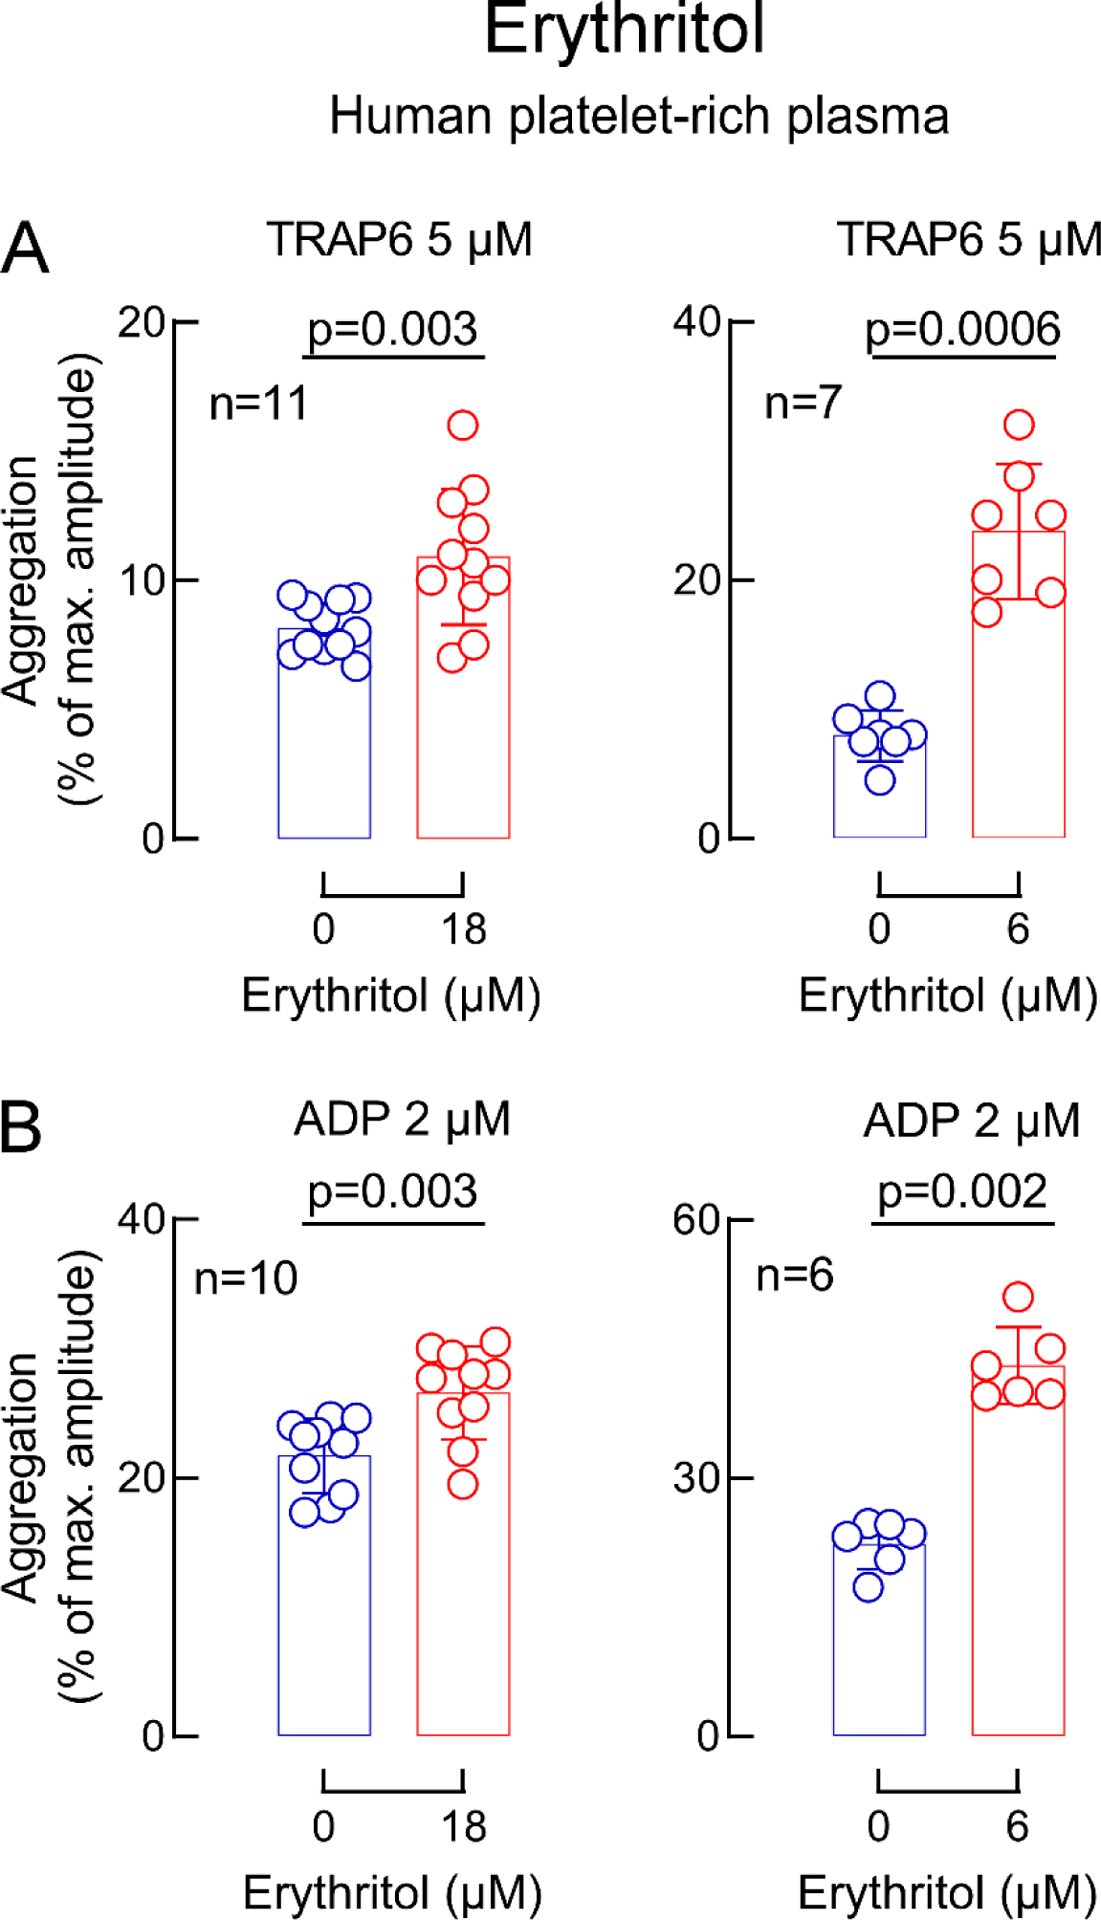
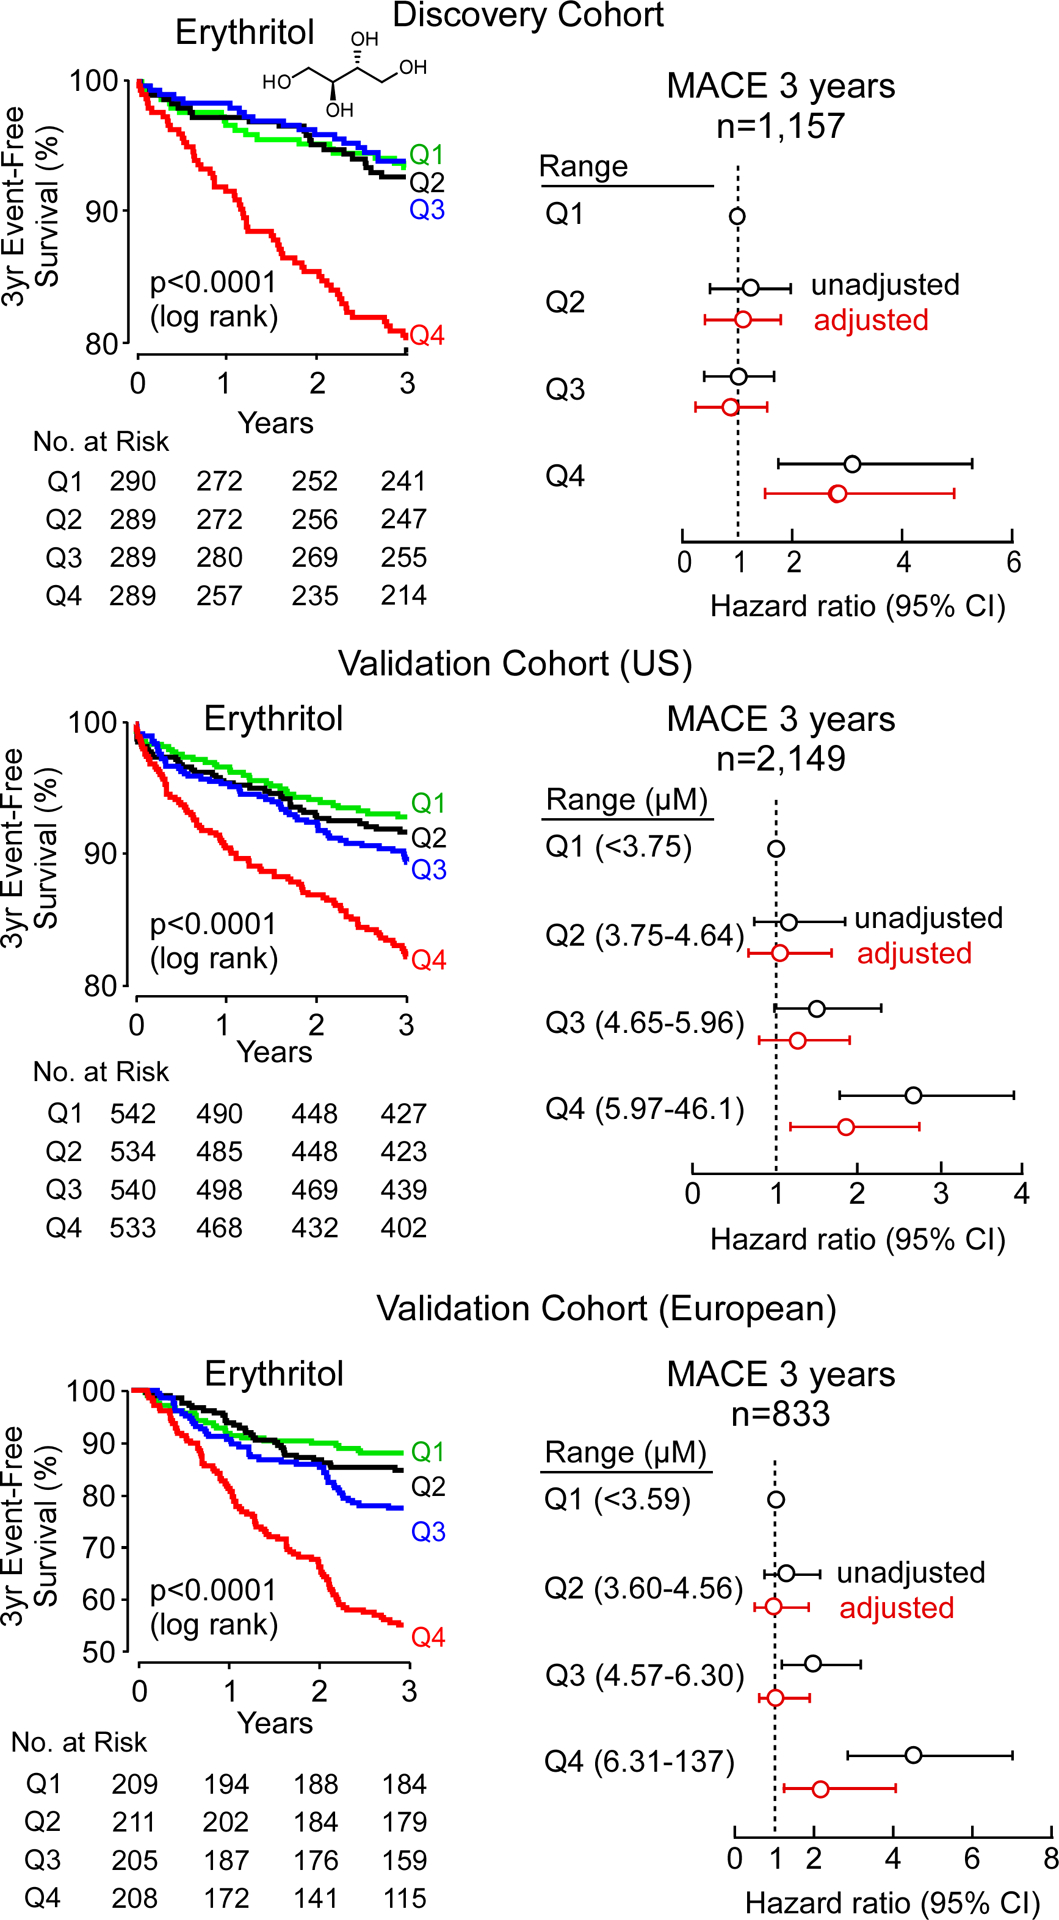
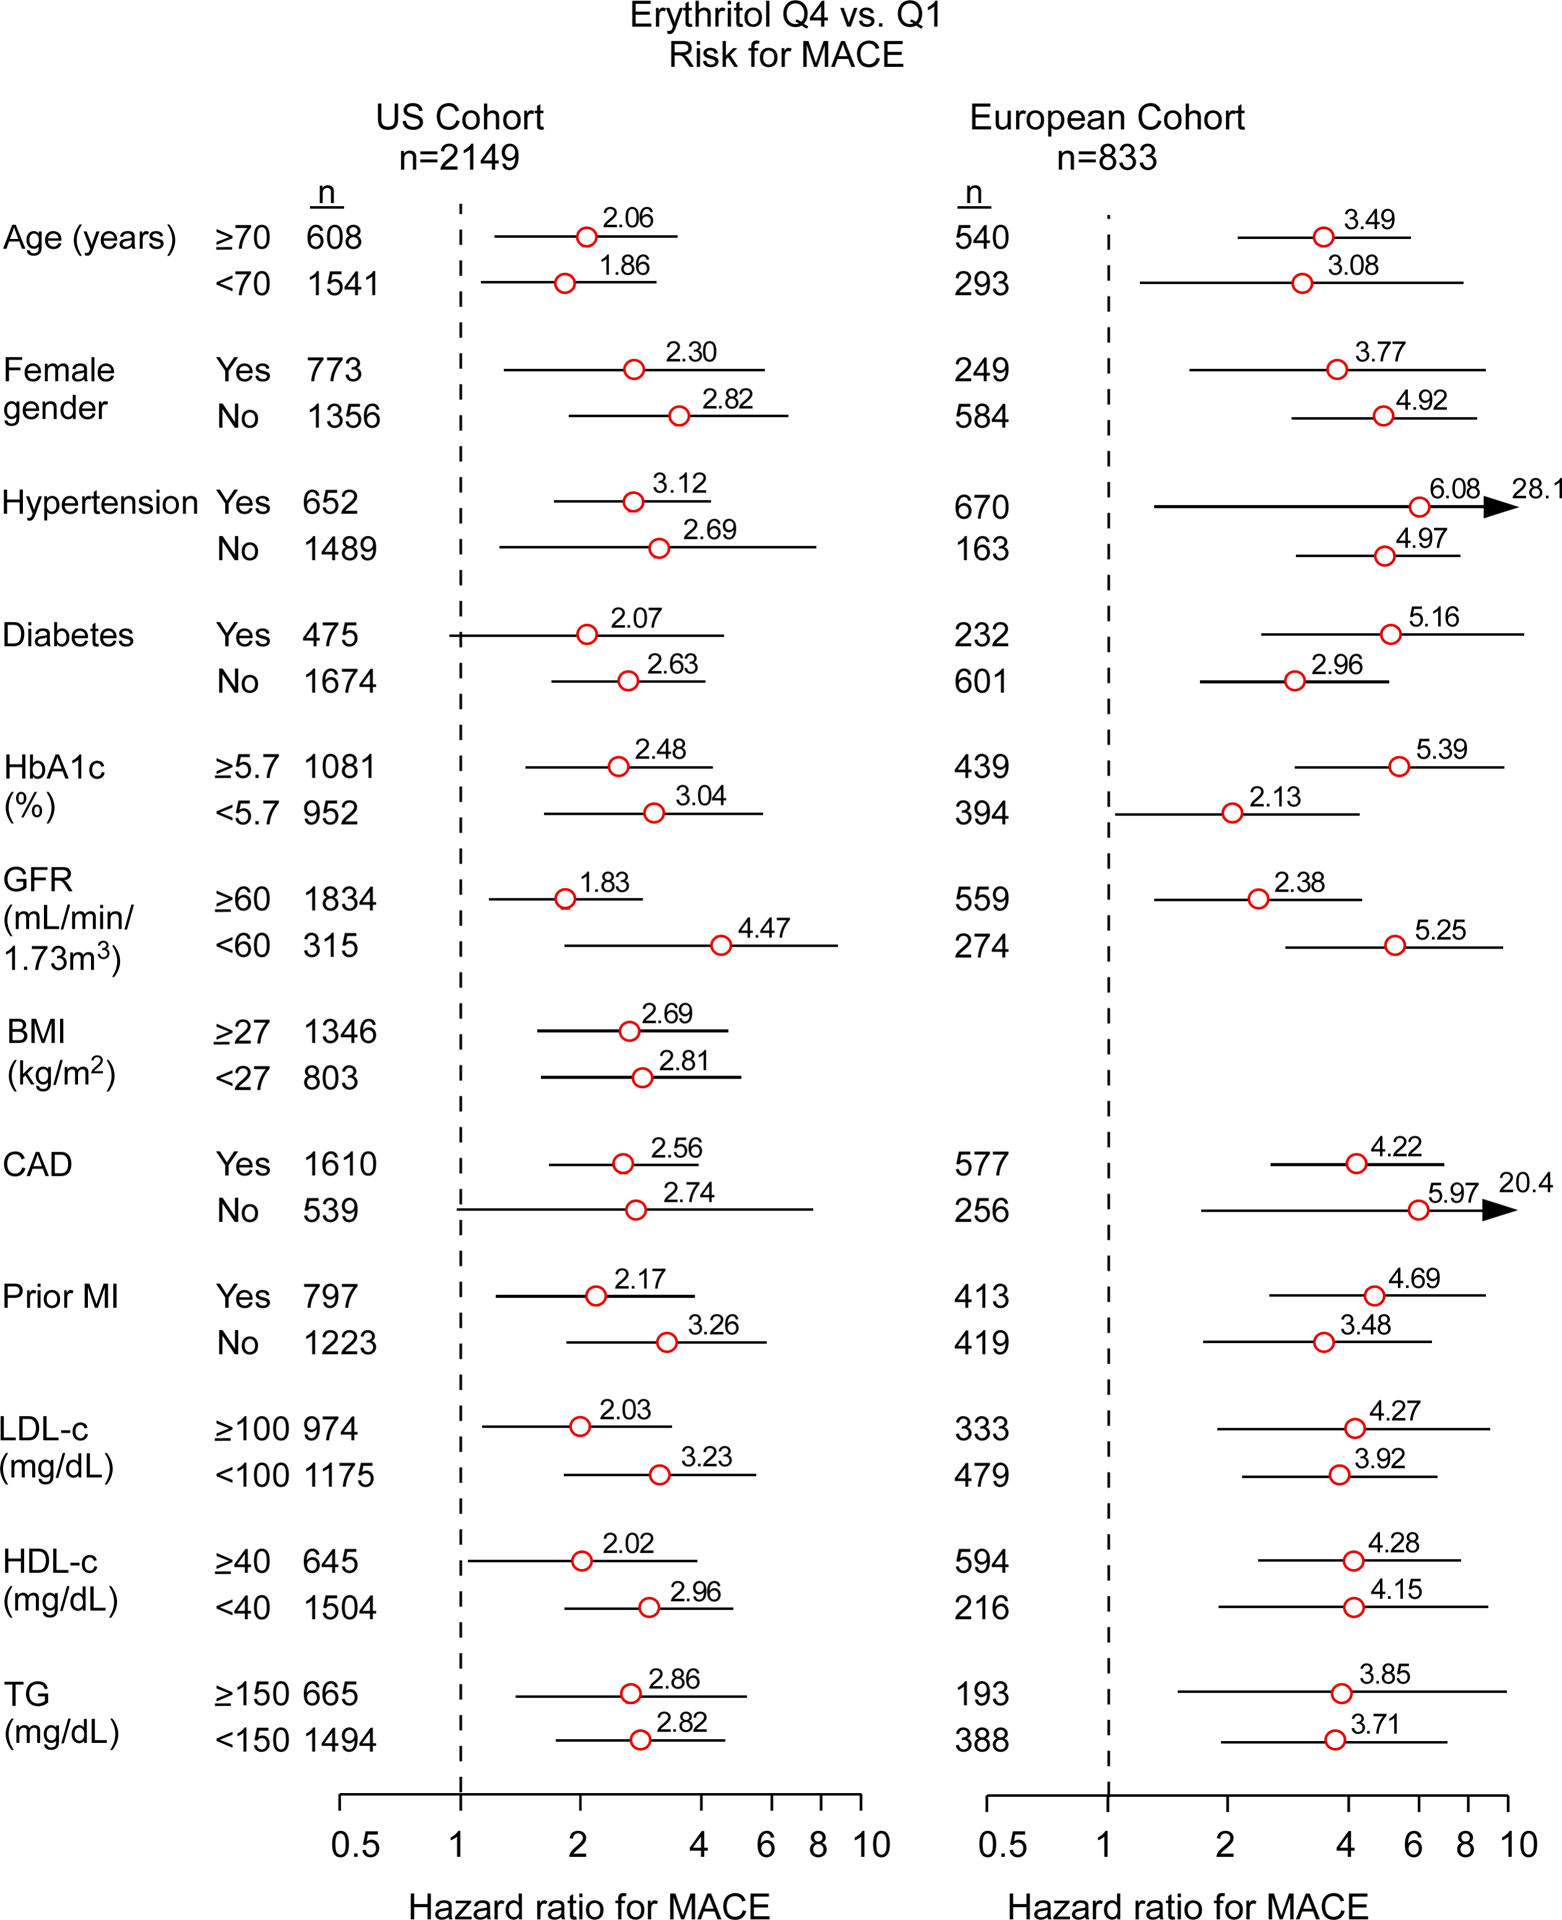
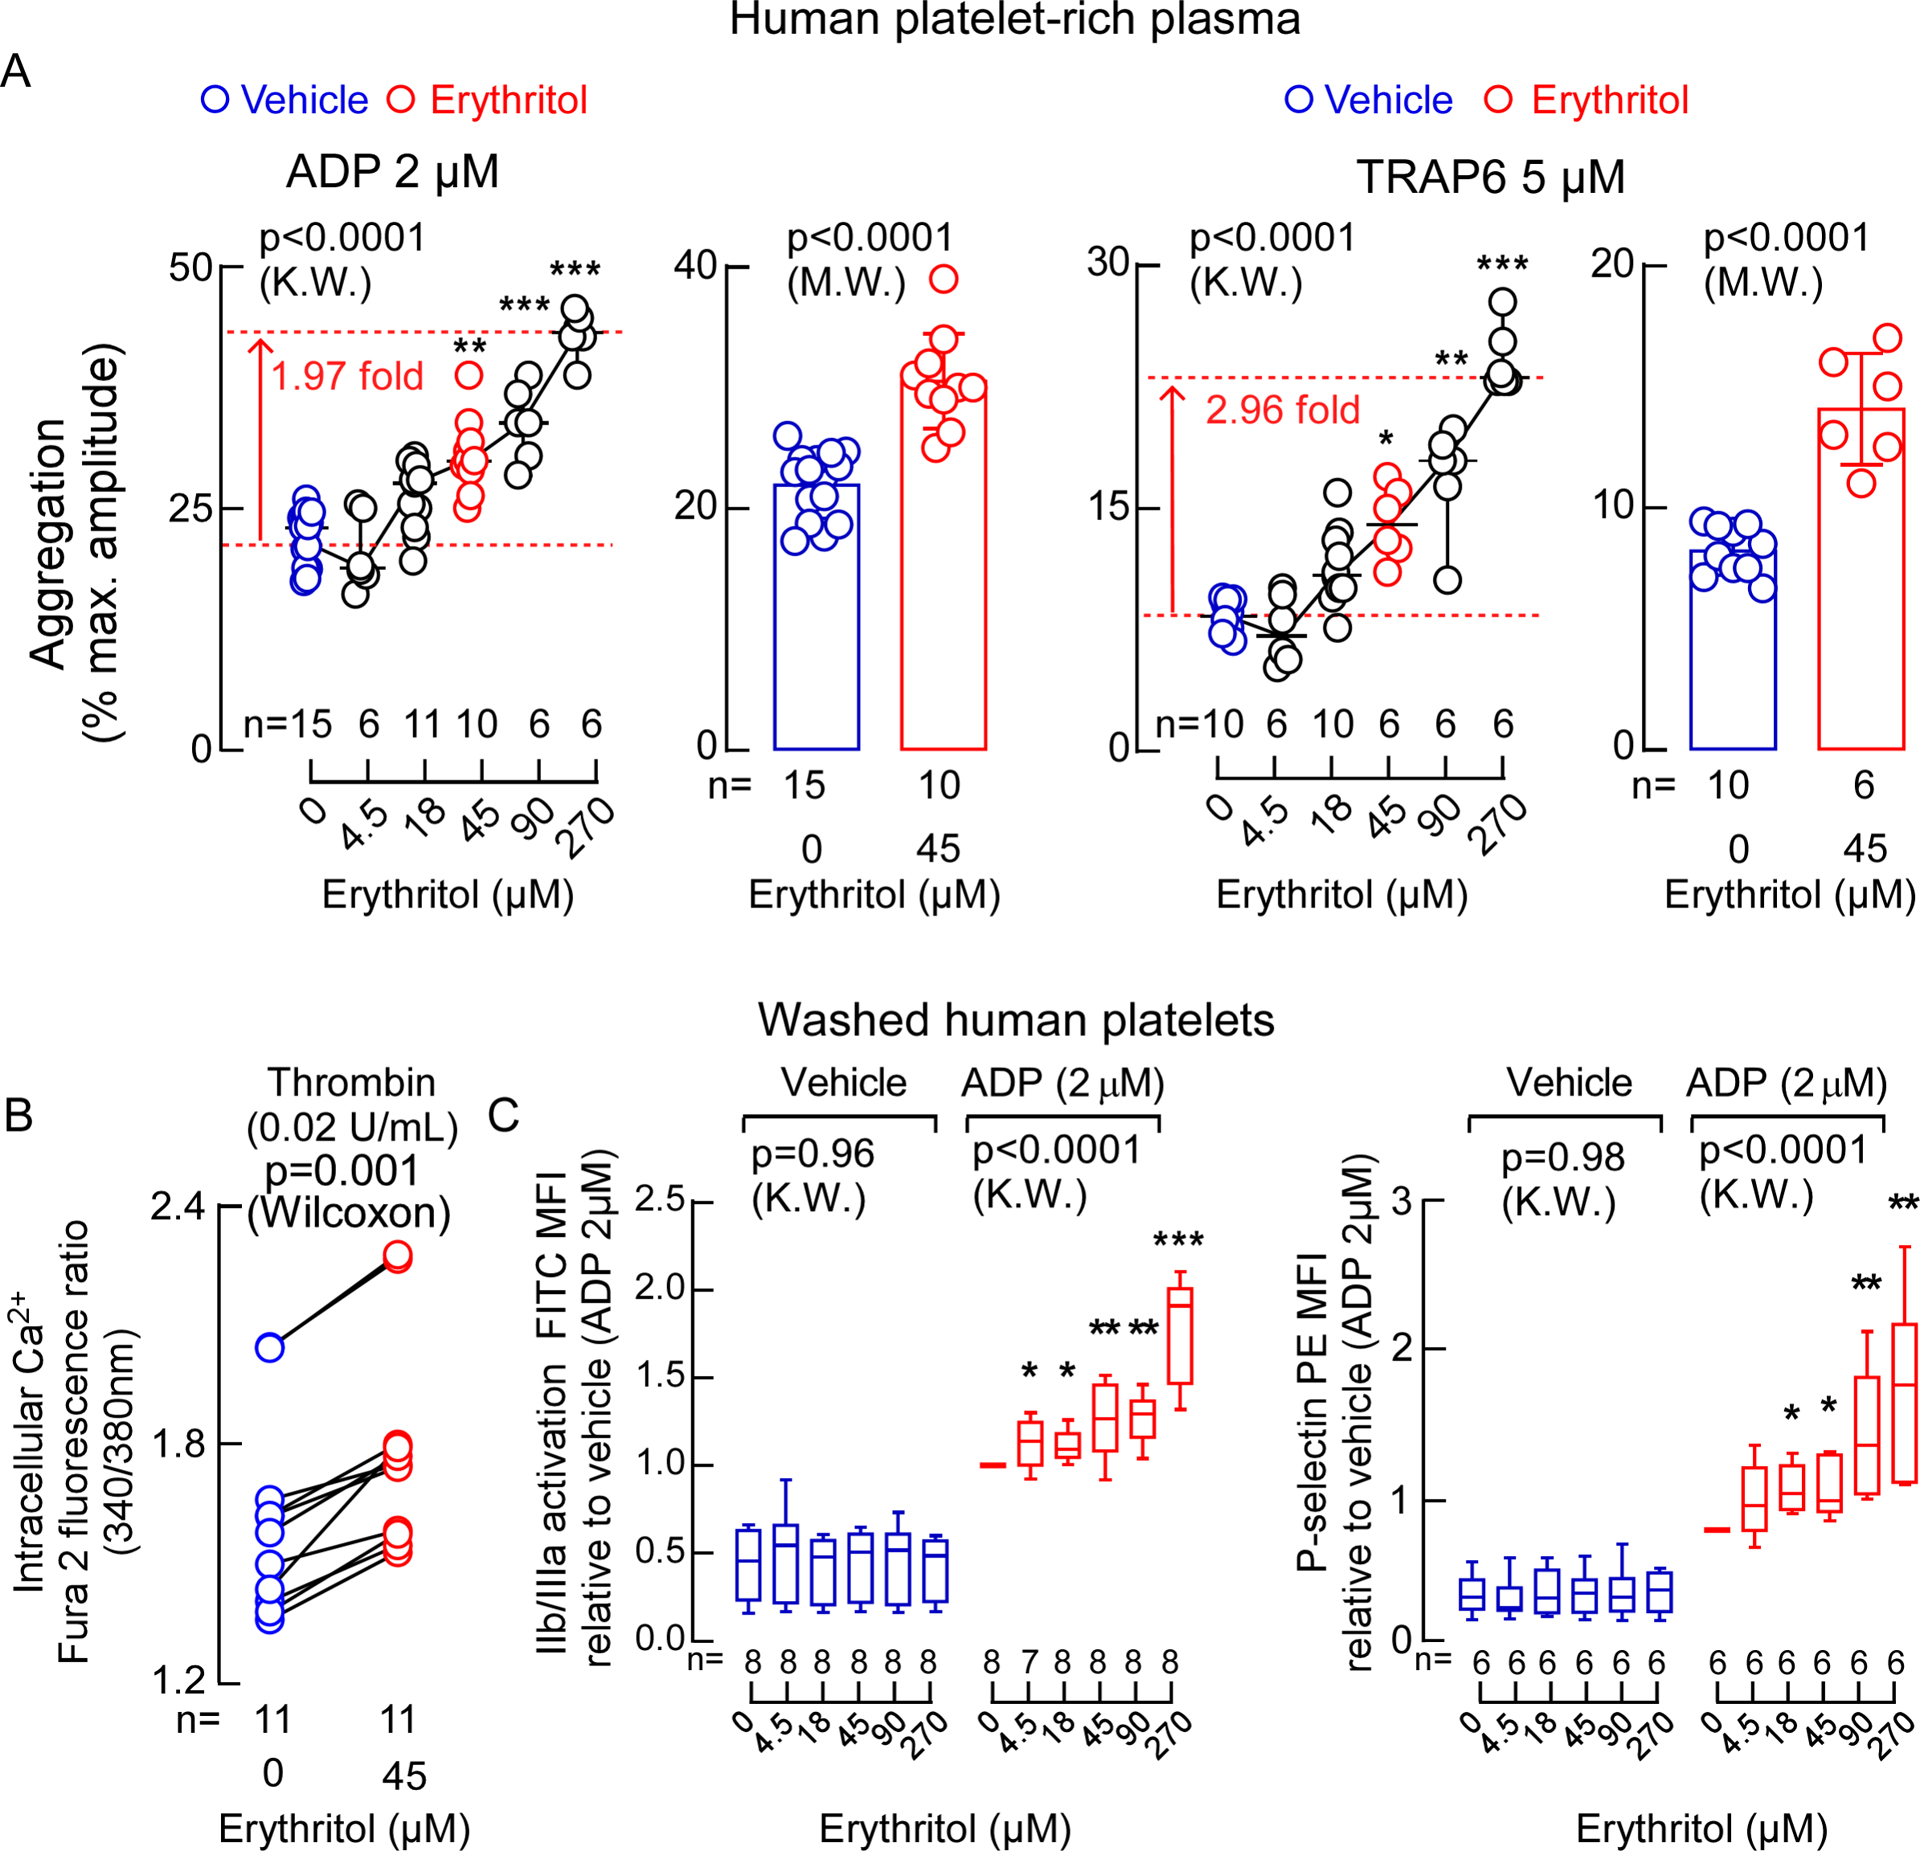
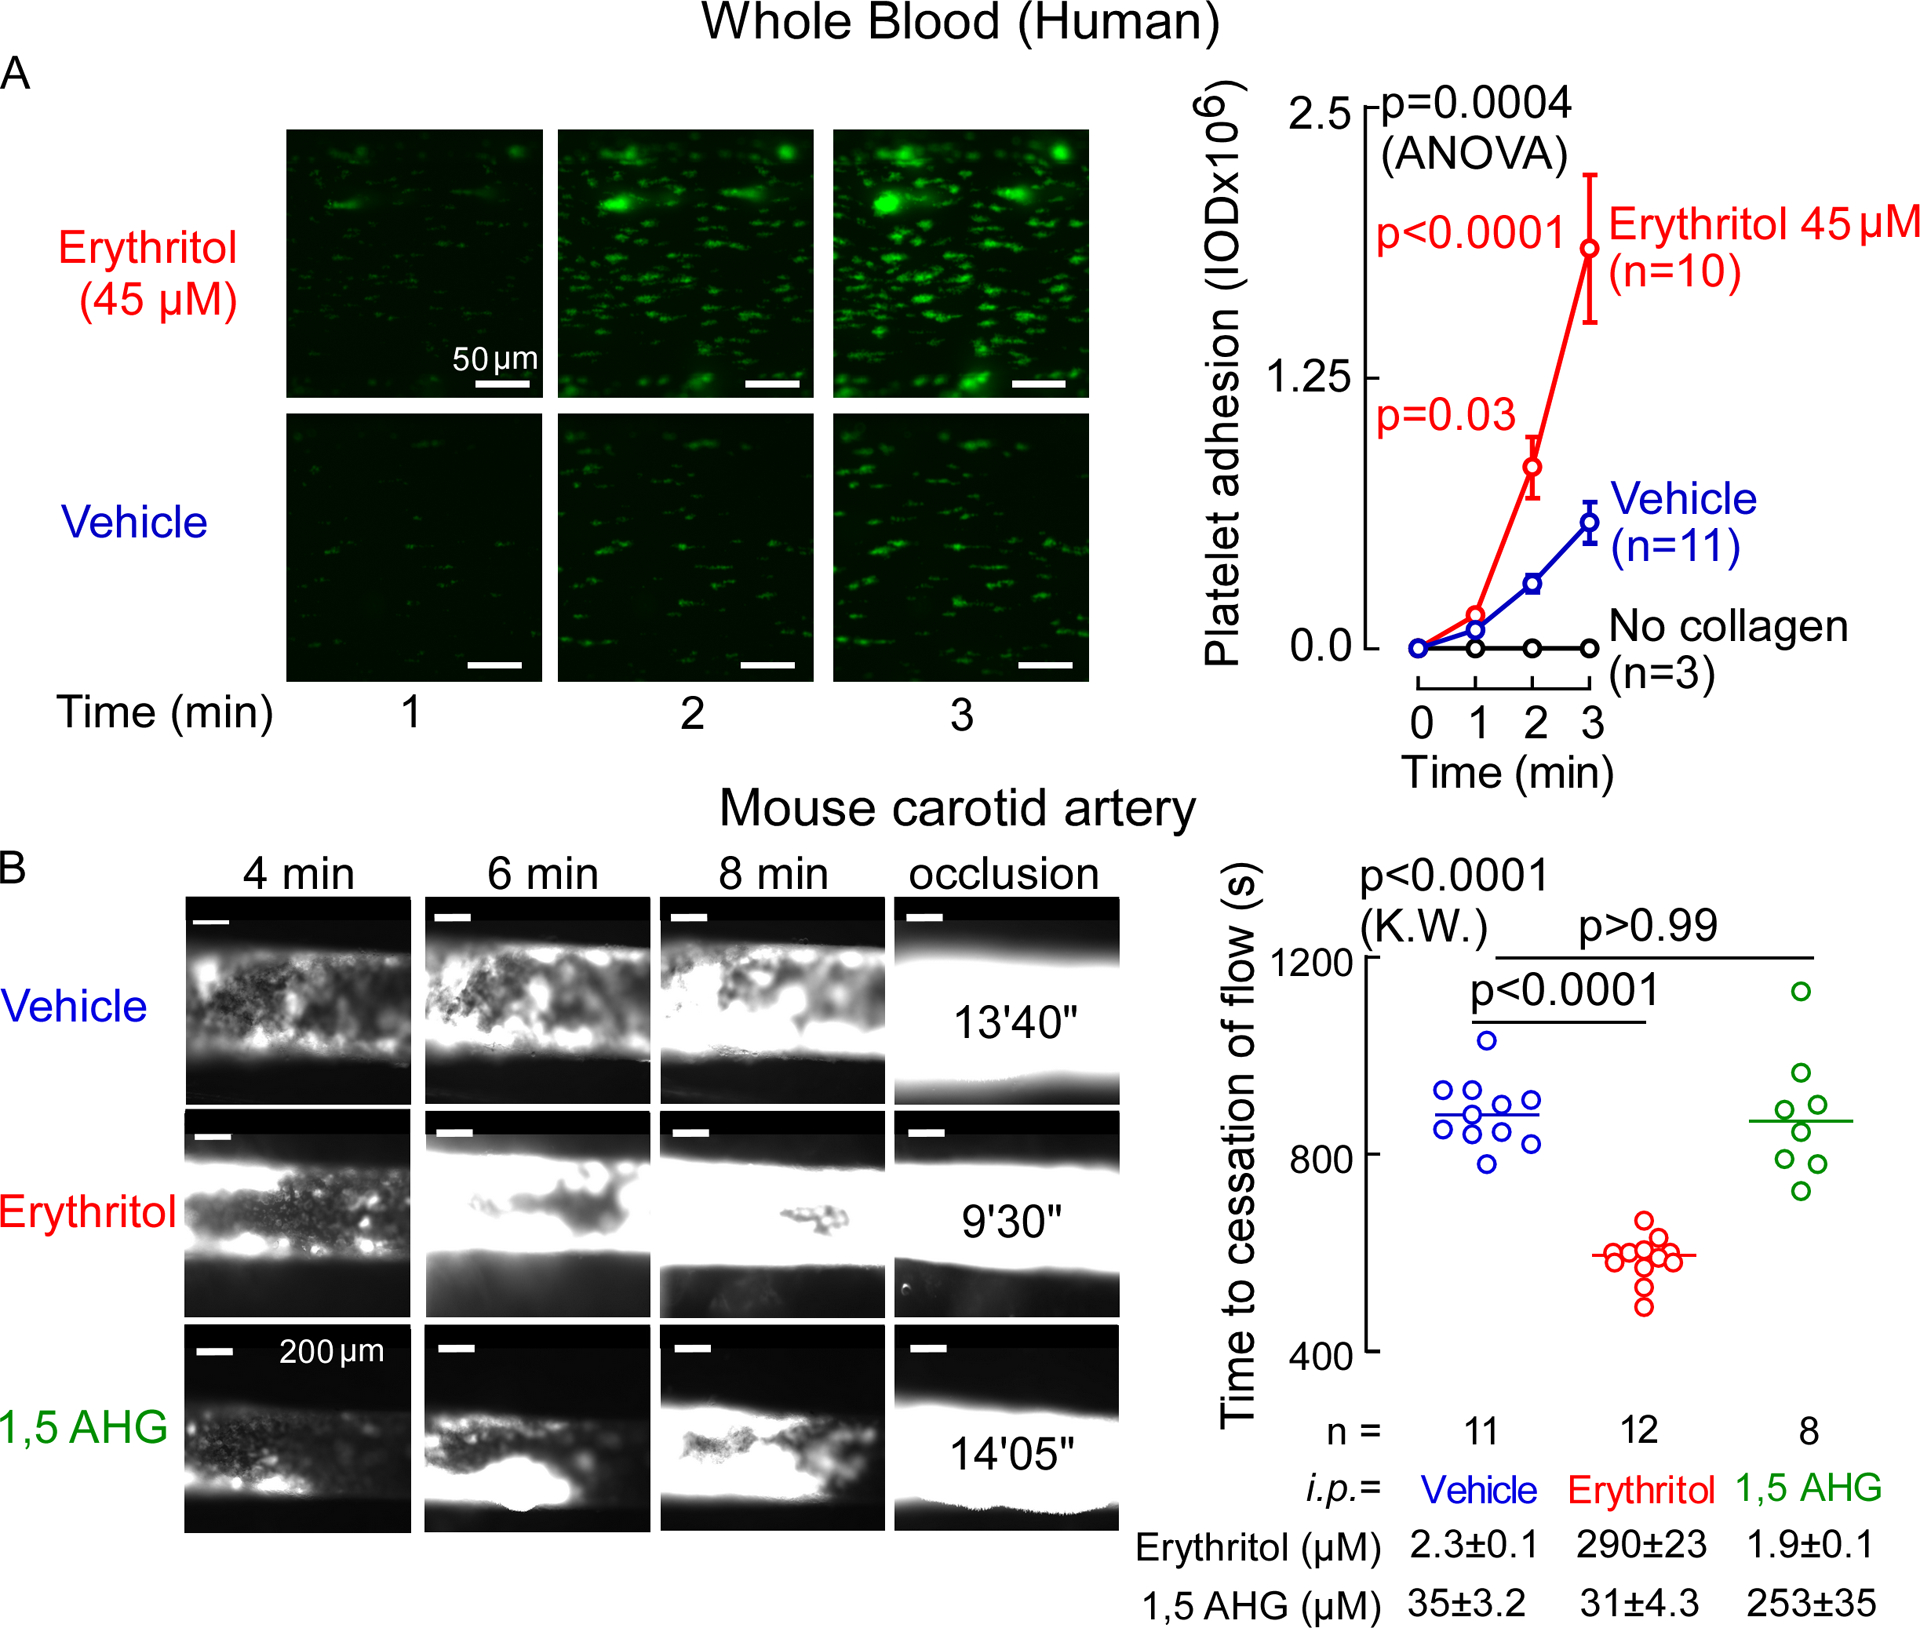
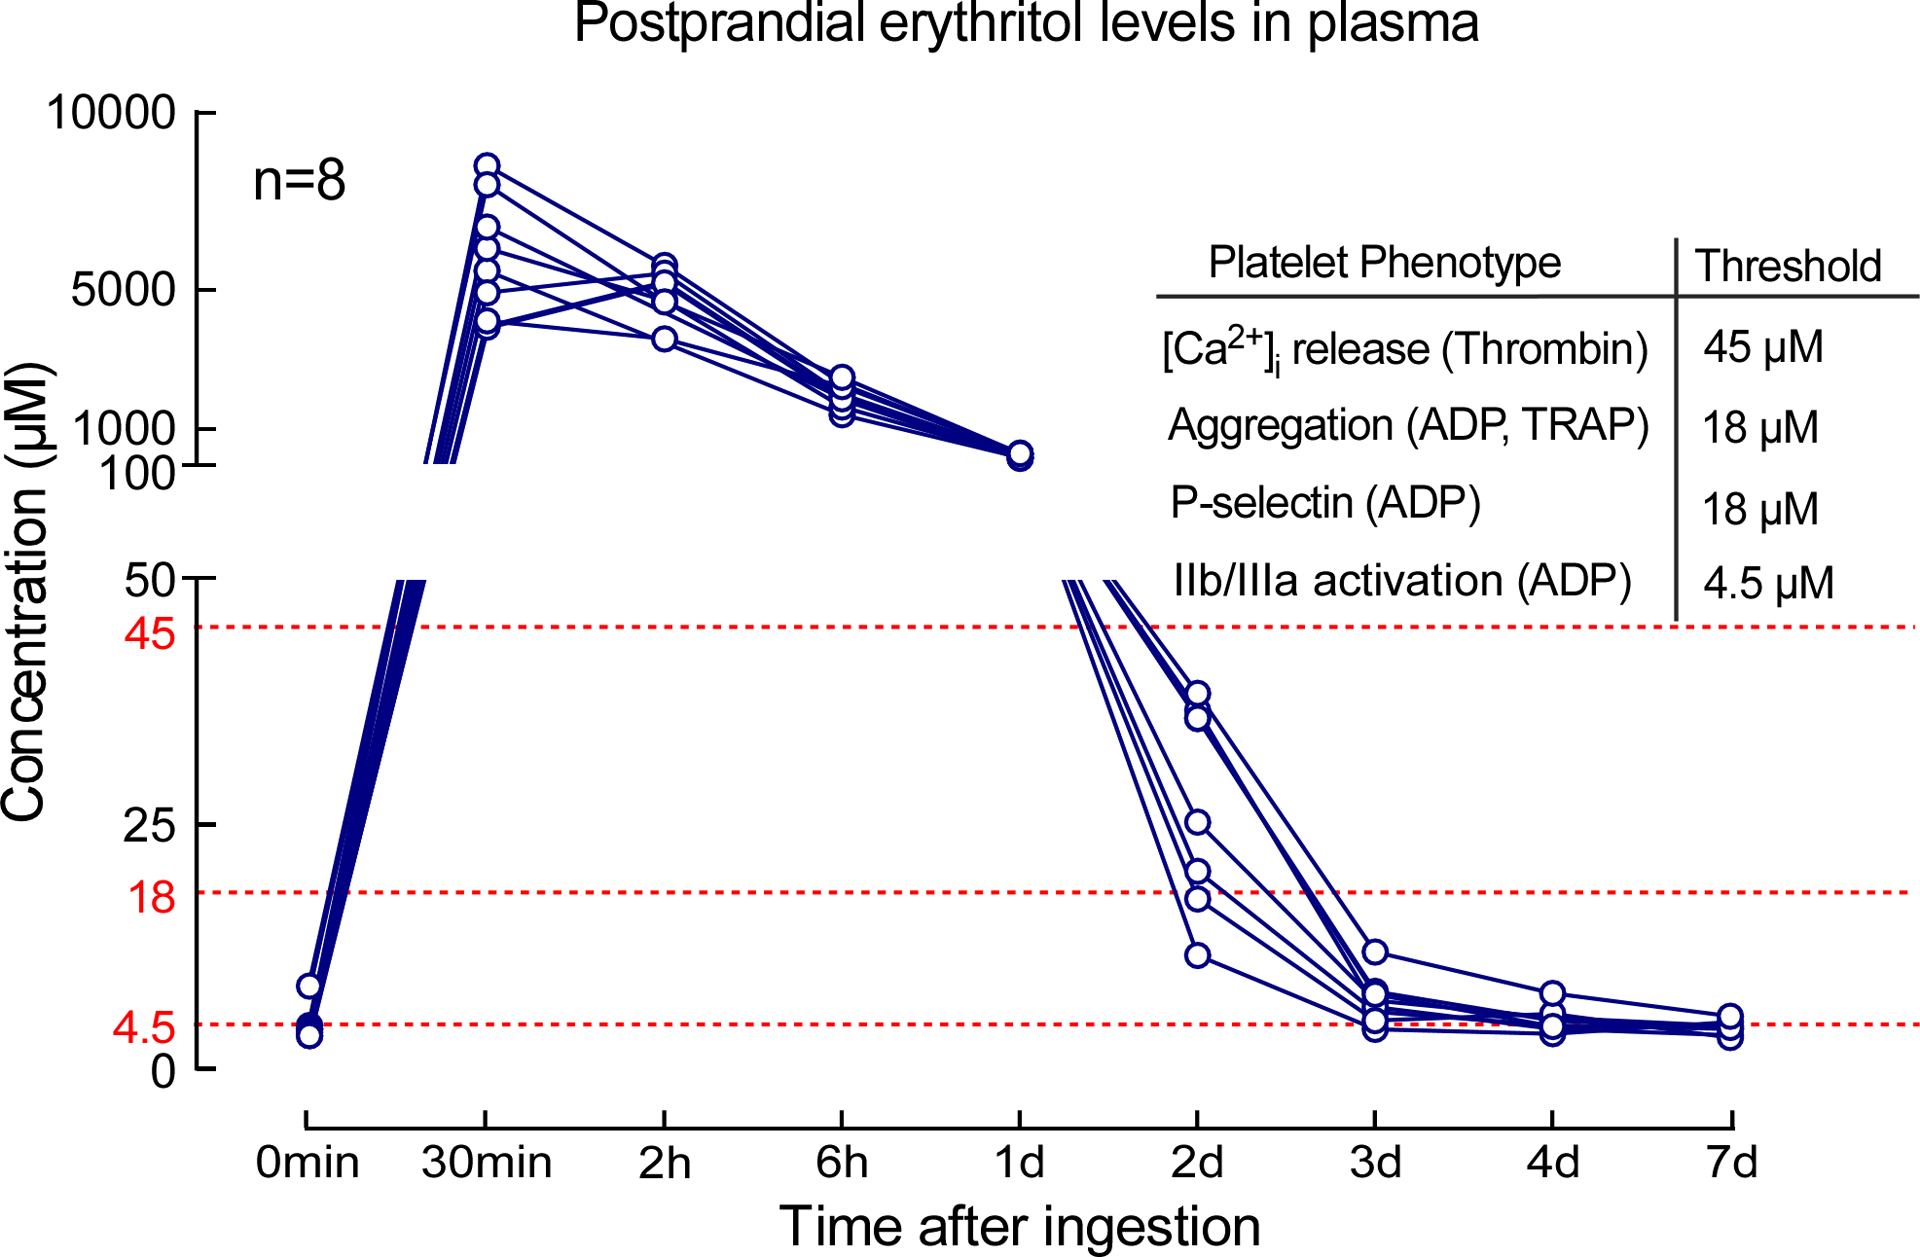
Artificial sweeteners are widely used sugar substitutes, but little is known about their long-term effects on cardiometabolic disease risks. Here we examined the commonly used sugar substitute erythritol and atherothrombotic disease risk. In initial untargeted metabolomics studies in patients undergoing cardiac risk assessment (n = 1,157; discovery cohort, NCT00590200 ), circulating levels of multiple polyol sweeteners, especially erythritol, were associated with incident (3 year) risk for major adverse cardiovascular events (MACE; includes death or nonfatal myocardial infarction or stroke). Subsequent targeted metabolomics analyses in independent US (n = 2,149, NCT00590200 ) and European (n = 833, DRKS00020915 ) validation cohorts of stable patients undergoing elective cardiac evaluation confirmed this association (fourth versus first quartile adjusted hazard ratio (95% confidence interval), 1.80 (1.18-2.77) and 2.21 (1.20-4.07), respectively). At physiological levels, erythritol enhanced platelet reactivity in vitro and thrombosis formation in vivo. Finally, in a prospective pilot intervention study ( NCT04731363 ), erythritol ingestion in healthy volunteers (n = 8) induced marked and sustained (>2 d) increases in plasma erythritol levels well above thresholds associated with heightened platelet reactivity and thrombosis potential in in vitro and in vivo studies. Our findings reveal that erythritol is both associated with incident MACE risk and fosters enhanced thrombosis. Studies assessing the long-term safety of erythritol are warranted.


Conflict of interest statement

Dr. Hazen reports being named as co-inventor on pending and issued patents held by the Cleveland Clinic relating to cardiovascular diagnostics and therapeutics, being a paid consultant formerly for Procter & Gamble and currently with Zehna Therapeutics. He also reports having received research funds from Procter & Gamble, Zehna Therapeutics and Roche Diagnostics, and being eligible to receive royalty payments for inventions or discoveries related to cardiovascular diagnostics or therapeutics from Cleveland HeartLab, a wholly owned subsidiary of Quest Diagnostics, Procter & Gamble and Zehna therapeutics. Dr. Tang reports being a consultant for Sequana Medical A.G., Owkin Inc, Relypsa Inc, and PreCardiac Inc, having received honorarium from Springer Nature for authorship/editorship and American Board of Internal Medicine for exam writing committee participation - all unrelated to the subject and contents of this paper. The other authors have reported that they have no relationships relevant to the contents of this paper to disclose.

Figures

Extended Display Figure 1:
Extended Display Figure 1:. Polyol metabolites and major adverse cardiovascular events (MACE) in untargeted metabolomics analyses of the discovery cohort.
Shown are boxplots with relative levels for the indicated polyol (defined as compounds with two or more hydroxyl groups) area in both patients with (red) and without (blue) incident (3 yr) MACE ranked by Mann Whitney P values. Compound relative areas are shown as log of fold change (no MACE vs. MACE) to facilitate comparison. Boxes represent interquartile ranges (IQR) with the notch indicating the median. Lower whiskers represent smallest observation (≥25% quantile—1.5×IQR) and upper whiskers largest observation (≤75% quantile—1.5×IQR). Two-sided P values were calculated by Mann–Whitney U-test. N for no MACE= 1041, n for MACE= 116. False discovery rate corrected two-sided P values (Benjamini-Hochberg method) are indicated as follows: ****P<0.0001, ***P<0.001, **P<0.01, *P<0.05.
Extended Display Figure 2:
Extended Display Figure 2:. Chromatographic separation of erythritol from its structural isomer threitol.
After exhaustive acetylation with acetic acid anhydride, the polyols erythritol and its structural isomer, threitol, were baseline resolved by the HPLC method developed. Shown are the chromatograms generated by multiple reaction monitoring transitions (MRM) for the derivatized plasma analytes (m/z 308; [M+NH4]+) and synthetic isotopically labeled erythritol internal standard (D6-Erythritol; m/z 314; [M+NH4]+). With the column matrix and mobile phase /gradient employed, coupled with the characteristic parent [M+NH4+] —> daughter ion transition used (for both erythritol and threitol), baseline chromatographic resolution of the two structural isomers was achieved.
Extended Display Figure 3.
Extended Display Figure 3.. Plasma levels of erythritol are elevated in patients with major adverse cardiovascular events (MACE) and coronary artery disease (CAD) in both US and European validation cohorts.
Erythritol levels in patients stratified by presence of (3 year) MACE or CAD. Data are shown as log of plasma Erythritol. Plotted are individual values as dots. Boxes represent interquartile ranges (IQR) with the notch indicating the median. Lower whiskers represent smallest observation (≥25% quantile - 1.5×IQR) and upper whiskers largest observation (≤75% quantile - 1.5×IQR). Two-sided P values were calculated by Mann–Whitney U-test. Numbers of subjects within each group are indicated.
Extended Display Figure 4.
Extended Display Figure 4.. Erythritol increases platelet aggregation responses to submaximal concentrations of agonists.
ADP-stimulated and Thrombin receptor-activating peptide(TRAP)6-stimulated platelet aggregometry responses of human platelet-rich plasma with fixed concentration of erythritol (45 or 90 μM, red) versus normal saline (vehicle, blue). Data in bar graphs are represented as means (±SD), and two-sided P values were calculated by Mann Whitney Test (bar graphs) and by 2-way analysis of variance (overall P value is shown for erythritol effect) with Sidák’s post hoc test. Sidák’s adjusted P values for Erythritol 45 μM vs. vehicle: for ADP 2 μM P=0.01, ADP 3 μM P=0.005, for erythritol 90 μM vs. vehicle: TRAP6 5 μM: P=0.0002. Numbers of independent biological replicates (n) are indicated. *P<0.05, ** P<0.01, ***P<0.001.
Extended Display Figure 5.
Extended Display Figure 5.. Impact of glucose on platelet aggregation.
ADP-stimulated (left panel) and Thrombin receptor-activating peptide (TRAP) 6-stimulated (right panel) platelet aggregometry responses in human platelet-rich plasma incubated with glucose (270 μM, green) versus vehicle (saline, blue). Data in bar graphs are represented as means (±SD). Two-sided P values were calculated using Mann–Whitney U-test. Numbers of independent biological replicates (n) are indicated.
Extended Display Figure 6.
Extended Display Figure 6.. Impact of 1,5 Anhydroglucitol (AHG) on platelet aggregation and calcium release.
Panel A ADP-stimulated and Thrombin receptor-activating peptide (TRAP)6-stimulated platelet aggregometry responses in human platelet-rich plasma incubated with 1,5-AHG (green) versus vehicle (saline, blue). Two-sided P values were calculated by Mann Whitney Test. For ADP and TRAP6 stimulated platelet-rich plasma n=7. Panel B shows thrombin-induced (0.02 U) changes in intracellular calcium concentration in Fura 2-filled washed human platelets incubated with 1,5-AHG (green) or vehicle (saline, blue). Data represent mean (±SD). Two-sided P values were calculated by Wilcoxon matched-pairs signed rank test. Numbers of independent biological replicates (n) are indicated.
Extended Display Figure 7.
Extended Display Figure 7.. Impact of 1,5-Anhydroglucitol (AHG) and glucose on platelet activation.
ADP-induced changes in GP IIb/IIIa (PAC-1 antibody staining) and P-selectin surface expression in washed human platelets pre-incubated with vehicle (saline, blue) or the indicated concentrations of either 1,5-AHG (green, panel A) or glucose (green, panel B). Bars represent means (±SD), Two-sided P values were calculated by Kruskal–Wallis test with Dunn’s post hoc test for multiple-group comparisons. Numbers of independent biological replicates (n) are indicated.
Extended Display Figure 8.
Extended Display Figure 8.. Impact of erythritol at different physiological concentrations on platelet aggregation responses.
Human platelet-rich plasma was incubated with erythritol (red) at low levels observed in fasting patients (18 μM) and higher concentrations observed after erythritol ingestions (6 mM) versus vehicle (saline, blue). Shown are thrombin receptor-activating peptide(TRAP)6-stimulated (panel A) and ADP-stimulated (panel B) platelet aggregometry responses. Data in bar graphs are represented as means (±SD). Two-sided P values were calculated by Mann Whitney Test. Numbers of independent biological replicates (n) are indicated.
Figure 1.
Figure 1.. Kaplan–Meier estimates and forest plots indicating the risks of Major Adverse Cardiovascular Events (MACE), according to erythritol quartile level.
Data shown are for the discovery cohort (upper panel), and two validation cohorts (US cohort, middle panel and European cohort, lower panel). The adjustment in discovery and US cohort included age, sex, type 2 diabetes, systolic blood pressure, body mass index (BMI), low-density and high-density lipoprotein cholesterol, triglyceride, and current smoking status. In the European Cohort, the adjustment included all of the aforementioned variables except for BMI (not available), and instead of systolic blood pressure, hypertension was used. Hazard ratios are indicated by data points in the centre (open circles). The 5–95% confidence interval is indicated by line length.
Figure 2.
Figure 2.. Long term risk of Major Adverse Cardiovascular Events (MACE) among patient subgroups.
Hazard ratios (HR) for 3 year MACE based on Cox proportional-hazards regression analysis compare top to bottom quartiles (Q) for the US cohort (left panel) and European cohort (right panel). Data points (open circles) in the centre indicate HR (with point estimates shown to the right), 95% confidence intervals are represented by line length. N numbers for each subgroup are indicated. P values for interaction with the groups and tabular data are shown in TableS10 and S11.
Figure 3.
Figure 3.. Erythritol enhances platelet responsiveness.
A. Bar graphs show submaximal ADP-stimulated (2 μM) and Thrombin receptor-activating peptide 6 (TRAP6)-stimulated (5 μM) platelet aggregometry responses of human platelet-rich plasma following incubation with erythritol (45 μM, red) versus normal saline (vehicle, blue). Data are represented as means (±SD), and P values were calculated by two-tailed Mann Whitney Test. Scatter plots show aggregometry with varying concentrations of erythritol and fixed submaximal level of ADP (2 μM) or TRAP6 (5 μM) including the data that is used in the bar graphs. P values were calculated by two-sided Kruskal Wallis test with Dunn’s post hoc test. For ADP-stimulated PRP, n=15 for vehicle, n=6 for Erythritol 4.5 μM, n=11 for Erythritol 18 μM, n=10 for Erythritol 45 μM, n=6 for Erythritol 90 and 270 μM. For TRAP6-stimulated PRP, n=10 for vehicle, n= 6 for Erythritol 4.5 μM, n=10 for Erythritol 18 μM, n=6 for Erythritol 45, 90 and 270 μM. (*p < 0.05; **p < 0.01; ***p < 0.001). Dunn’s adjusted P values for ADP-stimulated PRP (Erythritol vs. vehicle): Erythritol 45 μM P=0.002, Erythritol 90 μM P=0.0008, Erythritol 270 μM P<0.0001. Dunn’s adjusted P values for TRAP6-stimulated PRP (Erythritol vs. vehicle): Erythritol 45 μM P=0.02, Erythritol 90 μM P=0.002, Erythritol 270 μM P<0.0001. B. Thrombin-induced (0.02 U) changes in intracellular calcium concentration [Ca2+] in Fura 2-filled washed human platelets incubated with erythritol. P values were calculated by two-sided Wilcoxon matched-pairs signed rank test. n=11 per group. C. ADP-induced changes in GP IIb/IIIa (PAC-1 antibody staining) and P-selectin surface expression in washed human platelets pre-incubated with the indicated concentrations of erythritol. Boxes show 25th and 75th percentiles. The line in the box (centre) is the median, whiskers represent minimum and maximum values. P values were calculated by two-sided Kruskal Wallis test with Dunn’s post hoc test for all samples. For GP IIb/IIIa activation, n=7 for ADP-stimulated PRP exposed to erythritol 4.5 μM, for all other conditions n=8 per group. For P-selectin surface expression n=8 per group. (*p < 0.05; **p < 0.01; ***p < 0.001). Dunn’s adjusted P values for GP IIb/IIIa activation (Erythritol vs. vehicle): Erythritol 4.5 μM P=0.04, Erythritol 18 μM P=0.02, Erythritol 45 μM P=0.003, Erythritol 90 μM P=0.002, Erythritol 270 μM P<0.0001. Dunn’s adjusted P values for P-selectin surface expression (Erythritol vs. vehicle): Erythritol 18 μM P=0.03, Erythritol 45 μM P=0.04, Erythritol 90 μM P=0.005, Erythritol 270 μM P=0.001. Each data point represents an individual measurement or the average of multiple measurments of a distinct sample. There were no repeated measurements within the data shown.
Figure 4.
Figure 4.. Erythritol enhances in vivo thrombosis formation
A. Human platelet adhesion in whole blood to a collagen-coated microfluidic chip surface under physiological shear conditions ± erythritol. Individual biological samples we used and followed over 3 min. Representative images of platelet (green) adhesion at the indicated times (scale bar, 50 μm). P values were calculated by 2-way repeated measures analysis of variance with Sidák’s post hoc test. Overall P value (erythritol effect) is shown in black, Sidák’s post hoc test P values are shown in red over the 3 follow-up times. Data is represented as means (±SEM). n= 10 for erythritol, n=11 for vecihle, n=3 for no collagen control. B. Representative micrographs of carotid artery thrombus formation at the indicated time points following FeCl3-induced carotid artery injury (scale bar, 200 μm) and time to cessation of blood flow in mice from indicated groups i.p. injected with vehicle or erythritol. Bars represent means, two-sided P values were calculated by Kruskal Wallis test with Dunn’s post hoc test. n=11 for vehicle, n=12 for erythritol, n=8 for 1,5 anhydroglucitol(AHG).
Figure 5.
Figure 5.. Effects of an Erythritol challenge on mean plasma levels.
Study participants (n=8) were given 30 g of erythritol in a drink, and plasma levels were measured over the course of 7 days. Thresholds indicated (red) represent the erythritol concentrations noted in dose-response studies where significant increase in the indicated measure of platelet responsiveness was observed.

Comment in

References

    1. Abarca-Gómez L, et al. Worldwide trends in body-mass index, underweight, overweight, and obesity from 1975 to 2016: a pooled analysis of 2416 population-based measurement studies in 128·9 million children, adolescents, and adults. The Lancet 390, 2627–2642 (2017). - PMC - PubMed
    1. Sylvetsky AC & Rother KI Trends in the consumption of low-calorie sweeteners. Physiol Behav 164, 446–450 (2016). - PMC - PubMed
    1. Buerge IJ, Buser HR, Kahle M, Müller MD & Poiger T Ubiquitous occurrence of the artificial sweetener acesulfame in the aquatic environment: an ideal chemical marker of domestic wastewater in groundwater. Environ Sci Technol 43, 4381–4385 (2009). - PubMed
    1. Roberts A The safety and regulatory process for low calorie sweeteners in the United States. Physiol Behav 164, 439–444 (2016). - PubMed
    1. Mortensen A Sweeteners permitted in the European Union: safety aspects. Scandinavian Journal of Food and Nutrition 50, 104–116 (2006).

Publication types