

Association between Cystic Fibrosis exacerbations, lung function, T2 inflammation and microbiological colonization
- PMID: 36849900
- PMCID: PMC9969710
- DOI: 10.1186/s13223-023-00760-z
Association between Cystic Fibrosis exacerbations, lung function, T2 inflammation and microbiological colonization
Abstract
Background: The Cystic Fibrosis Foundation Patient Registry (CFFPR) reports a high prevalence of asthma (34.6%) in people with Cystic Fibrosis (PwCF). While our current understanding of this relationship is limited, a type 2 inflammatory (T2) phenotype has often been identified in CF patients.
Research question: This study aimed to evaluate the relationship between the eosinophilic CF T2 inflammatory phenotype and CF-related pulmonary outcomes and microbiological data.
Study design and methods: We conducted a retrospective chart review of adult patients with CF (18 and older; n = 93) receiving their care at University of Virginia Medical Center adult program from January, 2013 through December, 2018. Data collected included demographic data, CFTR (CF transmembrane conductance regulator) mutation, CF comorbidities, medications, Absolute Eosinophil Counts (AEC) in cells/µL and Immunoglobulin E (IgE) levels in IU/mL.
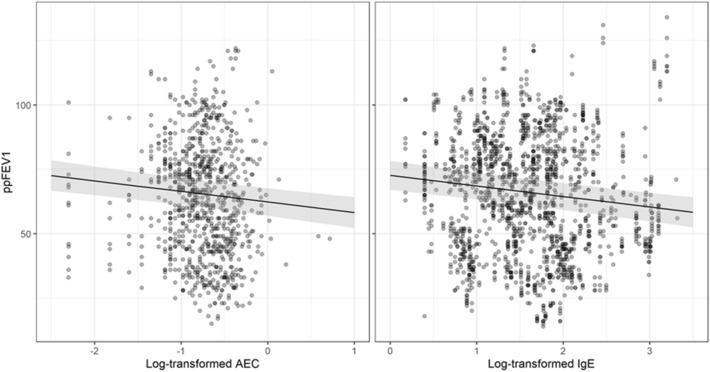
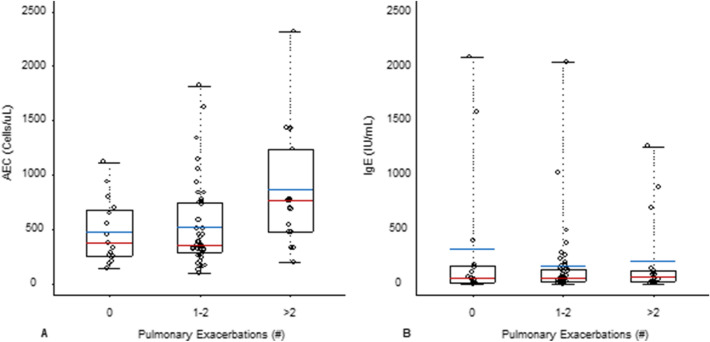
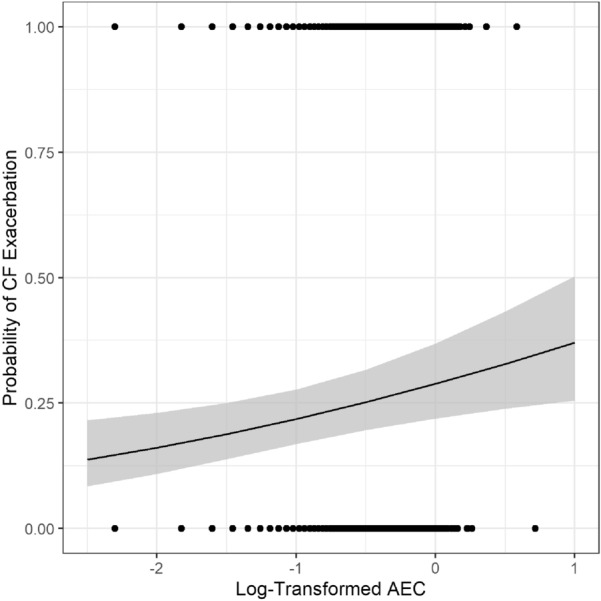
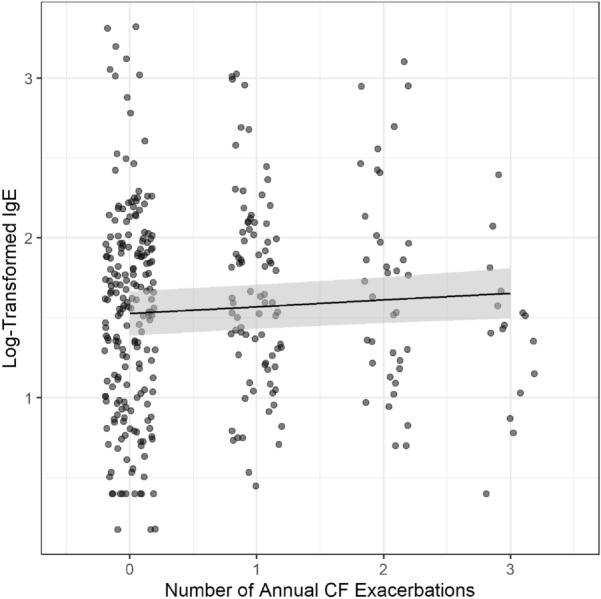
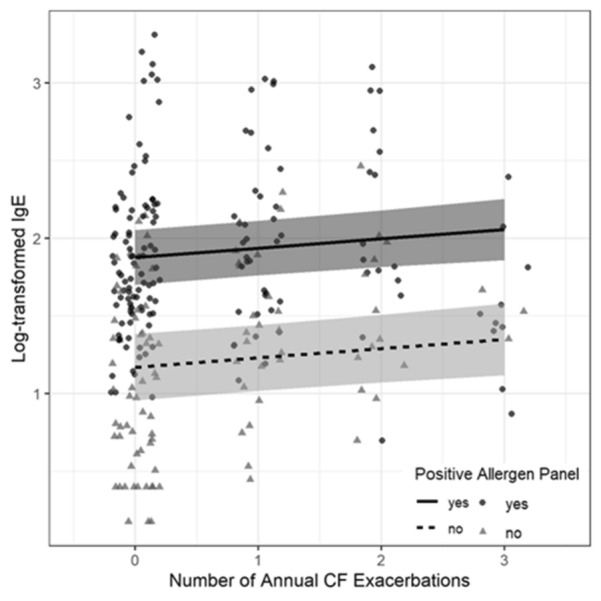
Results: Of 93 patients screened for study eligibility, 74 were included in the final analysis; 19 patients were excluded due to lack of longitudinal data across the study timeline. Lung function decline correlated with increased AEC (p < 0.001) and IgE (p < 0.001) even when adjusting for covariates: age, gender, presence of Pseudomonas spp., MRSA, other bacterial spp., Aspergillus spp., and other fungi (p < 0.001). Univariate analysis demonstrated that people with CF who experienced more than 2 exacerbations requiring hospitalizations and/or intravenous antibiotics a year were more likely to have high AEC (p = 0.018). Logistic regression showed that as AEC increases, the probability that the measurement was taken during a CF exacerbation increases (p = 0.0039). A linear mixed model showed that each additional annual exacerbation event increased on average the log IgE by 0.04. (p = 0.015). This finding remained stable in a multivariate model (p = 0.0145). When adjusted for atopy, log IgE increases as the number of exacerbation events increases (p = 0.022). There was no association between AEC and IgE and microbiological colonization.
Interpretation: This study has shown that in CF patients, T2 inflammation based on serum AEC and IgE correlated with pulmonary exacerbations requiring hospitalizations and/or intravenous antibiotics, independent of bacterial airway colonization. In addition, lung function decline correlated with increased IgE and AEC. Further studies are needed to explore these correlations and potential impact on treatment.
Keywords: Bacteria; Cystic fibrosis; Eosinophil; Fungi; Immunoglobulin E; Pulmonary exacerbation; Type 2 inflammation.
© 2023. The Author(s).
Conflict of interest statement
No relevant conflicts exist for Dr. Dana Albon, Dr. Lijia Zhang, James Patrie, Dr. Marieke Jones, Galvin Li, Emily Noonan, and Dr. Larry Borish.
Figures
References
-
- Cystic Fibrosis Foundation. Cystic Fibrosis Foundation. United States, 2019.
Grants and funding
LinkOut - more resources
Full Text Sources
Miscellaneous
