. 2023 Feb 27;25(1):15.
doi: 10.1186/s12968-023-00924-1.

A deep learning approach for fully automated cardiac shape modeling in tetralogy of Fallot

Affiliations

A deep learning approach for fully automated cardiac shape modeling in tetralogy of Fallot

Sachin Govil et al. J Cardiovasc Magn Reson. .

Abstract

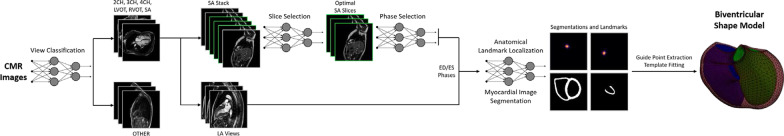
Background: Cardiac shape modeling is a useful computational tool that has provided quantitative insights into the mechanisms underlying dysfunction in heart disease. The manual input and time required to make cardiac shape models, however, limits their clinical utility. Here we present an end-to-end pipeline that uses deep learning for automated view classification, slice selection, phase selection, anatomical landmark localization, and myocardial image segmentation for the automated generation of three-dimensional, biventricular shape models. With this approach, we aim to make cardiac shape modeling a more robust and broadly applicable tool that has processing times consistent with clinical workflows.

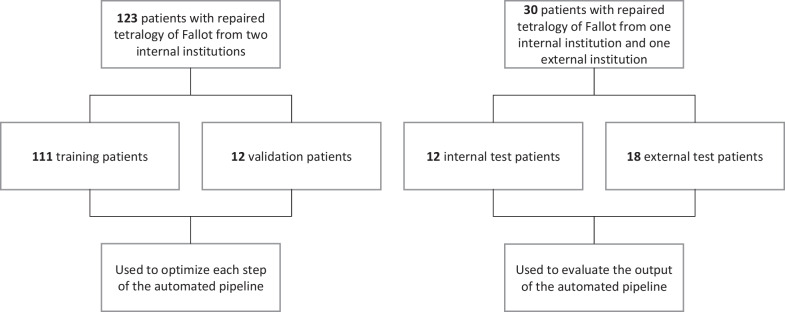
Methods: Cardiovascular magnetic resonance (CMR) images from a cohort of 123 patients with repaired tetralogy of Fallot (rTOF) from two internal sites were used to train and validate each step in the automated pipeline. The complete automated pipeline was tested using CMR images from a cohort of 12 rTOF patients from an internal site and 18 rTOF patients from an external site. Manually and automatically generated shape models from the test set were compared using Euclidean projection distances, global ventricular measurements, and atlas-based shape mode scores.

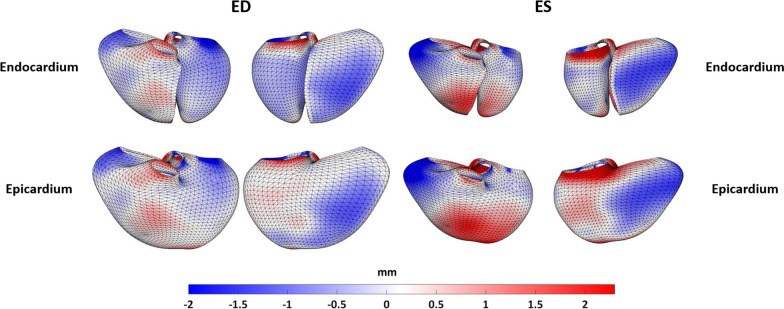
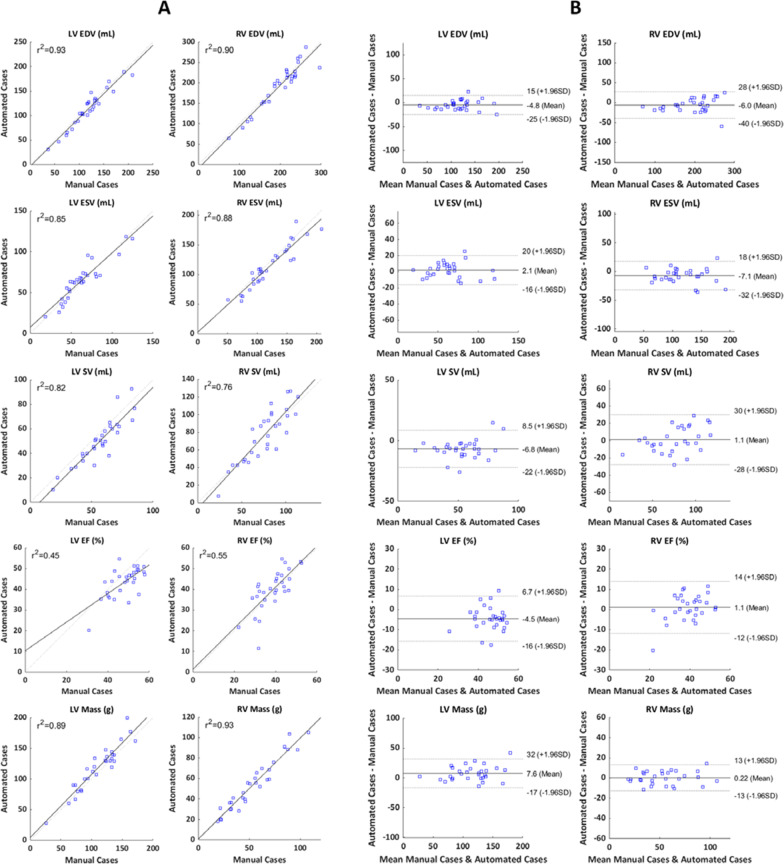
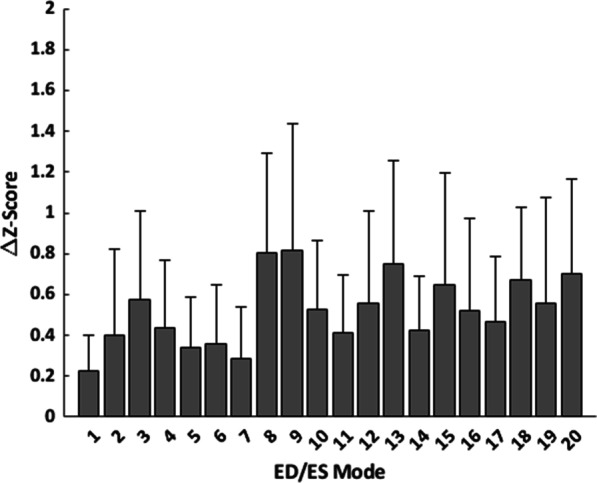
Results: The mean absolute error (MAE) between manually and automatically generated shape models in the test set was similar to the voxel resolution of the original CMR images for end-diastolic models (MAE = 1.9 ± 0.5 mm) and end-systolic models (MAE = 2.1 ± 0.7 mm). Global ventricular measurements computed from automated models were in good agreement with those computed from manual models. The average mean absolute difference in shape mode Z-score between manually and automatically generated models was 0.5 standard deviations for the first 20 modes of a reference statistical shape atlas.

Conclusions: Using deep learning, accurate three-dimensional, biventricular shape models can be reliably created. This fully automated end-to-end approach dramatically reduces the manual input required to create shape models, thereby enabling the rapid analysis of large-scale datasets and the potential to deploy statistical atlas-based analyses in point-of-care clinical settings. Training data and networks are available from cardiacatlas.org.

Keywords: Cardiovascular magnetic resonance (CMR); Congenital heart disease; Deep learning; Image segmentation; Shape modeling.


Conflict of interest statement

ADM and JHO are co-founders of, scientific advisors to, and equity holders in Insilicomed, Inc. ADM is also a co-founder of and scientific advisor to Vektor Medical, Inc. Some of their research grants have been identified for conflict-of-interest management. The authors are required to disclose these relationships in publications acknowledging the grant support; however, the findings reported in this study did not involve the companies in any way and have no relationship with the business activities or scientific interests of either company. The terms of this arrangement have been reviewed and approved by the University of California San Diego in accordance with its conflict-of-interest policies. The rest of the authors do not have any conflict-of-interest.

Figures

Fig. 1
Fig. 1
Overview of the automated cardiac shape modeling pipeline. The automated pipeline was developed as a series of five steps for view classification, slice selection, phase selection, anatomical landmark localization, and myocardial image segmentation. CMR cardiovascular magnetic resonance, 2Ch two-chamber, 3Ch three-chamber, 4Ch four-chamber, LVOT left ventricular outflow tract, RVOT right ventricular outflow tract, SAx short axis, LA long axis, ED end-diastole, ES end-systole
Fig. 2
Fig. 2
Flow-diagram of internal and external datasets used to train, validate, and test the automated cardiac shape modeling pipeline. Cases from the training/validation set were used to optimize each step of the automated pipeline, while cases from the test set were used to evaluate the generalizability of the automated pipeline
Fig. 3
Fig. 3
Representative anatomical landmark localization predictions for the 3Ch, 4Ch, RVOT, and SAx views. 3CH three-chamber, 4Ch four-chamber, RVOT right ventricular outflow tract, SAx short axis, RV right ventricular, MV mitral valve, AV aortic valve, TV tricuspid valve, PV pulmonary valve
Fig. 4
Fig. 4
Representative myocardial image segmentation predictions for the 2Ch LT, 2Ch RT, 3Ch, 4Ch, RVOT and SAx views. 2Ch LT two-chamber left, 2Ch RT two-chamber right, 3Ch three-chamber, 4Ch four-chamber, RVOT right ventricular outflow tract, SAx short axis
Fig. 5
Fig. 5
Representative output of the automated cardiac shape modeling pipeline. Extracted contour points for the LV endocardium (green), RV endocardium (yellow), epicardium (cyan), and septum (red) and anatomical landmark points for the MV (blue), AV (green), TV (purple), and PV (red) are shown on corresponding views (outside). The contour points and anatomical landmark points were then fit to a biventricular subdivision surface template mesh resulting in a patient-specific biventricular shape model (center) with surfaces for the LV endocardium (green), RV endocardium (blue), and epicardium (maroon). 2Ch LT two-chamber left, 2Ch RT two-chamber right, 3Ch three-chamber, 4Ch four-chamber, RVOT right ventricular outflow tract; SAx short axis, LV left ventricular, RV right ventricular, MV mitral valve, AV aortic valve, TV tricuspid valve, PV pulmonary valve
Fig. 6
Fig. 6
Average inward (blue) and outward (red) Euclidian projection distances between manually and automatically generated shape models in the test set. The range of the color bar accounts for 99% of the observed errors. ED end-diastole, ES end-systole
Fig. 7
Fig. 7
A Regression plots showing the correlation between global ventricular measurements for manually and automatically generated shape models in the test set. B Bland–Altman plots comparing the correlation of global ventricular measurements for manually and automatically generated shape models in the test set. LV left ventricular, RV right ventricular, EDV end-diastolic volume, ESV end-systolic volume, SV stroke volume, EF ejection fraction
Fig. 8
Fig. 8
Z-score difference between manually and automatically generated shape models in the test set projected onto an ED/ES shape atlas constructed from shape models in the training/validation set. Bars show the average absolute difference in Z-score, and error bars show the standard deviation

References

    1. Medrano-Gracia P, et al. Left ventricular shape variation in asymptomatic populations: the multi-ethnic study of atherosclerosis. J Cardiovasc Magn Reson. 2014;16:56. doi: 10.1186/s12968-014-0056-2. - DOI - PMC - PubMed
    1. Bai W, et al. A bi-ventricular cardiac atlas built from 1000+ high resolution MR images of healthy subjects and an analysis of shape and motion. Med Image Anal. 2015;26(1):133–145. doi: 10.1016/j.media.2015.08.009. - DOI - PubMed
    1. Farrar G, et al. Atlas-based ventricular shape analysis for understanding congenital heart disease. Prog Pediatr Cardiol. 2016;43:61–69. doi: 10.1016/j.ppedcard.2016.07.010. - DOI - PMC - PubMed
    1. Gilbert K, et al. Atlas-based computational analysis of heart shape and function in congenital heart disease. J Cardiovasc Transl Res. 2018;11(2):123–132. doi: 10.1007/s12265-017-9778-5. - DOI - PMC - PubMed
    1. Suinesiaputra A, et al. Statistical shape modeling of the left ventricle: myocardial infarct classification challenge. IEEE J Biomed Health Inform. 2018;22(2):503–515. doi: 10.1109/JBHI.2017.2652449. - DOI - PMC - PubMed

Publication types