. 2023 Feb 27;11(1):34.
doi: 10.1186/s40168-022-01427-4.

Rapid remodeling of the soil lipidome in response to a drying-rewetting event

Affiliations

Rapid remodeling of the soil lipidome in response to a drying-rewetting event

Sneha P Couvillion et al. Microbiome. .

Abstract

Background: Microbiomes contribute to multiple ecosystem services by transforming organic matter in the soil. Extreme shifts in the environment, such as drying-rewetting cycles during drought, can impact the microbial metabolism of organic matter by altering microbial physiology and function. These physiological responses are mediated in part by lipids that are responsible for regulating interactions between cells and the environment. Despite this critical role in regulating the microbial response to stress, little is known about microbial lipids and metabolites in the soil or how they influence phenotypes that are expressed under drying-rewetting cycles. To address this knowledge gap, we conducted a soil incubation experiment to simulate soil drying during a summer drought of an arid grassland, then measured the response of the soil lipidome and metabolome during the first 3 h after wet-up.

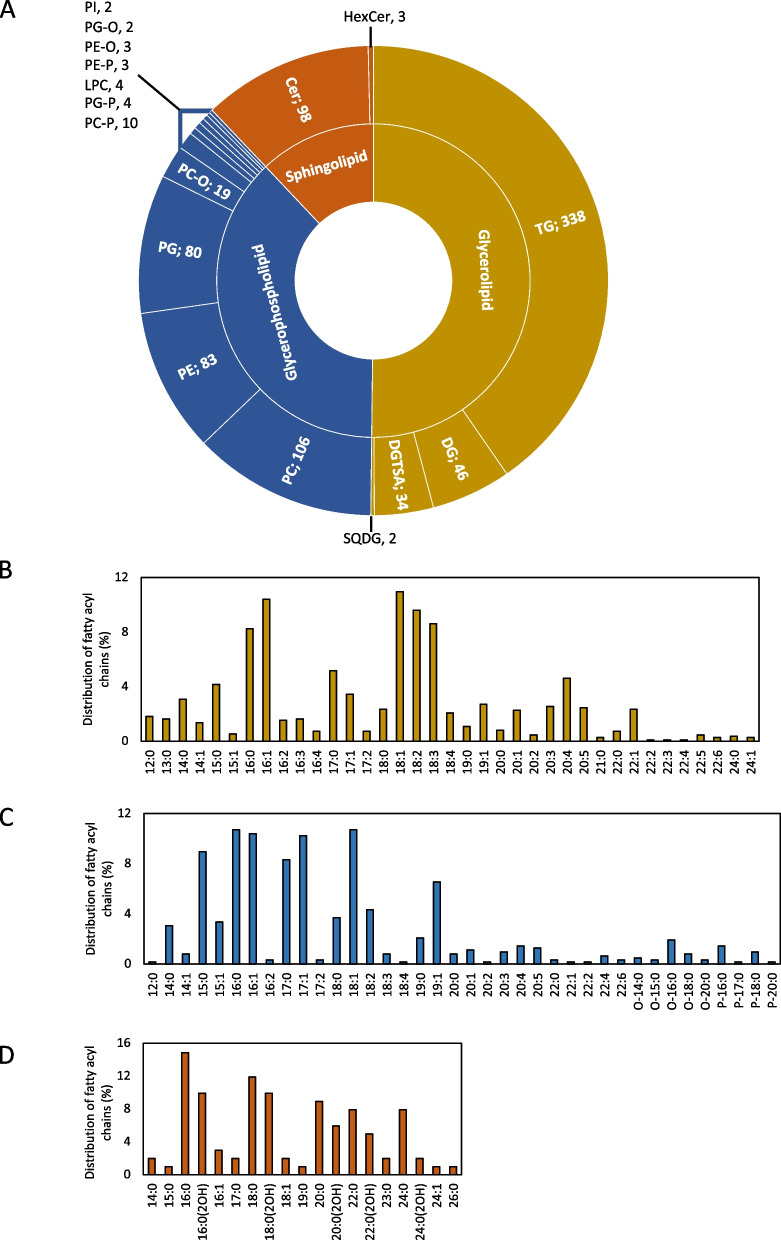
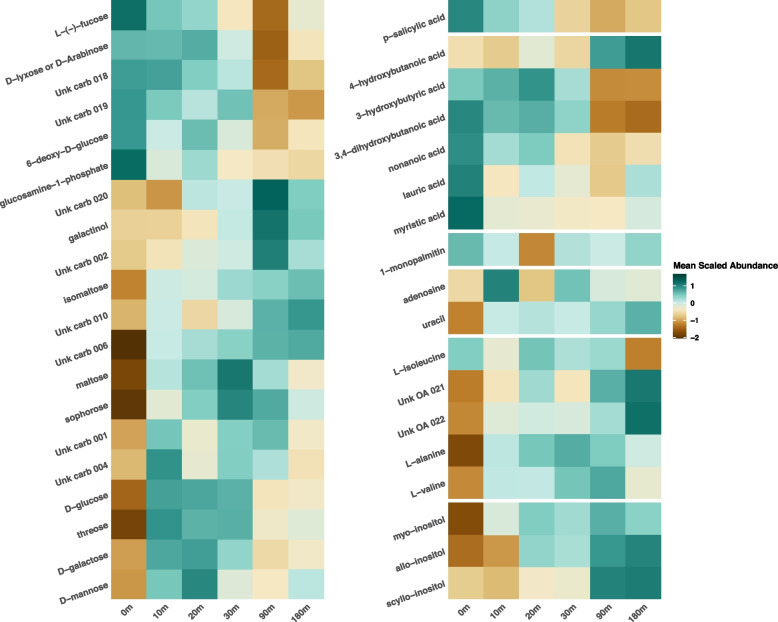
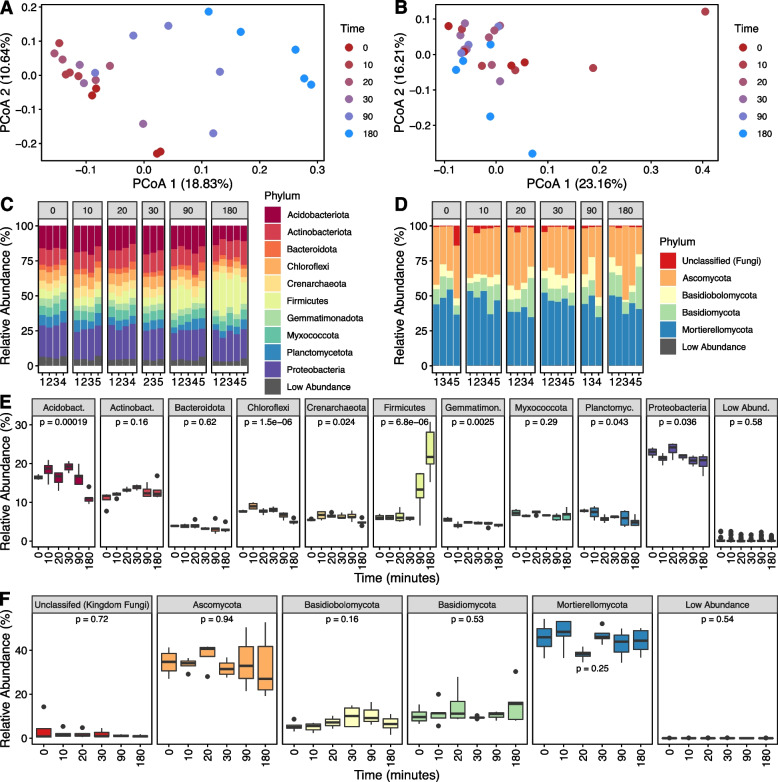
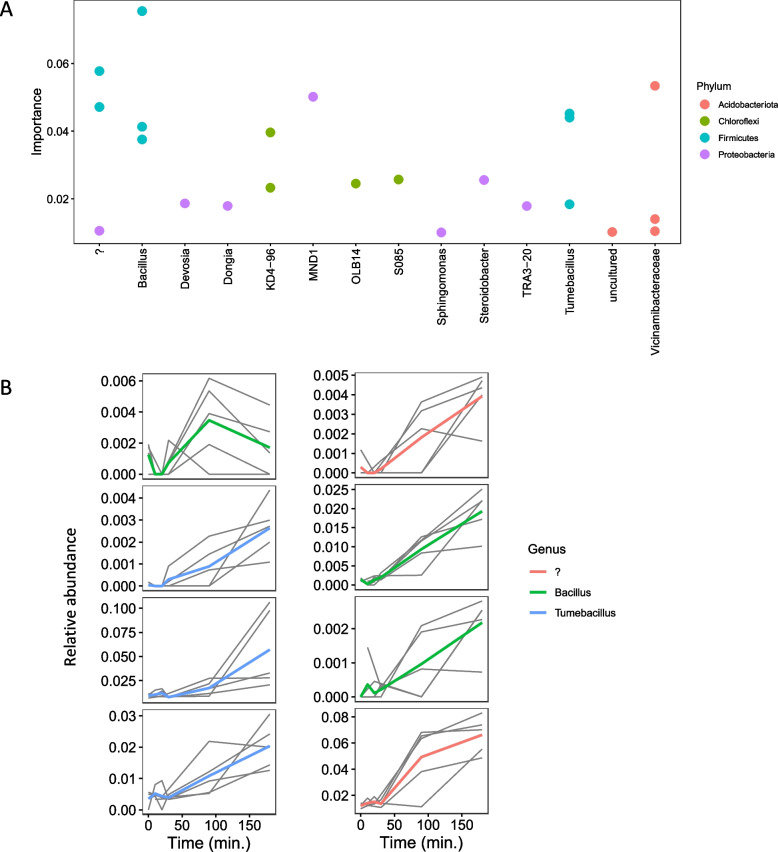
Results: Reduced nutrient access during soil drying incurred a replacement of membrane phospholipids, resulting in a diminished abundance of multiple phosphorus-rich membrane lipids. The hot and dry conditions increased the prevalence of sphingolipids and lipids containing long-chain polyunsaturated fatty acids, both of which are associated with heat and osmotic stress-mitigating properties in fungi. This novel finding suggests that lipids commonly present in eukaryotes such as fungi may play a significant role in supporting community resilience displayed by arid land soil microbiomes during drought. As early as 10 min after rewetting dry soil, distinct changes were observed in several lipids that had bacterial signatures including a rapid increase in the abundance of glycerophospholipids with saturated and short fatty acid chains, prototypical of bacterial membrane lipids. Polar metabolites including disaccharides, nucleic acids, organic acids, inositols, and amino acids also increased in abundance upon rewetting. This rapid metabolic reactivation and growth after rewetting coincided with an increase in the relative abundance of firmicutes, suggesting that members of this phylum were positively impacted by rewetting.

Conclusions: Our study revealed specific changes in lipids and metabolites that are indicative of stress adaptation, substrate use, and cellular recovery during soil drying and subsequent rewetting. The drought-induced nutrient limitation was reflected in the lipidome and polar metabolome, both of which rapidly shifted (within hours) upon rewet. Reduced nutrient access in dry soil caused the replacement of glycerophospholipids with phosphorus-free lipids and impeded resource-expensive osmolyte accumulation. Elevated levels of ceramides and lipids with long-chain polyunsaturated fatty acids in dry soil suggest that lipids likely play an important role in the drought tolerance of microbial taxa capable of synthesizing these lipids. An increasing abundance of bacterial glycerophospholipids and triacylglycerols with fatty acids typical of bacteria and polar metabolites suggest a metabolic recovery in representative bacteria once the environmental conditions are conducive for growth. These results underscore the importance of the soil lipidome as a robust indicator of microbial community responses, especially at the short time scales of cell-environment reactions. Video Abstract.

Keywords: Drying-rewetting; Lipidomics; Metabolomics; Soil; Summer drought.


Conflict of interest statement

The authors declare that they have no competing interests.

Figures

Fig. 1
Fig. 1
Distribution of lipids identified in soil samples from all time points. A Lipids were identified across 3 lipid categories [glycerolipids (yellow) glycerophospholipids (blue) and sphingolipids (orange)] and 18 sub-classes. Major sub-classes with greater than 10 lipids are shown. PC diacylglycerophosphocholine, LPC monoacylglycerophosphocholine, PE diacylglycerophosphoethanolmine, PG diacylglycerophosphoglycerol, PX-O ether PX, PX-P plasmalogen PX, DG diacylglyceride, TG triacylglyceride, DGTSA betaine lipid, and Cer ceramide. The number of lipids identified is indicated next to the subclass. Distribution of fatty acyl chains in B glycerolipid, C glycerophospholipid, and D sphingolipid categories
Fig. 2
Fig. 2
Heatmaps of mean auto-scaled log2 normalized abundance for lipid species that differed significantly between a later time point following soil wetting and the initial time 0 for dry soil (Dunnett-adjusted p value < 0.05 for at least one comparison). Heatmaps contain lipids from both positive and negative ionization modes, where each lipid species was auto-scaled individually; the mean for each time point is displayed in the heatmap. Sum total fatty acid carbons and double bonds are indicated
Fig. 3
Fig. 3
Heatmaps of mean auto-scaled log2 normalized abundance for polar metabolites that differed significantly between a later time point following soil wetting and the initial time 0 for dry soil (Dunnett-adjusted p value < 0.05 for at least one comparison). Each metabolite was auto-scaled individually, and the mean for each time point is displayed in the heatmap
Fig. 4
Fig. 4
Analysis of archaeal/bacterial and fungal community composition following 180 min of rewetting of dessicated soil. PCoA of A 16S rRNA gene (archaeal/bacterial) and B ITS region (fungal) amplicon sequencing datasets. Stacked bar charts illustrate the relative abundance of the archaeal/bacterial (C) and fungal (D) taxa which comprise at least 5% of the respective microbial community; phyla which are <5% are considered “low abundance.” A comparative analysis through time is presented as boxplots in panels (E) 16S rRNA gene (archaeal/bacterial) and F ITS region (fungal). P values represent the results of an ANOVA with values < 0.05 indicating that a significant difference in relative abundance exists between at least two timepoints. Pairwise t test comparisons through time and corresponding p values can be found in Supplemental Tables S6 and S7
Fig. 5
Fig. 5
Differentially abundant ASVs for the archaeal/bacterial datasets across the two extreme timepoints: 0 min (dry) and 180 min (wet). The points represent the log2 fold change of an ASV belonging to the genus outlined on the x-axis, colored based upon the corresponding phylum
Fig. 6
Fig. 6
Longitudinal feature-volatility analysis of bacterial/archaeal ASVs. A The points represent the importance of an ASV belonging to the genus outlined on the x-axis, colored based on the corresponding phylum. Only ASVs with an importance > 1% are shown. B Relative abundances of the ASVs belonging to the Firmicutes phylum are shown across time for individual replicates (narrow black lines) and for group averages with thick lines colored based on genus
Fig. 7
Fig. 7
A network visualization of significant positive Pearson correlations between normalized lipid (squares) relative abundance and ASV counts from rarefied 16S rRNA gene (orange circles) and ITS region (green diamonds) amplicon data across all time points. Edge thickness is proportional to the correlation coefficient and node size is proportional to the number of connected edges. Edges are colored purple if FDR < 0.05. Bacterial and fungal nodes are labeled to indicate genus if available and class. Lipid node colors: glycerophospholipids, cyan; TGs, dark blue; DGs, light blue; and phosphorus-free betaine and SQDG lipids, yellow

References

    1. Meehl GA, Tebaldi C. More intense, more frequent, and longer lasting heat waves in the 21st century. Science. 2004;305:994–997. doi: 10.1126/science.1098704. - DOI - PubMed
    1. Teuling AJ. A hot future for European droughts. Nat Clim Chang. 2018;8:364–365. doi: 10.1038/s41558-018-0154-5. - DOI
    1. de Vries FT, et al. Soil bacterial networks are less stable under drought than fungal networks. Nat Commun. 2018;9:3033. doi: 10.1038/s41467-018-05516-7. - DOI - PMC - PubMed
    1. Classen AT, et al. Direct and indirect effects of climate change on soil microbial and soil microbial-plant interactions: what lies ahead? Ecosphere. 2015;6:art130. doi: 10.1890/ES15-00217.1. - DOI
    1. Schimel J, Balser TC, Wallenstein M. Microbial stress-response physiology and its implications for ecosystem function. Ecology. 2007;88:1386–1394. doi: 10.1890/06-0219. - DOI - PubMed

Publication types