. 2023 Feb 16;23(4):2237.
doi: 10.3390/s23042237.

Rock Surface Strain In Situ Monitoring Affected by Temperature Changes at the Požáry Field Lab (Czechia)

Affiliations

Rock Surface Strain In Situ Monitoring Affected by Temperature Changes at the Požáry Field Lab (Czechia)

Ondřej Racek et al. Sensors (Basel). .

Abstract

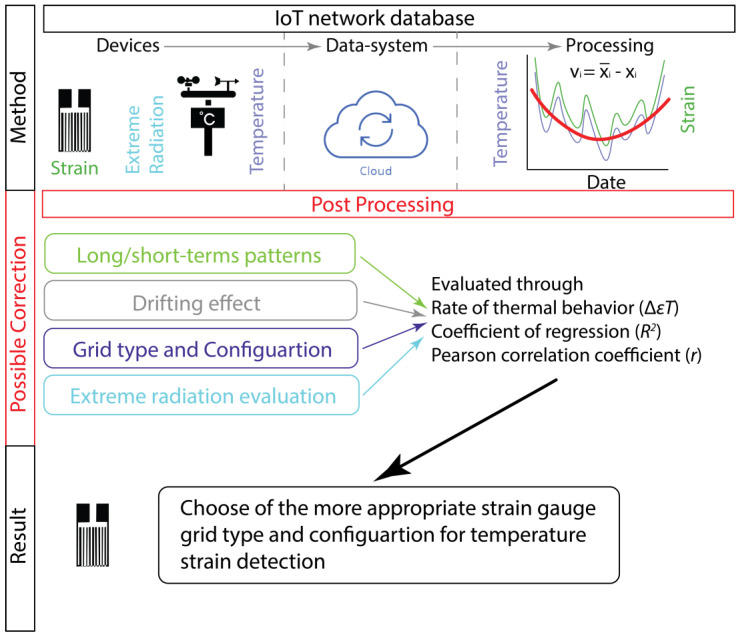
The evaluation of strain in rock masses is crucial information for slope stability studies. For this purpose, a monitoring system for analyzing surface strain using resistivity strain gauges has been tested. Strain is a function of stress, and it is known that stress affects the mechanical properties of geomaterials and can lead to the destabilization of rock slopes. However, stress is difficult to measure in situ. In industrial practice, resistivity strain gauges are used for strain measurement, allowing even small strain changes to be recorded. This setting of dataloggers is usually expensive and there is no accounting for the influence of exogenous factors. Here, the aim of applying resistivity strain gauges in different configurations to measure surface strain in natural conditions, and to determine how the results are affected by factors such as temperature and incoming solar radiation, has been pursued. Subsequently, these factors were mathematically estimated, and a data processing system was created to process the results of each configuration. Finally, the new strategy was evaluated to measure in situ strain by estimating the effect of temperature. The approach highlighted high theoretical accuracy, hence the ability to detect strain variations in field conditions. Therefore, by adjusting for the influence of temperature, it is potentially possible to measure the deformation trend more accurately, while maintaining a lower cost for the sensors.

Keywords: monitoring system; rock mass; slope stability; strain gauges; thermal behavior.


Conflict of interest statement

The authors declare no conflict of interest. The funders had no role in the design of the study; in the collection, analyses, or interpretation of data; in the writing of the manuscript; or in the decision to publish the results.

Figures

Figure A1
Figure A1
Wheatstone bridge scheme. P1–4: positions of gauges/resistors, PS: power source, sgO: strain gauges output. Strain gauges are configured in Wheatstone bridge circuits to detect small changes in resistance.
Figure A2
Figure A2
Methodological flow chart. An IoT network allowed to transmit and process the data from the installed devices in situ. In a post processing stage, an accurate estimation of the main factors affecting the sensors are evaluated through mathematical formulations. Finally, a result highlighting the feasibility of strain gauges for our specific case study is presented.
Figure 1
Figure 1
A sketch of the temperature processes in the instrumented fractures at the test site in Požáry (Czechia). (a,b) Temperature propagates as cyclical input within the active superficial layer, primarily influenced by surface irregularities and exposure. Shadowing and the presence of vegetated areas lead to a possible mismatch between the simulation in the climate chamber and the natural environment, making the test not fully valid for representing the heterogeneity of the natural environment. The dashed rectangle indicates a detail of the instrumented sector of the rock mass. Thermal oscillation experienced by the rock mass in the study area, during the time interval from 16 October to 15 December, ranges from 0 to 18 °C (modified after [35,36,37]).
Figure 2
Figure 2
The Požáry test site. (a) Location of the field laboratory; (b) An overview of the instrumented rock wall; (c) Close-up view of the installed strain gauges and induction crack meters. Red dots show the locality where the core samples were collected, representing the rock mass underneath the glued strain gauges.
Figure 3
Figure 3
Sketch of strain gauge configurations. The figure shows the location of the instruments and the detection of both intact rock and microcrack. The configurations of instruments are presented with their different shapes and orientations (red and blue color) for testing possible distinct behavior under temperature changes.
Figure 4
Figure 4
Data processing. (a) Evaluation of measured temperature variation in blue, strain measurements using ¼ bridge (code MR_8) in green, and 24 h moving average in red. MR_8 was placed in the intact rock and was used as a reference for the behavior of the massive rock; (b,c) Example of daily variation of temperature (blue) and strain (green), in which Pearson correlation coefficient of 0.99 indicates a very high correlation between these two variables, computed using Equation (3).
Figure 5
Figure 5
(a) Rate of the thermal behavior of measured strain (blue) quantified using linear regression (red line) for MR_8 in situ; (b) Rate of thermal behavior of measured strain (blue) quantified using linear regression (red line) for X_1 in climatic chamber. MR_8, C_1 and X_1 have the same configuration of sensors, but all three are different and distinct pieces.
Figure 6
Figure 6
Comparison between strain gauges C_1 and MR_8. The blue line shows the time series of temperature, while the green line represents the product of the difference between C_1 and MR_8 time series of the strain (d) computed using Equation (3). Pearson correlation coefficient demonstrates no dependency between the value of d and the temperature series. In addition, the time series shows no significant trend or predicted error (RMSE).
Figure 7
Figure 7
Strain residual variations (dr) are not statistically explained by temperature influence (green) or solar radiation (blue) in the strain gauge MR_8. This analysis was performed for the strain gauge placed in intact rock; sensors over the microcrack may still be potentially influenced by extreme radiation.

References

    1. Dixon J.L., Heimsath A.M., Amundson R. The Critical Role of Climate and Saprolite Weathering in Landscape Evolution. Earth Surf. Process Landf. 2009;34:1507–1521. doi: 10.1002/esp.1836. - DOI
    1. Riebe C.S., Kirchner J.W., Finkel R.C. Erosional and Climatic Effects on Long-Term Chemical Weathering Rates in Granitic Landscapes Spanning Diverse Climate Regimes. Earth Planet Sci. Lett. 2004;224:547–562. doi: 10.1016/j.epsl.2004.05.019. - DOI
    1. Dixon J.L., Heimsath A.M., Kaste J., Amundson R. Climate-Driven Processes of Hillslope Weathering. Geology. 2009;37:975–978. doi: 10.1130/G30045A.1. - DOI
    1. Oliva P., Viers J., Dupré B. Chemical Weathering in Granitic Environments. Chem. Geol. 2003;202:225–256. doi: 10.1016/j.chemgeo.2002.08.001. - DOI
    1. von Blanckenburg F. The Control Mechanisms of Erosion and Weathering at Basin Scale from Cosmogenic Nuclides in River Sediment. Earth Planet Sci. Lett. 2005;237:462–479. doi: 10.1016/j.epsl.2005.06.030. - DOI

LinkOut - more resources