

Divergent Cytokine and Chemokine Responses at Early Acute Simian Immunodeficiency Virus Infection Correlated with Virus Replication and CD4 T Cell Loss in a Rhesus Macaque Model
- PMID: 36851142
- PMCID: PMC9963901
- DOI: 10.3390/vaccines11020264
Divergent Cytokine and Chemokine Responses at Early Acute Simian Immunodeficiency Virus Infection Correlated with Virus Replication and CD4 T Cell Loss in a Rhesus Macaque Model
Abstract
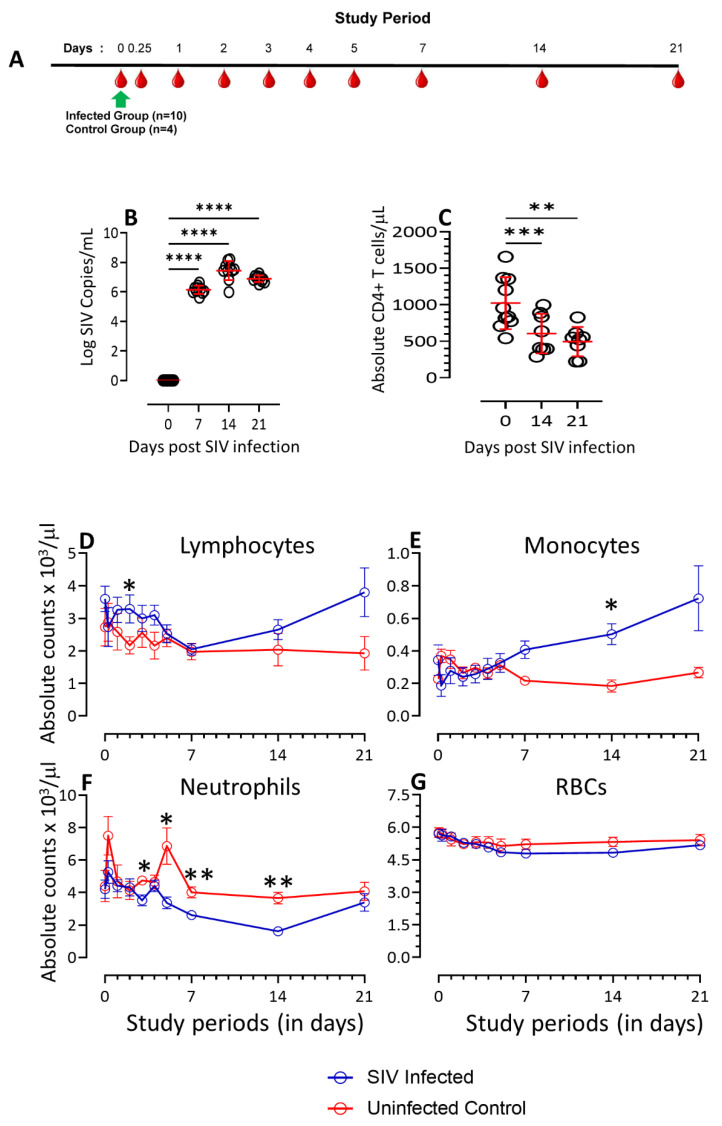
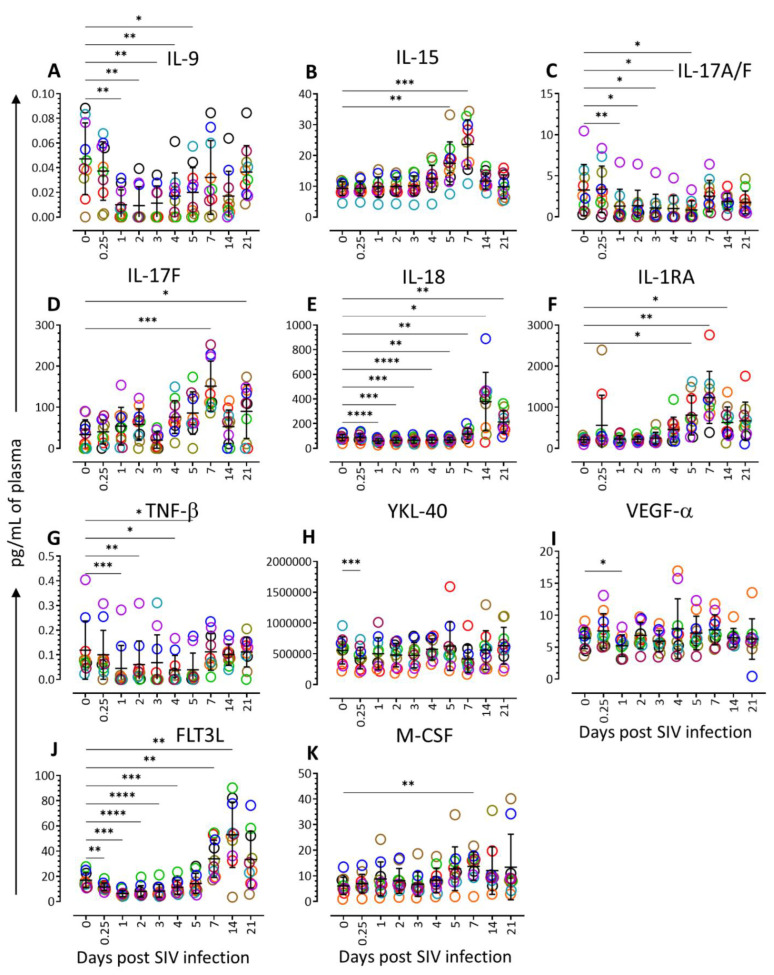
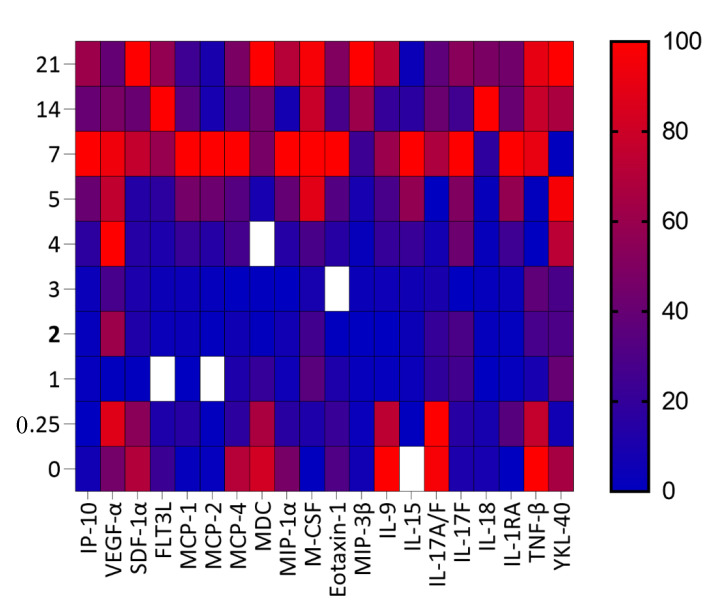
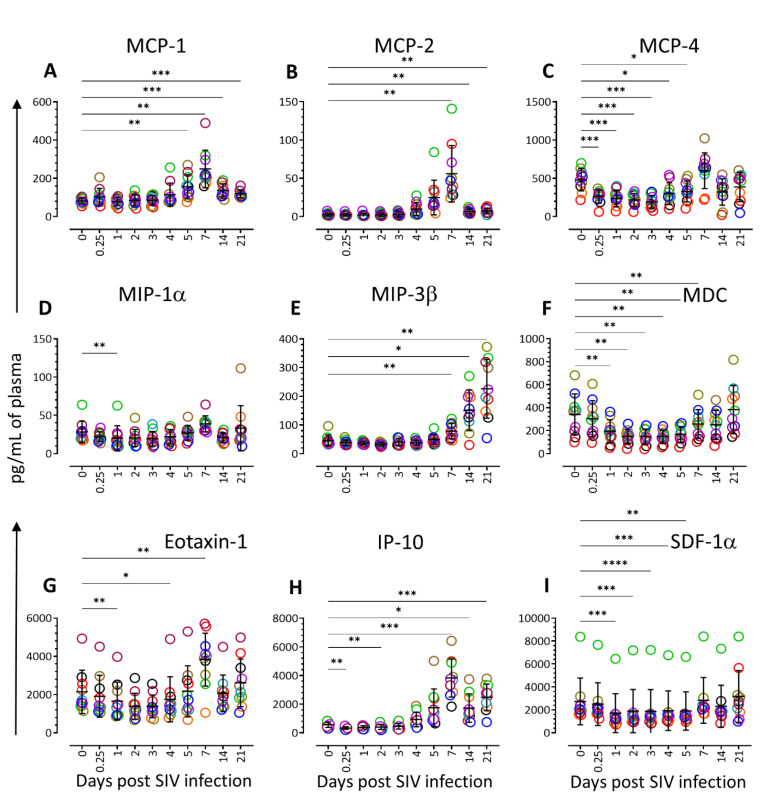
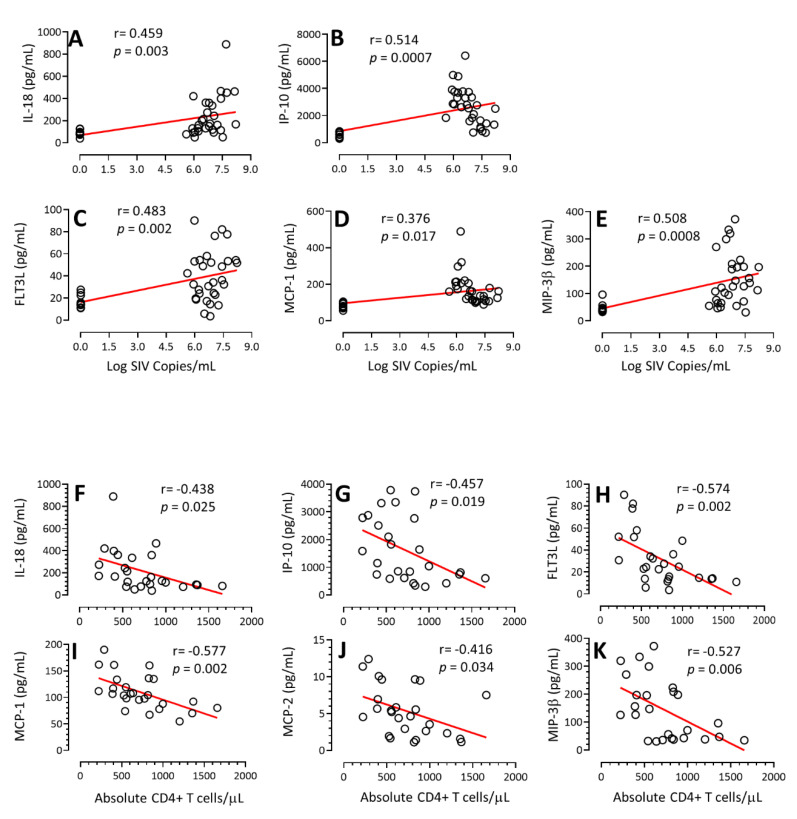
Cytokine and chemokine levels remain one of the significant predictive factors of HIV pathogenesis and disease outcome. Understanding the impact of cytokines and chemokines during early acute infection will help to recognize critical changes during HIV pathogenesis and might assist in establishing improved HIV treatment and prevention methods. Sixty-one cytokines and chemokines were evaluated in the plasma of an SIV-infected rhesus macaque model. A substantial change in 11 cytokines/growth factors and 9 chemokines were observed during acute infection. Almost all the cytokines/chemokines were below the baseline values for an initial couple of days of infection. We detected six important cytokines/chemokines, such as IL-18, IP-10, FLT3L, MCP-1, MCP-2, and MIP-3β, that can be used as biomarkers to predict the peripheral CD4+ T cell loss and increased viral replication during the acute SIV/HIV infection. Hence, regulating IL-18, IP-10, FLT3L, MCP-1, MCP-2, and MIP-3β expression might provide an antiviral response to combat acute SIV/HIV infection.
Keywords: SIV; acute infection; chemokines; cytokines; peripheral blood; rhesus macaque.
Conflict of interest statement
The authors declare no conflict of interest.
Figures
Similar articles
-
Toll-like Receptor 2 Mediated Immune Regulation in Simian Immunodeficiency Virus-Infected Rhesus Macaques.Vaccines (Basel). 2023 Dec 17;11(12):1861. doi: 10.3390/vaccines11121861. Vaccines (Basel). 2023. PMID: 38140264 Free PMC article.
-
Cytokine/Chemokine responses in activated CD4+ and CD8+ T cells isolated from peripheral blood, bone marrow, and axillary lymph nodes during acute simian immunodeficiency virus infection.J Virol. 2014 Aug;88(16):9442-57. doi: 10.1128/JVI.00774-14. Epub 2014 Jun 11. J Virol. 2014. PMID: 24920807 Free PMC article.
-
Acute Simian Immunodeficiency Virus Infection Triggers Early and Transient Interleukin-7 Production in the Gut, Leading to Enhanced Local Chemokine Expression and Intestinal Immune Cell Homing.Front Immunol. 2017 May 19;8:588. doi: 10.3389/fimmu.2017.00588. eCollection 2017. Front Immunol. 2017. PMID: 28579989 Free PMC article.
-
Multiple roles for chemokines in the pathogenesis of SIV infection.Curr HIV Res. 2009 Jan;7(1):73-82. doi: 10.2174/157016209787048537. Curr HIV Res. 2009. PMID: 19149556 Free PMC article. Review.
-
Chemokines and Chemokine Receptors: Accomplices for Human Immunodeficiency Virus Infection and Latency.Front Immunol. 2017 Oct 16;8:1274. doi: 10.3389/fimmu.2017.01274. eCollection 2017. Front Immunol. 2017. PMID: 29085362 Free PMC article. Review.
Cited by
-
Differential kinetics of splenic CD169+ macrophage death is one underlying cause of virus infection fate regulation.Cell Death Dis. 2023 Dec 18;14(12):838. doi: 10.1038/s41419-023-06374-y. Cell Death Dis. 2023. PMID: 38110339 Free PMC article.
-
Toll-like Receptor 2 Mediated Immune Regulation in Simian Immunodeficiency Virus-Infected Rhesus Macaques.Vaccines (Basel). 2023 Dec 17;11(12):1861. doi: 10.3390/vaccines11121861. Vaccines (Basel). 2023. PMID: 38140264 Free PMC article.
-
Prediction of the Co-receptor usage of the main worldwide HIV-1 subtypes, CRF, and CRF35-AD in Iranian patients via the five genotypic tools.Biochem Biophys Rep. 2025 Feb 17;41:101939. doi: 10.1016/j.bbrep.2025.101939. eCollection 2025 Mar. Biochem Biophys Rep. 2025. PMID: 40034260 Free PMC article.
References
-
- Kenway-Lynch C.S., Das A., Lackner A.A., Pahar B. Cytokine/Chemokine responses in activated CD4+ and CD8+ T cells isolated from peripheral blood, bone marrow, and axillary lymph nodes during acute simian immunodeficiency virus infection. J. Virol. 2014;88:9442–9457. doi: 10.1128/JVI.00774-14. - DOI - PMC - PubMed
Grants and funding
LinkOut - more resources
Full Text Sources
Research Materials
Miscellaneous
