. 2023 Jan 20;15(2):296.
doi: 10.3390/v15020296.

Stochastic Modelling of HIV-1 Replication in a CD4 T Cell with an IFN Response

Affiliations

Stochastic Modelling of HIV-1 Replication in a CD4 T Cell with an IFN Response

Igor Sazonov et al. Viruses. .

Abstract

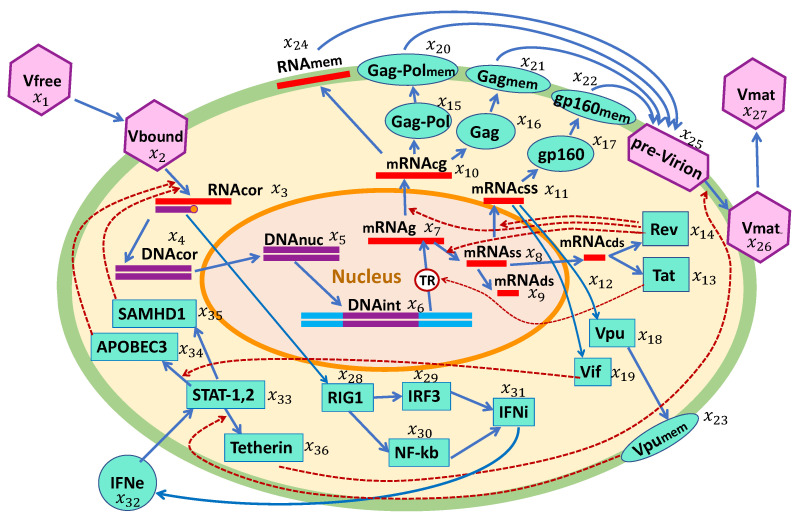
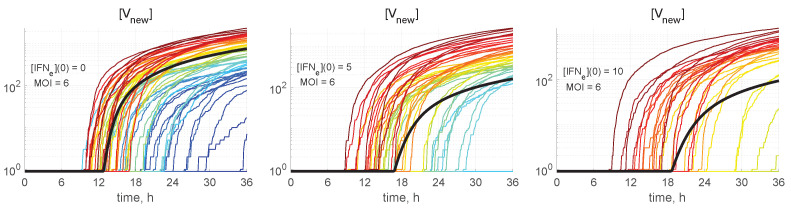
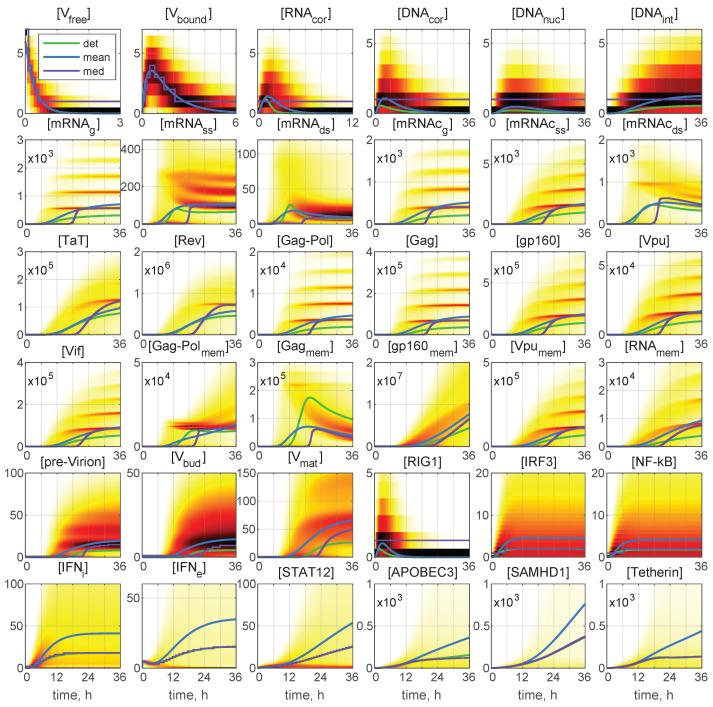
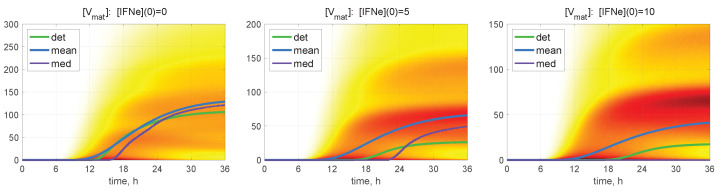
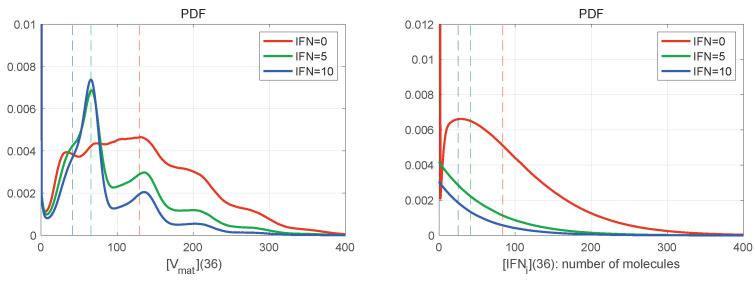
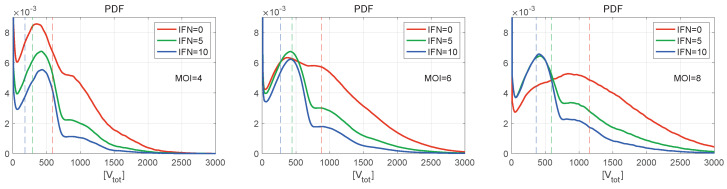
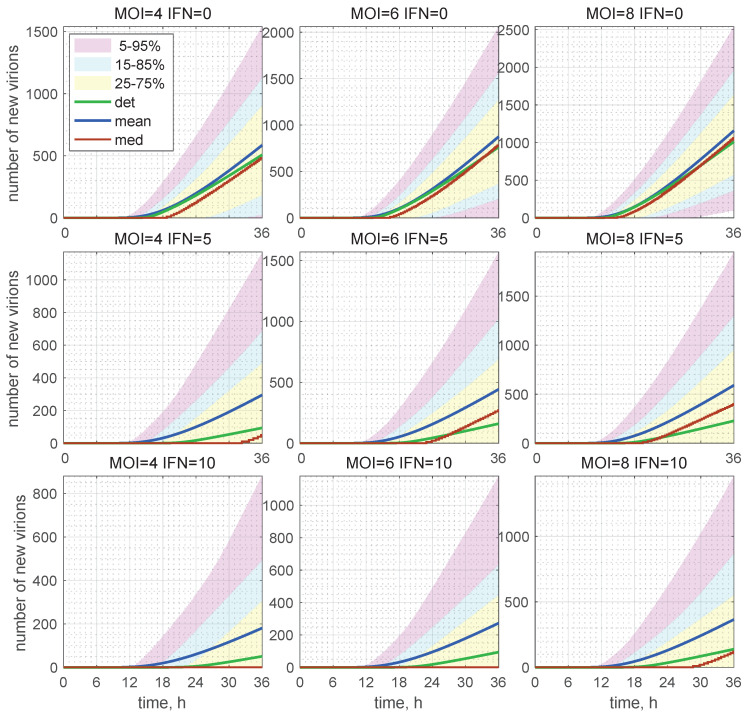
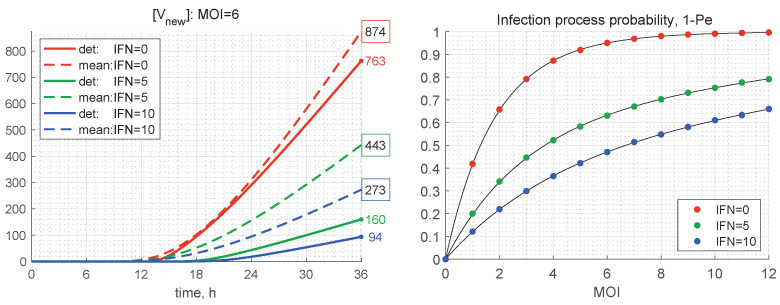
A mathematical model of the human immunodeficiency virus Type 1 (HIV-1) life cycle in CD4 T cells was constructed and calibrated. It describes the activation of the intracellular Type I interferon (IFN-I) response and the IFN-induced suppression of viral replication. The model includes viral replication inhibition by interferon-induced antiviral factors and their inactivation by the viral proteins Vpu and Vif. Both deterministic and stochastic model formulations are presented. The stochastic model was used to predict efficiency of IFN-I-induced suppression of viral replication in different initial conditions for autocrine and paracrine effects. The probability of virion excretion for various MOIs and various amounts of IFN-I was evaluated and the statistical properties of the heterogeneity of HIV-1 and IFN-I production characterised.

Keywords: HIV life cycle; Markov chain Monte Carlo method; Type I interferon (IFN-I); mathematical model; sensitivity analysis; stochastic processes; viral dynamics.


Conflict of interest statement

The authors declare no conflict of interest.

Figures

Figure 1
Figure 1
Biochemical scheme of the HIV-1 replication cycle in the presence of an IFN-I response. The consecutive chain of elementary processes comprises: viral entry, reverse transcription, integration into the chromosome, transcription and splicing of viral RNAs, translation of proteins including the proteins inhibiting the action of ISGs, assembly of pre-virions, budding and release of mature virions, sensing of viral RNAs, IFN synthesis, and translation of antiviral proteins by IFN-stimulated genes.
Figure 2
Figure 2
Deterministic trajectories for all components for MOI=6 and for different values of initial interferon [IFNe](0). Red line: 0 molecules; blue line: 5 molecules; green line: 10 molecules. Note that all components are indicated through the number of particles/virions/molecules.
Figure 3
Figure 3
Effectiveness of various processes underlying IFN-mediated suppression of virus replication in a cell in the absence of IFN from other cells, i.e., the autocrine mode of control. Results of the sensitivity analysis of the deterministic model solution ([Vmat](36), [IFNi](36), and [IFNe](36)) with respect to variations in the parameters fTetherin, kSTAT, kIFNi, and kISG. The results correspond to the MOI of [Vfree](0)=6 virions without extracellular IFN signalling: [IFNe](0)=0.
Figure 4
Figure 4
Examples of stochastic realisations for all 36 components for MOI=6 and [IFNe](0)=0. The black curves indicate deterministic trajectories. The larger the released progeny, the closer is the colour to the red end of the spectrum, and vice versa, the lower the output, the closer is the colour towards the blue end of the spectrum. The stochastic trajectories deviate essentially from the deterministic curves, indicating that random fluctuations in the reaction rates and low numbers of the reaction species result in essentially heterogeneity in the viral replication components.
Figure 5
Figure 5
The number of all new virions produced and released by an infected cell in relation to the abundance of external IFN. Stochastic trajectories for [Vnew](t) and different values of initial intercellular IFN, indicated in every plot. The bold black line represents the corresponding deterministic trajectory. The larger the released progeny, the closer is the colour to the red end of the spectrum, and vice versa, the lower the output, the closer is the colour towards the blue end of the spectrum.
Figure 6
Figure 6
Probability density function (PDF) of stochastic realisations. Sliding histograms for 36 components for MOI=6 and [IFNe](0)=5. Furthermore, the deterministic solutions (det), mean values (mean), and medians (med) are plotted (colours for the lines are explained in the legend). A darker colour corresponds to a higher value of the histograms. Multi-hump patterns in the trajectory ensembles are present in the histograms for all the model components.
Figure 7
Figure 7
Probability density function (PDF) of stochastic realisations. Time-varying histograms for [Vmat] are computed for MOI=6 and for different values of [IFNe](0) (indicated in the top of every plot). Furthermore, the deterministic solutions (det), mean values (mean), and medians (med) are plotted (colours for the lines are explained in the legend). A darker colour corresponds to a higher value of the histograms. Multi-hump patterns in the trajectory ensembles are present in the histograms.
Figure 8
Figure 8
Histograms of mature virions (left) and intercellular IFN (right) at time t=36 h for MOI=6 and different values of [IFNe](0). The line colours are explained in the legend. The dashed vertical lines indicate the mean values for the corresponding initial extracellular IFN. The histograms are normalised by the number of realisations to approximate the probability distribution function (PDF). They are slightly smoothed by using the Gaussian filter. Both distributions shown are far from the normal distribution.
Figure 9
Figure 9
Normalised histograms (PDF) for [Vtot](t) for MOI=4 (left), 6 (centre), 8 (right), and for different values of initial interferon [IFNe](0) (the line colours are explained in the legend). The vertical dashed lines indicate the mean values. The curves demonstrate multiple peaks with the peak amplitude decaying faster with the number of produced virions. The right PDF tails look close to Gaussian distributions. The greater the MOI, the lower is the amplitude of the first peak.
Figure 10
Figure 10
Evolution of the histograms for the total number of released virions during the development of an HIV-1 infection process. Time-varying confidence intervals for [Vnew] computed for different MOI and [IFNe](0) indicated in the top of every plot, respectively, as V0 and IFN. Furthermore, the deterministic solutions (det), mean values (mean), and medians (med) are plotted (colours for the patches and lines are explained in the legend). In the presence of extracellular IFN-I, i.e., 10 molecules per cell, the median is identically zero (left bottom). This means that, in more than 50% of cases, the stochastic replication process is extinct and new virions are not produced.
Figure 11
Figure 11
(Left) Time variation of the number of produced new virions according to the deterministic model (solid) and its mean value in the stochastic model (dashed) for MOI=6 and different values of [IFNe](0) (the line colours are explained in the legend). The coloured numbers indicate the total number of new virions [Vtot] calculated by the deterministic model for different values of [IFNe]. The black numbers in the coloured boxes indicate the mean values of [Vtot] computed by the stochastic model. (Right) Probability for productive infection of a target cell in relation to the initial number of free virions per cell MOI and the initial concentration of extracellular IFN (explained in the legend).

References

    1. Manion M., Rodriguez B., Medvik K., Hardy G., Harding C.V., Schooley R.T., Pollard R., Asmuth D., Murphy R., Barker E., et al. Interferon-alpha administration enhances CD8+ T Cell activation in HIV infection. PLoS ONE. 2012;7:e30306. doi: 10.1371/journal.pone.0030306. - DOI - PMC - PubMed
    1. Murira A., Lamarre A. Type-I Interferon responses: From friend to foe in the battle against chronic viral infection. Front. Immunol. 2016;7:609. doi: 10.3389/fimmu.2016.00609. - DOI - PMC - PubMed
    1. Soper A., Kimura I., Nagaoka S., Konno Y., Yamamoto K., Koyanagi Y., Sato K. Type I interferon responses by HIV-1 infection: Association with disease progression and control. Front. Immunol. 2018;8:1823. doi: 10.3389/fimmu.2017.01823. - DOI - PMC - PubMed
    1. Iyer S.S., Bibollet-Ruche F., Sherrill-Mix S., Learn G.H., Plenderleith L., Smith A.G., Barbian H.J., Russell R.M., Gondim M.V.P., Bahari C.Y., et al. Resistance to type 1 interferons is a major determinant of HIV-1 transmission fitness. Proc. Natl. Acad. Sci. USA. 2017;114:E590–E599. doi: 10.1073/pnas.1620144114. - DOI - PMC - PubMed
    1. Wang B., Kang W., Zuo J., Kang W., Sun Y. The significance of Type-I interferons in the pathogenesis and therapy of human immunodeficiency virus 1 infection. Front. Immunol. 2017;8:1431. doi: 10.3389/fimmu.2017.01431. - DOI - PMC - PubMed

Publication types