. 2023 Jan 26;15(2):350.
doi: 10.3390/v15020350.

Marburg and Ebola Virus Infections Elicit a Complex, Muted Inflammatory State in Bats

Affiliations

Marburg and Ebola Virus Infections Elicit a Complex, Muted Inflammatory State in Bats

Anitha D Jayaprakash et al. Viruses. .

Abstract

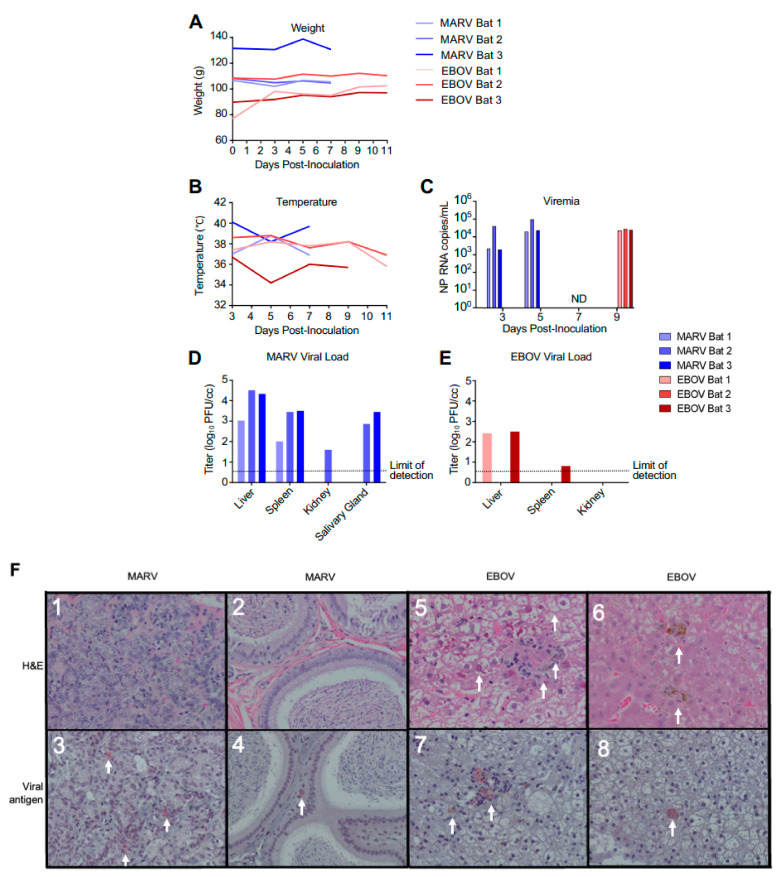
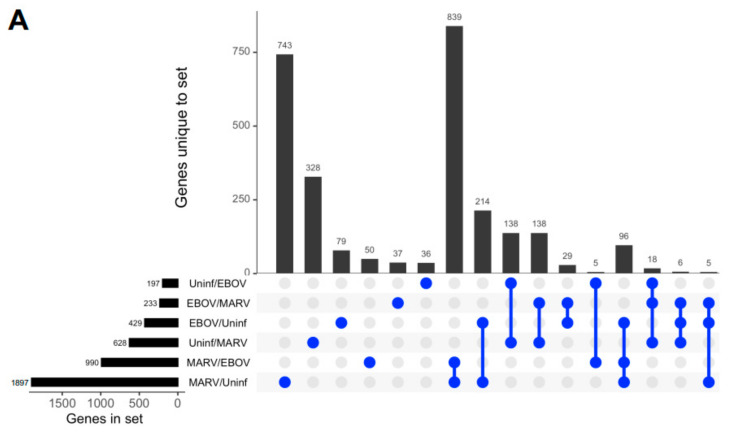
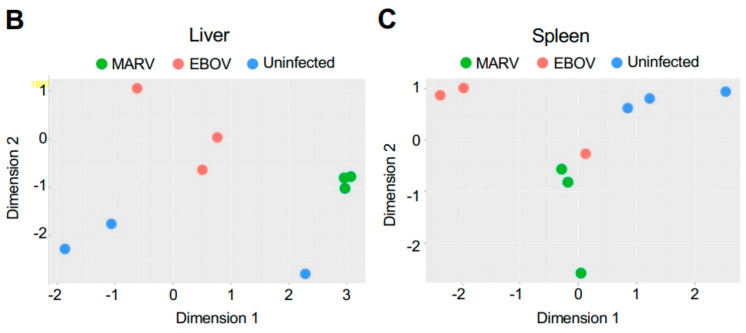
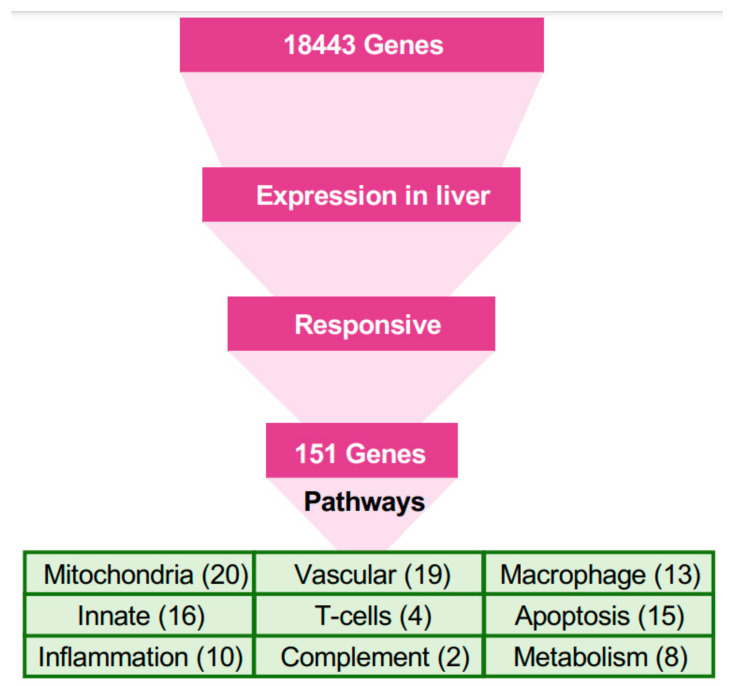
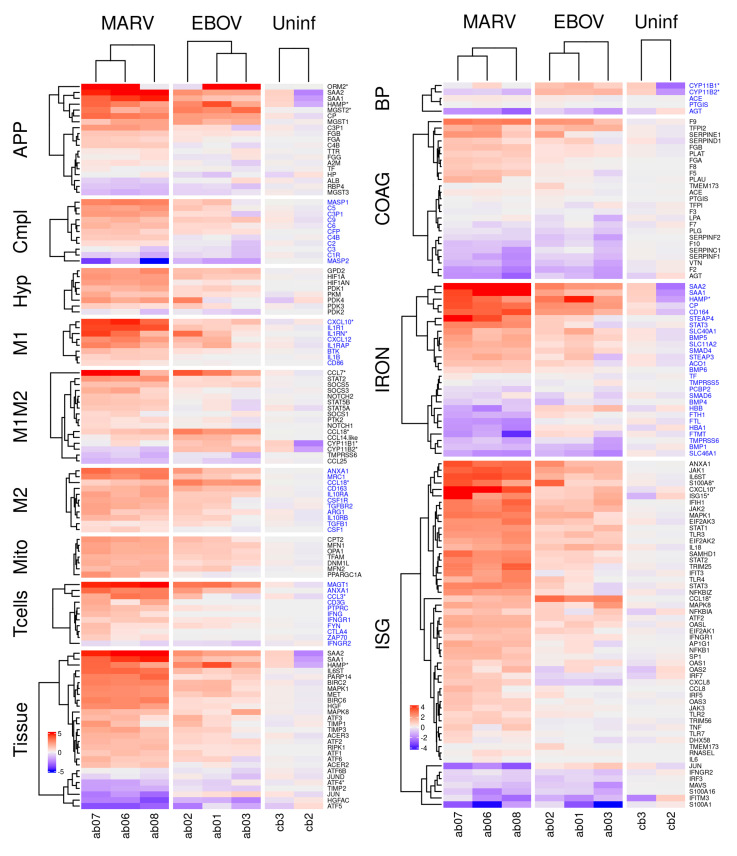
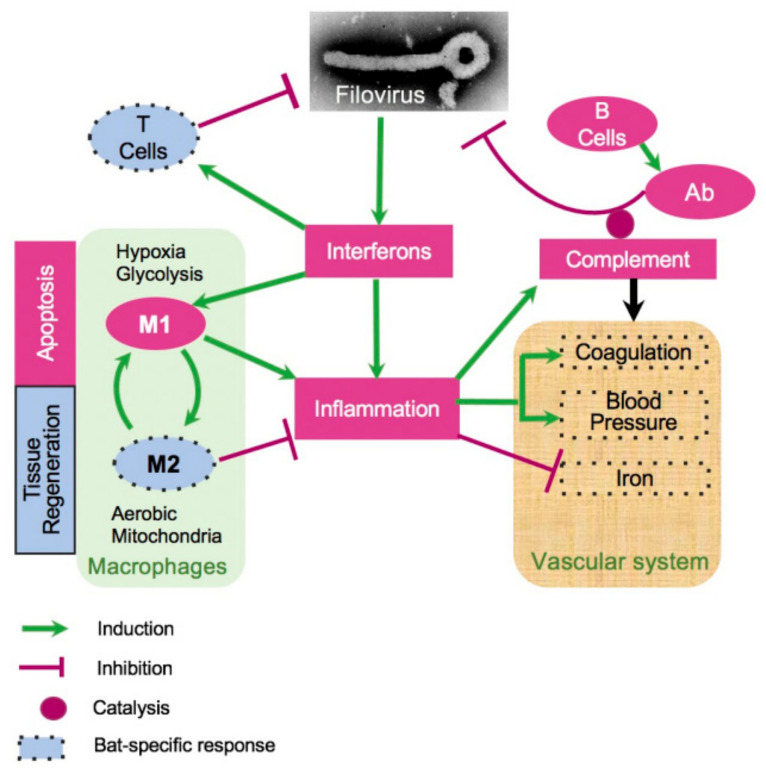
The Marburg and Ebola filoviruses cause a severe, often fatal, disease in humans and nonhuman primates but have only subclinical effects in bats, including Egyptian rousettes, which are a natural reservoir of Marburg virus. A fundamental question is why these viruses are highly pathogenic in humans but fail to cause disease in bats. To address this question, we infected one cohort of Egyptian rousette bats with Marburg virus and another cohort with Ebola virus and harvested multiple tissues for mRNA expression analysis. While virus transcripts were found primarily in the liver, principal component analysis (PCA) revealed coordinated changes across multiple tissues. Gene signatures in kidney and liver pointed at induction of vasodilation, reduction in coagulation, and changes in the regulation of iron metabolism. Signatures of immune response detected in spleen and liver indicated a robust anti-inflammatory state signified by macrophages in the M2 state and an active T cell response. The evolutionary divergence between bats and humans of many responsive genes might provide a framework for understanding the differing outcomes upon infection by filoviruses. In this study, we outline multiple interconnected pathways that respond to infection by MARV and EBOV, providing insights into the complexity of the mechanisms that enable bats to resist the disease caused by filoviral infections. The results have the potential to aid in the development of new strategies to effectively mitigate and treat the disease caused by these viruses in humans.

Keywords: Ebola virus; Marburg virus; bat; inflammation; transcriptome.


Conflict of interest statement

Author Anitha D. Jayaprakash is employed by Girihlet Inc., and author Michael F. Covington is employed by Amaryllis Nucleics. The remaining authors declare that the research was conducted in the absence of any commercial or financial relationships that could be construed as a potential conflict of interest.

Figures

Figure 1
Figure 1
Infection of bats with filoviruses MARV and EBOV. (AC). Time course after infection for weight (A), temperature (B), and viral RNA specific for the NP gene in total RNA extracted from whole blood (C). Animals were euthanized 48 h after first viremic time point. ND, not detected for EBOV (the MARV-infected bats were euthanized at this time point). (D,E). Tissue viral loads on day 7 for EBOV (D) and day 11 for MARV (E) determined by plaque assay. Note that transponders in MARV-infected bat 2 and EBOV-infected bat 1 on 11 dpi failed. (F). Histopathology and viral antigen in filovirus infected organs showing: (F1) Lack of significant histopathological lesions in mammary tissue from MARV-infected bat 1, (F2) Lack of significant histopathological lesions within the interstitium of the epididymis from MARV-infected bat 3, (F3) IHC detection of MARV antigen within the interstitium of the glandular structures of the mammary gland from MARV-infected bat 1 (red pigment, arrows), (F4) IHC detection of MARV antigen within the interstitium of the epididymis from MARV-infected bat 3 (red pigment, arrows), (F5) EBOV-infected bat 1 liver with marked histopathological changes, including cytoplasmic and nuclear inclusions (arrows), (F6) EBOV-infected bat 2 liver displaying a less dramatic presentation compared to bat 1 (arrows), (F7) IHC detection of EBOV antigen in the liver of EBOV-infected bat 1 (arrows), (F8) IHC detection of EBOV antigen in EBOV-infected bat 1 liver (an arrow).
Figure 2
Figure 2
Changes in gene expression patterns in bats after infections with MARV and EBOV. (A). An UpSet plot of the gene expression data in the livers of bats infected with MARV, EBOV, or uninfected. Responsive genes are placed into six groups (MARV/Uninf, MARV/EBOV, EBOV/Uninf, EBOV/MARV, Uninf/MARV, and Uninf/EBOV) listed in the lower left panel. Each group consists of genes whose expression is increased at least 2-fold versus the comparator, e.g., EBOV/Uninf comprises genes upregulated in EBOV-infected bats compared to the uninfected bats, while Uninf/EBOV comprises genes downregulated in EBOV-infected bats compared to the uninfected bats. A gene can belong to multiple groups, as indicated by the blue dots. The first vertical bar in the graph represents the 743 genes that are unique to the MARV/Uninf set, while the last bar represents the 5 genes that occur only in the combination of 3 sets, EBOV/MARV, EBOV/Uninf and MARV/Uninf. In the lower left bar plot, the first horizontal bar represents the 197 genes that belong to Uninf/EBOV, which is a sum of the values for the four combinations which include the Uninf/EBOV comparison (36 + 138 + 5 + 18). (B,C). Multidimensional scaling (MDS) plots of the merged gene expression data in livers (B) and the spleens (C) of bats infected with MARV, EBOV, or uninfected. One uninfected bat in panel B is an outlier based on comparison to the two other uninfected bats, which is also seen in the correlations shown in Table S9. The difference for this bat may be explained by its reaction to some stimulus, either an infection or an injury; the animal has been excluded from the downstream analysis. Virus-specific signatures were also detected in kidneys (Figure S1), implying the response to filovirus infections extends to the whole animal.
Figure 2
Figure 2
Changes in gene expression patterns in bats after infections with MARV and EBOV. (A). An UpSet plot of the gene expression data in the livers of bats infected with MARV, EBOV, or uninfected. Responsive genes are placed into six groups (MARV/Uninf, MARV/EBOV, EBOV/Uninf, EBOV/MARV, Uninf/MARV, and Uninf/EBOV) listed in the lower left panel. Each group consists of genes whose expression is increased at least 2-fold versus the comparator, e.g., EBOV/Uninf comprises genes upregulated in EBOV-infected bats compared to the uninfected bats, while Uninf/EBOV comprises genes downregulated in EBOV-infected bats compared to the uninfected bats. A gene can belong to multiple groups, as indicated by the blue dots. The first vertical bar in the graph represents the 743 genes that are unique to the MARV/Uninf set, while the last bar represents the 5 genes that occur only in the combination of 3 sets, EBOV/MARV, EBOV/Uninf and MARV/Uninf. In the lower left bar plot, the first horizontal bar represents the 197 genes that belong to Uninf/EBOV, which is a sum of the values for the four combinations which include the Uninf/EBOV comparison (36 + 138 + 5 + 18). (B,C). Multidimensional scaling (MDS) plots of the merged gene expression data in livers (B) and the spleens (C) of bats infected with MARV, EBOV, or uninfected. One uninfected bat in panel B is an outlier based on comparison to the two other uninfected bats, which is also seen in the correlations shown in Table S9. The difference for this bat may be explained by its reaction to some stimulus, either an infection or an injury; the animal has been excluded from the downstream analysis. Virus-specific signatures were also detected in kidneys (Figure S1), implying the response to filovirus infections extends to the whole animal.
Figure 3
Figure 3
A pathway-based approach for understanding the response to filovirus infections. The approach used in this study was based on identification of pathways relevant to the bat’s resilience to filoviral infections, under the assumption that homologous genes perform similar functions in bats and humans. Since the liver is the locus of viral replication (viral transcripts are mostly found in the mRNA from livers), genes that were highly expressed in livers and responsive to the infection in bats were first identified. The genes were mapped to pathways, and other genes in the pathways were evaluated to identify the systemic response to filovirus infections in bats and to identify key differences from the responses in humans. Blood pressure, coagulation, and iron homeostasis pathways were altered most prominently. The analysis demonstrated changes in glycolysis, which is controlled by hypoxia, which shift the balance of macrophage activation from the M1 (proinflammatory) to the M2 (anti-inflammatory) state. These changes create a pro-inflammatory state that modulates the response and allows the adaptive immune system to clear the infection early, and anti-inflammatory response late. The identified pathways demonstrated incomplete activation of the complement system, likely compromising the antibody response, but strong activation of T cell response, which is likely to play a major role in clearing the infection. The identified pathways are interconnected, leading to the coordinated changes shown in Figure 4 and connections delineated in Figure 5.
Figure 4
Figure 4
Differential expression of genes belonging to the indicated pathways by MARV and EBOV infections in livers of bats. The columns show differentially expressed genes from livers of three MARV-infected bats, three EBOV-infected bats and two uninfected bats. The values are log2 of the fpm values, with the mean values from uninfected animals subtracted. APP: acute phase response proteins; Compl: complement; Hyp: hypoxia related genes; M1 and M2: genes specific to M1 or M2 macrophages, respectively; M1M2: genes common to M1 and M2 macrophages; Mito: genes expressed in mitochondria; Tcells: genes expressed in T cells; Tissue: genes involved in tissue regeneration and apoptosis; BP: genes involved in regulation of blood pressure; ISG: interferon stimulated genes; IRON: genes involved in iron homeostasis; COAG: genes involved in coagulation. A * after a gene name indicates that the bat version is divergent from its human counterpart. Alternate blocks of gene names are colored black/blue to allow easy visual distinction of the blocks. Figure S2A,B show corresponding figures for kidneys and spleens.
Figure 5
Figure 5
A model of bat response to filovirus infections. Interferon stimulated genes (ISG, Figure 4, Figures S2 and S3) cause inflammation, which triggers the acute phase response (APR, Table 1, Figure 4), leading to a cascade of reactions affecting regulation of HAMP (iron, Figure 4 and Figure S6), coagulation (Figure 4, Figures S7 and S8), blood pressure (Figure 4 and Figure S7), and stimulating M1 macrophages (Figure 4, Figures S5, S10 and S11). The pro-inflammatory M1 macrophages phagocytose infected cells and promote apoptosis. Over the course of infection, M1 macrophages are converted to anti-inflammatory M2 macrophages. This process is accompanied by activation of fatty acid oxidation and mitochondrial activity, which are the hallmarks of the M2 macrophage responses (Figure 4, Figures S10 and S11). On the other hand, activation of the complement system is incomplete, potentially leading to a reduced antibody activity (Figure 4 and Figure S5B). Furthermore, filovirus infections were accompanied by downregulation of blood pressure (Figure 4 and Figure S7) and the coagulation system (Figure 4 and Figure S9). The infections are also accompanied by shift in genes regulating iron homeostasis (Figure 4 and Figures S7–S11), which are generally consistent with a greater activation of the M2 macrophage response in case of EBOV infections. The infections resulted in activation of CD8+ T cell response (Figure S5C), presumably contributing to clearance of the infections. The dotted boundaries indicate at pathways which responded to filovirus infections in bats differently from human.

Similar articles

Cited by

References

    1. Rougeron V., Feldmann H., Grard G., Becker S., Leroy E.M. Ebola and Marburg haemorrhagic fever. J. Clin. Virol. 2015;64:111–119. doi: 10.1016/j.jcv.2015.01.014. - DOI - PMC - PubMed
    1. Geisbert T.W., Young H.A., Jahrling P.B., Davis K.J., Larsen T., Kagan E., Hensley L.E. Pathogenesis of Ebola hemorrhagic fever in primate models: Evidence that hemorrhage is not a direct effect of virus-induced cytolysis of endothelial cells. Am. J. Pathol. 2003;163:2371–2382. doi: 10.1016/S0002-9440(10)63592-4. - DOI - PMC - PubMed
    1. Zarocostas J. Hope for the Ebola outbreak in DR Congo. Lancet. 2020;395:773. doi: 10.1016/S0140-6736(20)30495-5. - DOI - PubMed
    1. Dhama K., Karthik K., Khandia R., Chakraborty S., Munjal A., Latheef S.K., Kumar D., Ramakrishnan M.A., Malik Y.S., Singh R., et al. Advances in Designing and Developing Vaccines, Drugs, and Therapies to Counter Ebola Virus. Front. Immunol. 2018;9:1803. doi: 10.3389/fimmu.2018.01803. - DOI - PMC - PubMed
    1. Kortepeter M.G., Dierberg K., Shenoy E.S., Cieslak T.J. Marburg virus disease: A summary for clinicians. Int. J. Infect. Dis. 2020;99:233–242. doi: 10.1016/j.ijid.2020.07.042. - DOI - PMC - PubMed

Publication types