. 2023 Jan 29;15(2):387.
doi: 10.3390/v15020387.

Repetitive Exposure to Bacteriophage Cocktails against Pseudomonas aeruginosa or Escherichia coli Provokes Marginal Humoral Immunity in Naïve Mice

Affiliations

Repetitive Exposure to Bacteriophage Cocktails against Pseudomonas aeruginosa or Escherichia coli Provokes Marginal Humoral Immunity in Naïve Mice

Chantal Weissfuss et al. Viruses. .

Abstract

Phage therapy of ventilator-associated pneumonia (VAP) is of great interest due to the rising incidence of multidrug-resistant bacterial pathogens. However, natural or therapy-induced immunity against therapeutic phages remains a potential concern. In this study, we investigated the innate and adaptive immune responses to two different phage cocktails targeting either Pseudomonas aeruginosa or Escherichia coli-two VAP-associated pathogens-in naïve mice without the confounding effects of a bacterial infection. Active or UV-inactivated phage cocktails or buffers were injected intraperitoneally daily for 7 days in C57BL/6J wild-type mice. Blood cell analysis, flow cytometry analysis, assessment of phage distribution and histopathological analysis of spleens were performed at 6 h, 10 days and 21 days after treatment start. Phages reached the lungs and although the phage cocktails were slightly immunogenic, phage injections were well tolerated without obvious adverse effects. No signs of activation of innate or adaptive immune cells were observed; however, both active phage cocktails elicited a minimal humoral response with secretion of phage-specific antibodies. Our findings show that even repetitive injections lead only to a minimal innate and adaptive immune response in naïve mice and suggest that systemic phage treatment is thus potentially suitable for treating bacterial lung infections.

Keywords: adaptive and innate immunity; immunogenicity; phage therapy; pneumonia.


Conflict of interest statement

S.-M.W. reports non-financial support from Deutsche Gesellschaft für Pneumologie und Beatmungsmedizin e.V., non-financial support from Mukoviszidose e.V., non-financial support from the Universität des Saarlands and personal fees from the German University in Cairo as well as personal fees and non-financial support from the Schlütersche Verlagsgesellschaft for a presentation. Unrelated to this project, G.N. received funding for research from Biotest AG and M.W. received funding for research from Bayer Health Care, Biotest AG, Pantherna, and for lectures and advisory from Actelion, Aptarion, Astra Zeneca, Bayer Health Care, Biotest AG, Boehringer Ingelheim, Chiesi, Glaxo Smith Kline, Inflarx, Insmed, Novartis, Pantherna, Pherecydes, Sinoxa and Teva. The supporting sources had no involvement in study design; collection, analysis, and interpretation of data; writing of the report; and the decision to submit the report for publication.

Figures

Figure 1
Figure 1
Following intraperitoneal injection, phages disseminate via blood without inducing adverse effects. (a) Scheme indicating experimental procedures of the study. Created with Biorender.com. Naive mice (C57BL/6J WT, female, 8–10 weeks; Janvier Labs) were treated (i. p., 100 μL) with active or UV-inactivated phage cocktails against P. aeruginosa or E. coli or buffer at 24 h intervals for 7 days. Analysis time points were 6 h, 10 d or 21 d post-injection. (b) Logarithmic display of phage load at 6 h and 10 d in indicated organs (peritoneal cavity (PC), blood, spleen, alveolar spaces (BAL), and lungs). DL-P. aeruginosa, detection limit of anti-P. aeruginosa phages against PA74 (83 PFU/mL); DL-E. coli, detection limit of anti-E. coli phages against AN33 (10 PFU/mL). Results are shown as mean ± SD; n = 9 mice per group. (c) Graphs displaying body temperature and body weight change over time (dpi, days post-injection). Results are shown as mean ± SEM; n = 9 mice per group (6 h, 10 d) or n = 5–6 (21 d). PMNs, polymorphonuclear neutrophils.
Figure 2
Figure 2
Blood PMNs remain largely unaffected by phage treatment. Bar graphs depicting the percentage and cells/mL of PMNs (a) and monocytes (b) in whole blood at 6 h, 10 d and 21 d time points as determined per complete blood count. Results are shown as mean ± SD, as determined by 2-way ANOVA with Tukey’s multiple comparisons test: * p < 0.05; n = 5–9 mice per group. PMNs, polymorphonuclear neutrophils.
Figure 3
Figure 3
No changes in splenic innate immune cell frequencies and numbers in response to phage cocktail treatment observed. Flow cytometric analysis of (a) PMNs, (b) macrophages and (c) DCs in the spleen. Shown are representative dot plots (left), and bar graphs depicting the percentage of remaining cells (middle) or total cells (right). Results are shown as mean ± SD, as determined by 2-way ANOVA with Tukey’s multiple comparisons test: ** p < 0.01; n = 7–9 mice per group. For full gating strategy and cell type identifying markers see Figure S1. PMNs, polymorphonuclear neutrophils; DCs, dendritic cells.
Figure 4
Figure 4
Splenic dendritic cells are not activated in response to phage cocktail treatment. Flow cytometric analysis of markers of antigen presenting cells (APC) activation (a) MHCII, (b) CD86 and (c) CD80 on DCs from the spleen. Shown are representative histograms (left) and bar graphs depicting the percentage of cells (middle) positive for indicated marker (MHCII, CD86, CD80) or total number of cells positive for indicated marker (right). Results are shown as mean ± SD, as determined by 2-way ANOVA with Tukey’s multiple comparisons test: n = 7–9 mice per group. For full gating strategy see Figure S1. Red lines define positive expression of markers based on fluorescence minus one (FMO) staining. PMNs, polymorphonuclear neutrophils; DCs, dendritic cells.
Figure 5
Figure 5
T cell populations in the draining lymph nodes show no marked changes after phage treatment. Analysis of (a) CD4+, (b) CD8+ and (c) γδTCR+ T cells in the lymph nodes. Shown are representative dot plots (left) and bar graphs depicting the percentage of remaining cells (middle) or total cells (right). Results are shown as mean ± SD, as determined by 2-way ANOVA with Tukey’s multiple comparisons test: * p < 0.05; n = 7–9 mice per group. For full gating strategy and cell type identifying markers see Figure S2.
Figure 6
Figure 6
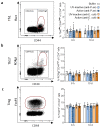
T-helper cell populations in the draining lymph nodes show no marked changes post-phage treatment. Analysis of the effector T-cell subsets (a) Th1, (b) Th17 and (c) Treg in the lymph nodes. Shown are representative dot plots (left) and bar graphs depicting the percentage of remaining cells (right). Results are shown as mean ± SD, as determined by 2-way ANOVA with Tukey’s multiple comparisons test: n = 7–9 mice per group. For full gating strategy and cell type identifying markers see Figure S2.
Figure 7
Figure 7
Phage treatment induces minimal to low-grade germinal center formation. Immunohistochemical staining of germinal center B cells (αGL-7 antibody; red) and hematoxylin (blue). Representative spleen sections (a) and corresponding enlarged images ((b), 20×) from animals at 21 d after start of treatment with (I) buffer, (II) UV-inactive anti-P. aeruginosa phage cocktail, (III) UV-inactive anti-E. coli phage cocktail, (IV) active anti-P. aeruginosa phage cocktail and (V) active anti-E. coli phage cocktail. Bar graph showing germinal center formation scores; n = 2–3 mice per group.
Figure 8
Figure 8
Repetitive phage treatment leads to anti-phage antibodies in plasma. Binding of plasma IgG, IgM and IgA to the active phage cocktails on 10 d and 21 d, as measured by ELISA. Results are shown as mean ± SD, as determined by 2-way ANOVA with Tukey’s multiple comparisons test: * p < 0.05. ** p < 0.01; n = 5–9 mice per group.

References

    1. Anyaegbunam N.J., Anekpo C.C., Anyaegbunam Z.K.G., Doowuese Y., Chinaka C.B., Odo O.J., Sharndama H.C., Okeke O.P., Mba I.E. The resurgence of phage-based therapy in the era of increasing antibiotic resistance: From research progress to challenges and prospects. Microbiol. Res. 2022;264:127155. doi: 10.1016/j.micres.2022.127155. - DOI - PubMed
    1. Gordillo Altamirano F.L., Barr J.J. Phage Therapy in the Postantibiotic Era. Clin. Microbiol. Rev. 2019;32:e00066-18. doi: 10.1128/CMR.00066-18. - DOI - PMC - PubMed
    1. Kalanuria A.A., Ziai W., Zai W., Mirski M. Ventilator-associated pneumonia in the ICU. Crit. Care. 2014;18:208. doi: 10.1186/cc13775. - DOI - PMC - PubMed
    1. Ben Lakhal H., M’Rad A., Naas T., Brahmi N. Antimicrobial Susceptibility among Pathogens Isolated in Early- versus Late-Onset Ventilator-Associated Pneumonia. Infect. Dis. Rep. 2021;13:401–410. doi: 10.3390/idr13020038. - DOI - PMC - PubMed
    1. Mancuso G., Midiri A., Gerace E., Biondo C. Bacterial Antibiotic Resistance: The Most Critical Pathogens. Pathogens. 2021;10:1310. doi: 10.3390/pathogens10101310. - DOI - PMC - PubMed

Publication types

LinkOut - more resources