. 2023 Feb 20;15(2):581.
doi: 10.3390/v15020581.

Diverse Marine T4-like Cyanophage Communities Are Primarily Comprised of Low-Abundance Species Including Species with Distinct Seasonal, Persistent, Occasional, or Sporadic Dynamics

Affiliations

Diverse Marine T4-like Cyanophage Communities Are Primarily Comprised of Low-Abundance Species Including Species with Distinct Seasonal, Persistent, Occasional, or Sporadic Dynamics

Emily Dart et al. Viruses. .

Abstract

Cyanophages exert important top-down controls on their cyanobacteria hosts; however, concurrent analysis of both phage and host populations is needed to better assess phage-host interaction models. We analyzed picocyanobacteria Prochlorococcus and Synechococcus and T4-like cyanophage communities in Pacific Ocean surface waters using five years of monthly viral and cellular fraction metagenomes. Cyanophage communities contained thousands of mostly low-abundance (<2% relative abundance) species with varying temporal dynamics, categorized as seasonally recurring or non-seasonal and occurring persistently, occasionally, or sporadically (detected in ≥85%, 15-85%, or <15% of samples, respectively). Viromes contained mostly seasonal and persistent phages (~40% each), while cellular fraction metagenomes had mostly sporadic species (~50%), reflecting that these sample sets capture different steps of the infection cycle-virions from prior infections or within currently infected cells, respectively. Two groups of seasonal phages correlated to Synechococcus or Prochlorococcus were abundant in spring/summer or fall/winter, respectively. Cyanophages likely have a strong influence on the host community structure, as their communities explained up to 32% of host community variation. These results support how both seasonally recurrent and apparent stochastic processes, likely determined by host availability and different host-range strategies among phages, are critical to phage-host interactions and dynamics, consistent with both the Kill-the-Winner and the Bank models.

Keywords: cyanobacteria; marine; microbial ecology; oceanography; phage; phage–host interactions; viromics.


Conflict of interest statement

The authors declare no conflict of interest.

Figures

Figure 1
Figure 1
Seasonality of whole T4-like cyanophage community is evidenced by Bray–Curtis (BC) similarity scores (gray points) of cyanophage communities as a function of months separating samples. Black points show average BC similarity values. Errors bars are standard error. The black line is a sine fit to average BC values. (A) T4-like cyanophages found in viral fraction metagenomes. p-value for sine fit = 9.90 × 10⁻¹³. (B) T4-like cyanophages found in cellular fraction metagenomes. p-value for sine fit = 2.20 × 10⁻⁵.
Figure 2
Figure 2
T4-like cyanophages belong to one of several dynamic classes. Horizon plots (lower plot in each panel) show select representative cyanophage species belonging to the (A) seasonal, (B) persistent, (C) occasional, and (D) sporadic dynamic categories (see text for descriptions). The top plot in each panel depicts idealized representations of the dynamics of each phage dynamic category. For horizon plots, the relative abundance of each phage species (one species per row) is centered around the mean abundance, with the intensity of color indicating changes in abundance by standard deviations above or below the mean. Gray vertical bars indicate months with missing data.
Figure 3
Figure 3
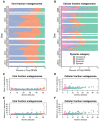
The number of species categorized to each dynamic class (seasonal, persistent, occasional, and sporadic) in the viral and cellular fraction metagenomes (left and right bars, respectively) and an accounting of how each species is categorized differently between each sample type (trapezoids in the middle). Note that seven species detected in the viral fraction metagenomes were not detected in the cellular fraction metagenomes.
Figure 4
Figure 4
The contribution of species to the T4-like cyanophage community. (A,B) Cumulative abundances of cyanophages in each dynamic class in viral (<0.2 µm) (A) and cellular fraction metagenomes (0.2–1.2 µm) (B) as determined by read mapping (RPKM). Results are shown sequentially for each month, with blank lines indicating no data for that month. (C,D) The average percent contribution of each cyanophage species across all time points when present vs. the number of times that viral species was detected (“Months detected”) in (C) viral and (D) cellular fraction metagenomes. (E,F) The maximum percent abundance of each species relative to total T4-like cyanophage abundance across all viral (E) and cellular (F) fraction metagenomes. In (CF), each point represents a distinct cyanophage species.
Figure 5
Figure 5
Rank abundance curve for all viral species across all viral fraction metagenomes. Insert shows ranks between 1 and 100. Viral species abundance depicted on the y-axis is read coverage (RPKM). The shape of this rank abundance curve is typical of microbial communities with a few very abundant species in any given sample and numerous less abundant species.
Figure 6
Figure 6
Network analysis of cyanophages and cyanobacteria. The network depicts correlations among viral species in viral fraction and cellular fraction metagenomes, host ASVs, and ecotypes as determined by eLSA with only strong and significant (Q < 0.05, ρ ≥ 0.6, Spearman correlation) interactions shown. The fill color of phage species indicates the dynamic class to which they belong, and if seasonal, the color indicates the month that they are predicted to be most abundant by the GAMM. For other dynamic classes (sporadic, persistent, or occasional), the outline color indicates the month at which they were most abundant.
Figure 7
Figure 7
Maximum likelihood tree showing assembled gp43 sequences and reference sequences. Tree is rooted using the gp43 sequence for E. coli T4 phage. Colored blocks to the right of the tree indicate to which dynamic class (left column, e.g., see Figure 2) or seasonal group (right column; based on network analysis affiliation from Figure 6) each species belongs. Isolate gp43 reference sequences, which were not detected in metagenomes, are indicated with dark gray blocks, and dashed lines show the location of these reference sequences in the tree.
Figure 8
Figure 8
R2 values from variation partitioning analysis resolving the portion of host community variance explained by environmental variables or viral community structure alone in the (A) virome and (B) cellular metagenome. Analyses were performed using host community data at various taxonomic levels: all host ASVs together (Synechococcus and Prochlorococcus), all host ecotypes together, and ecotypes or ASVs within Synechococcus (Syn.) or Prochlorococcus (Pro.) separately (see x-axis labels). Asterisks over bars indicate significant (p < 0.05) R2 values (Table S4).

References

    1. Sullivan M.B., Waterbury J.B., Chisholm S.W. Cyanophage Infecting the Oceanic Cyanobacterium. Nature. 2003;424:1047–1051. doi: 10.1038/nature01929. - DOI - PubMed
    1. Williamson S.J., Rusch D.B., Yooseph S., Halpern A.L., Heidelberg K.B., Glass J.I., Andrews-Pfannkoch C., Fadrosh D., Miller C.S., Sutton G., et al. The Sorcerer II Global Ocean Sampling Expedition: Metagenomic Characterization of Viruses within Aquatic Microbial Samples. PLoS ONE. 2008;3:e1456. doi: 10.1371/journal.pone.0001456. - DOI - PMC - PubMed
    1. Weitz J.S., Wilhelm S.W. Ocean Viruses and Their Effects on Microbial Communities and Biogeochemical Cycles. F1000 Biol. Rep. 2012;4:17. doi: 10.3410/B4-17. - DOI - PMC - PubMed
    1. Parsons R.J., Breitbart M., Lomas M.W., Carlson C.A. Ocean Time-Series Reveals Recurring Seasonal Patterns of Virioplankton Dynamics in the Northwestern Sargasso Sea. ISME J. 2012;6:273–284. doi: 10.1038/ismej.2011.101. - DOI - PMC - PubMed
    1. Hevroni G., Flores-Uribe J., Béjà O., Philosof A. Seasonal and Diel Patterns of Abundance and Activity of Viruses in the Red Sea. Proc. Natl. Acad. Sci. USA. 2020;117:29738–29747. doi: 10.1073/pnas.2010783117. - DOI - PMC - PubMed

Publication types

LinkOut - more resources